
Abstract
Thromboembolic events are common in patients with essential thrombocythemia (ET). However, the pathophysiological mechanisms underlying the increased thrombotic risk remain to be determined. Here, we perform the first phenotypical characterization of platelet expression using single-cell mass cytometry in six ET patients and six age- and sex-matched healthy individuals. A large panel of 18 transmembrane regulators of platelet function and activation were analyzed, at baseline and after ex-vivo stimulation with thrombin receptor-activating peptide (TRAP). We detected a significant overexpression of the activation marker CD62P (p-Selectin) (p = .049) and the collagen receptor GPVI (p = .044) in non-stimulated ET platelets. In contrast, ET platelets had a lower expression of the integrin subunits of the fibrinogen receptor GPIIb/IIIa CD41 (p = .036) and CD61 (p = .044) and of the von Willebrand factor receptor CD42b (p = .044). Using the FlowSOM algorithm, we identified 2 subclusters of ET platelets with a prothrombotic expression profile, one of them (cluster 3) significantly overrepresented in ET (22.13% of the total platelets in ET, 2.94% in controls, p = .035). Platelet counts were significantly increased in ET compared to controls (p = .0123). In ET, MPV inversely correlated with platelet count (r=-0.96). These data highlight the prothrombotic phenotype of ET and postulate GPVI as a potential target to prevent thrombosis in these patients.
Plain Language Summary
Essential thrombocythemia (ET) is a rare disease characterized by an increased number of platelets in the blood. As a complication, many of these patients develop a blood clot, which can be life-threatening. So far, the reason behind the higher risk of blood clots is unclear. In this study, we analyzed platelet surface markers that play a critical role in platelet function and platelet activation using a modern technology called mass cytometry. For this purpose, blood samples from 6 patients with ET and 6 healthy control individuals were analyzed. We found significant differences between ET platelets and healthy platelets. ET platelets had higher expression levels of p-Selectin (CD62P), a key marker of platelet activation, and of the collagen receptor GPVI, which is important for clot formation. These results may be driven by a specific platelet subcluster overrepresented in ET. Other surface markers, such as the fibrinogen receptor GPIIb/IIIa CD41, CD61, and the von Willebrand factor receptor CD42b, were lower expressed in ET platelets. When ET platelets were treated with the clotting factor thrombin (thrombin receptor-activating peptide, TRAP), we found a differential response in platelet activation compared to healthy platelets. In conclusion, our results show an increased activation and clotting potential of ET platelets. The platelet surface protein GPVI may be a potential drug target to prevent abnormal blood clotting in ET patients.
Introduction
Essential thrombocythemia (ET) is a clonal myeloproliferative neoplasm (MPN) caused by hematopoietic driver mutations in genes encoding Janus kinase 2 (JAK2), calreticulin (CALR) or the thrombopoietin receptor (MPL) and characterized by an overproduction of platelets.Citation1 Despite a largely indolent clinical course of the disease, thrombotic events are a common complication in these patients, causing relevant morbidity and mortality.Citation2 The most important clinical risk factors for thrombosis in ET are old age, a previous history of thrombosis, and uncontrolled thrombocytosis, which also represent an indication for cytoreductive therapy.Citation3 Current therapeutic options for these patients comprise hydroxyurea, anagrelide and interferon alfa-2a.Citation4 Additionally, the presence of a JAK2 mutation or conventional cardiovascular risk factors have been associated with a higher rate of thrombosis.Citation5 The use of aspirin to reduce the risk of thrombosis has only shown benefits in the presence of cardiovascular risk factors.Citation5 However, prospective studies evaluating antithrombotic drugs to prevent thrombotic events in ET are lacking. Since some patients with ET develop serious bleeding complications related to aspirin, it is urgently necessary to find risk-adapted antithrombotic strategies for these patients that combine clinical and molecular markers of thrombosis and bleeding.Citation6
Nevertheless, the pathophysiological mechanisms related to an increased risk of thrombosis in ET are still not fully understood. The proliferation of genetically aberrant clones at the hematopoietic stem cell level results in quantitative and qualitative alterations of circulating blood cells,Citation7,Citation8 causing a prothrombotic phenotype that promotes cellular adhesion, activates the endothelium and triggers the coagulation cascade.Citation9,Citation10 Previous studies have demonstrated enhanced platelet activation in ET patients by flow-cytometry.Citation7,Citation11,Citation12 Of note, markers of platelet activation were significantly higher in ET patients with a previous history of thrombosis and in ET patients harboring a JAK2 mutation compared to CALR mutated patients.Citation7,Citation11,Citation13 But these results showed high variability, possibly related to the divergent experimental approaches and the differences in the study populations. Thus, further translational studies elucidating the prothrombotic state of ET are warranted.
In this exploratory approach, we perform the first phenotypical characterization of platelets in ET patients using single-cell mass cytometry by time of flight (CyTOF). We investigate the expression of platelet surface proteins and activation markers at baseline and after ex-vivo activation in ET patients and in matched healthy individuals with a recently established CyTOF antibody panel.Citation14,Citation15
Methods
Study design and participants
Our study included six patients with ET from our hematologic outpatient clinic (Klinikum rechts der Isar, Munich, Germany), with no other preexisting disorders, and six healthy sex-matched and age-matched controls (). ET was defined according to the revised World Health Organization (WHO) classification of myeloid neoplasms and acute leukemia.Citation16 Exclusion criteria were relevant comorbidities requiring medication or hospitalization.
Table I. Study cohort demographics. Clinical characteristics of the included control subjects and ET patients. ET: essential thrombocythemia. n.d.: mutation analysis not performed.
Ethical approval
This study was carried out in accordance with the Declaration of Helsinki and was approved by the Ethics Committee of the Technical University of Munich (approval number 362/19S). All participants provided written informed consent.
Sample collection and preparation
Peripheral venous blood was drawn from each donor using a 21 G safety-multifly needle, collected in 3 mL 3.2% citrate tube and subsequently processed to obtain platelet-rich plasma (PRP). Staining for CyTOF analysis was performed as previously described.Citation14,Citation15,Citation17 Briefly, one baseline sample (non-stimulated platelets) and one sample stimulated with 10 μM thrombin receptor-activating peptide (TRAP) were generated from each PRP sample. For stimulation, a TRAP-6 amide trifluoroacetate salt agonist with the peptide sequence H - Ser - Phe - Leu - Leu - Arg - Asn -NH2 (Bachem AG) was used. Isolated platelets were labeled for 30 min with a custom-made CyTOF panel of 18 antibodies (for the activation markers anti-CD62P-161Dy, anti-CD63-150Nd, anti-CD107a-151Eu, anti-CD154-168Er and for the constitutive markers anti-CD3-170Er, anti-CD9-171Yb, anti-CD29-156Gd, anti-CD31-145Nd, anti-CD36-152Sm, anti-CD41-89Y, anti-CD42a-141Pr, anti-CD42b-144Nd, anti-CD47-209Bi, anti-CD61-146Nd, anti-CD69-162Dy, anti-GPVI-175Lu, anti-PAR1-147Sm, and anti-PEAR-174Yb). Samples were subsequently processed in accordance with the Maxpar cell surface staining protocol and as described previously.Citation14,Citation15,Citation17
Mass cytometry
Five antibodies (CD62P, PEAR, PAR1, CD42a, and GPVI) were custom-conjugated and attached to isotopically enriched lanthanide metals using the Fluidigm Maxpar antibody conjugation kit. The other antibodies were pre-conjugated, CyTOF-ready, and commercially available (Fluidigm Sciences). Samples were stored at −80°C with DMSO/fetal bovine serum until acquisition as previously described.Citation15,Citation18 Cells were washed twice with cell acquisition solution and once with H2O before being diluted in 10% EQ calibration beads in cell acquisition solution to a final concentration of 1,000,000 platelets/mL. The samples were analyzed at the Helios CyTOF (Fluidigm) system at a pace of 200 to 350 events per second, acquiring a total of 300,000 events per sample.
CyTOF post-processing
Samples were normalized, processed, and pre-gated using the Cytobank software (www.cytobank.org, Beckman Coulter, US).Citation19 To select exclusively platelets and avoid possible contaminations, only CD41 (GPIIb) and CD61 (GPIIIa) positive events were considered. As a further negative control, the CD3 marker was included in the panel. The previously described gating strategy was used.Citation14,Citation15 The median and mean signal intensity of each sample was calculated.
Statistical analysis
Cytobank was used to process CyTOF data, while R 4.0 (R Development Core Team, 2005) and Python 3.6 were used for analysis (Python 3 Reference Manual, 2009). The statsmodels v0.11.1 python package29 was used to create and assess each model. To cover differences and variation between samples the minimum number of events available in all samples was used. Differential expression analysis, uniform manifold approximation (UMAP) and clustering analysis was performed using the R packages diffcyt and CATALYST, usable as a R shiny app (https://exbio.wzw.tum.de/cyanus/). For differential expression analysis we used the CyEMD algorithm which uses the overall distribution of marker expression and marker expression in clusters to compare different conditions as previously described.Citation15,Citation20 The earth mover’s distance (EMD) value, which is calculated by CyEMD using p-values via permutation tests, indicates the distance to transform one expression distribution into another. Dimensionality reduction was also performed using Cytobanks optimized t-distributed stochastic neighbor embedding algorithm (optSNE) to represent marker expression of single control or patient samples.Citation21
Clustering analysis
The clustering method employed in this study involves a two-step process to detect and define distinct cell populations for subsequent downstream analysis.
In the first step, we used FlowSOM clustering, a self-organizing map (SOM) based approach, which groups cells into clusters based on their characteristics.Citation22
Subsequently, in the meta-clustering step, we employ ConsensusClusterPlus (https://doi.org/10.1093/bioinformatics/btq170), a method known for determining optimal cluster count and membership by assessing stability evidence. The choice of cluster count was guided by the relative change in the area under the cumulative distribution function curve.
Blinding/masking procedures
Blinding/masking procedures were not implemented in our wet laboratory experiment due to the specific design and constraints of our experiment. However, in order to ensure the integrity and validity of our results, the bioinformatic data analyses have been performed in a blinded fashion.
Data and code availability
Mass cytometry data are available at flowrepository.org, repository ID FR-FCM-Z5MJ. The bioinformatic pipeline can be accessed at https://github.com/BongiovanniLab/essential-thrombocythemia-project.
Results
Study population characteristics
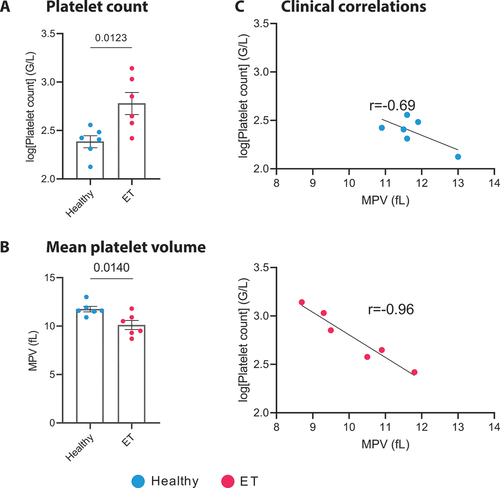
Six patients with ET from our outpatient clinic were compared to a matched control group of six healthy donors (mean age ET: 51.5 ± 12.1, controls: 49.0 ± 11.8, p = .738; male ET: 50%, controls: 50%). Patients showed typical JAK2, CALR or MPL mutations, increased platelet counts (ET: 709.1 ± 440.2×10³ platelets/µL, controls: 253.6 ± 78.6×10³ platelets/µL, p = .0123, ) and a decreased mean platelet volume (MPV ET: 10.1 ± 1.1 fL, controls: 11.75 ± 0.6 fL, p = .014, ). The individual platelet counts of patients and healthy control subjects are indicated in Supplementary Table S1. Two patients with ET did not receive any therapy, two were treated with hydroxyurea and two patients with ropeginterferon alfa-2b. Two patients received thrombotic prophylaxis with aspirin (100 mg once daily). A summary of the individual platelet counts, treatment regimens, and marker expression levels for the ET cohort and the healthy controls is provided in Supplementary Table S1 and Supplementary Table S2.
Platelet surface receptor expression in non-stimulated platelets
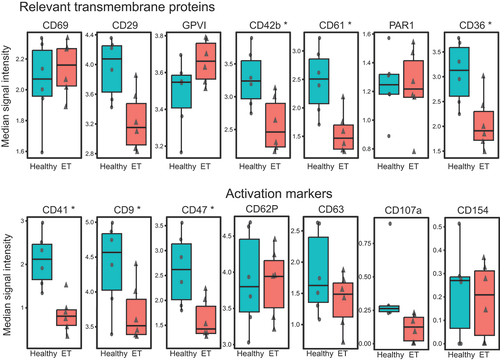
The platelet surface proteins analyzed in our study were selected on the basis of their biological relevance as modulators of platelet activation or aggregation.Citation23 Our established CyTOF antibody panel comprising 18 transmembrane proteins and receptors has previously been validated.Citation14,Citation15 In our study, mass cytometry detected a differential expression of several important surface proteins in quiescent non-stimulated platelets of ET patients compared to matched healthy controls (). In ET platelets, we detected an overexpression of the collagen receptor GPVI (3.44 vs. 3.62 median signal intensity -MSI- in healthy vs. ET patients, p = .043) (), the principal mediator of initiation and amplification of platelet activation.Citation24 Furthermore, we found a significantly higher expression of the platelet activation marker CD62P (p-Selectin) (0.73 vs. 0.79 MSI, p = .048) (). In contrast, the expression of the integrin subunits of the fibrinogen receptor GPIIb/IIIa CD41 (GPIIb 1.91 vs. 0.93 MSI, p = .035), CD61 (GPIIIa 2.33 vs. 1.59 MSI, p = .043), and of the von Willebrand factor (VWF) receptor CD42b (GPIbα 3.27 vs. 2.61 MSI, p = .043) were downregulated in ET. Uniform manifold approximation and projection (UMAP) for the activation markers in non-stimulated platelets (CD62P, CD154, CD107a, and CD63 are shown in and highlight a wide overexpression of CD62P in ET patients. Among all patients with ET, UMAP clustering of the individual platelets did not reveal any evident patterns, that might be driven by differences in genotypes and treatments, even when compared to the distinct clustering exhibited by healthy controls (Supplementary Figure S2). Multidimensional optSNE for the expressions of the activation markers and relevant transmembrane receptors of two matched samples (one healthy control and one ET) are shown in . The expression levels, medians, EMD, and p-values of non-stimulated platelets are indicated in .
Figure 1. Receptor expression in non-stimulated platelets. A. Median signal intensity of relevant constitutive transmembrane receptors and activation markers in non-stimulated platelets of healthy controls (n = 6, plotted in blue) and ET patients (n = 6, plotted in red). The horizontal line within the box plot represents the median, the top and bottom the interquartile range (Q1–Q3), whisker bars indicate the largest observation that is less than or equal to the upper inner fence (UIF = Q3 + 1.5 × IQR) or the smallest observation that is greater than or equal to the lower inner fence (LIF = Q1–1.5 × IQR) and each dot represents the median expression of one sample. * p < .05. B. Uniform manifold approximation and projection (UMAP) of ET patients (n = 6) and healthy controls (n = 6) after equal random sampling from each sample and scaled, arcsinh-transformed expression [0–1] for activation markers colored according to the expression level. C. Multidimensional analysis of platelet subpopulations. OptSNE (optimized t-distributed stochastic neighbor embedding) plots of one exemplary healthy donor and one ET patient are shown for the expression of the activation markers and transmembrane receptors in non-stimulated platelets. Color intensity refers to expression (low [blue] or high [red]) and each dot represents a single platelet. ET: essential thrombocythemia.
![Figure 1. Receptor expression in non-stimulated platelets. A. Median signal intensity of relevant constitutive transmembrane receptors and activation markers in non-stimulated platelets of healthy controls (n = 6, plotted in blue) and ET patients (n = 6, plotted in red). The horizontal line within the box plot represents the median, the top and bottom the interquartile range (Q1–Q3), whisker bars indicate the largest observation that is less than or equal to the upper inner fence (UIF = Q3 + 1.5 × IQR) or the smallest observation that is greater than or equal to the lower inner fence (LIF = Q1–1.5 × IQR) and each dot represents the median expression of one sample. * p < .05. B. Uniform manifold approximation and projection (UMAP) of ET patients (n = 6) and healthy controls (n = 6) after equal random sampling from each sample and scaled, arcsinh-transformed expression [0–1] for activation markers colored according to the expression level. C. Multidimensional analysis of platelet subpopulations. OptSNE (optimized t-distributed stochastic neighbor embedding) plots of one exemplary healthy donor and one ET patient are shown for the expression of the activation markers and transmembrane receptors in non-stimulated platelets. Color intensity refers to expression (low [blue] or high [red]) and each dot represents a single platelet. ET: essential thrombocythemia.](/cms/asset/80941f46-d6f7-4400-bd35-ca7f08073c1b/iplt_a_2358244_f0001_oc.jpg)
Table II. Comparison of receptor expression in healthy controls and ET patients. Mean, median signal intensity and EMD values are given at baseline and following TRAP stimulation. ET: essential thrombocythemia; EMD: earth mover’s distance; TRAP: thrombin receptor-activating peptide, adj: Benjamini-Hochberg false discovery rate adjusted p-value.
Correlation with clinical parameters
Compared to healthy controls, patients with ET had significantly elevated platelet counts and a reduced MPV (). When regarding marker expression and clinical features of ET patients, we found a significant correlation between MPV and platelet count in the ET cohort (p = .0087) (). In contrast no statistically significant relationship between platelet count and MPV was observed among the healthy individuals (). Of note, there was no correlation found in either group between GPVI expression levels and platelet count or MPV (Supplementary Figure S1).
Figure 2. Platelet count and correlation with mean platelet volume in ET patients and healthy controls. a. Bar plot illustrating the platelet count ± SEM in healthy donors (blue) and ET patients (red), (n = 6). Data were log-transformed to address the zero-limit issue, followed by an unpaired t-test (p = .0123). a. Bar plot illustrating the mean platelet volume ± SEM in healthy donors (blue) and ET patients (red), (n = 6). Unpaired t-test (p = .014). C. Correlation plots depicting the relationship between the logged platelet count (G/L) and Mean Platelet Volume (MPV, fL) for both healthy donors and ET patients. For healthy donors, a Pearson correlation coefficient (r) of − 0.6963 was observed (95% confidence interval: −0.9630 to 0.2706; p = .1268). In contrast, ET patients exhibited a stronger negative correlation, with an r of − 0.9654 (95% confidence interval: −0.9963 to − 0.7104; p = .0018), indicating a significant inverse relationship between platelet count and MPV in this patient group. ET: essential thrombocythemia.
Platelet heterogeneity analysis of non-stimulated platelets
Based on relative changes in the area under the cumulative distribution function curve, the FlowSOM algorithm identified eight clusters of platelets with similar expression profiles (). Two of these featured significant differential expression patterns in ET patients compared to controls. Cluster 3 was overrepresented in ET (22.13% of the total platelets in ET, 2.94% in controls, p = .035) and showed a significant higher expression of the collagen receptor GPVI (2.77 vs. 3.36 MSI, p = .034) and of the activation marker CD63 (0.09 vs. 0.33 MSI, p = .034) in ET (). Cluster 8 (1.20% in ET, 4.16% in controls, p = .077) showed a significant upregulation of the strongest platelet activation pathway, the thrombin receptor PAR1 (2.35 vs. 2.69 MSI, p = .018), the collagen receptor GPVI (4.47 vs. 4.99 MSI, p = .018), the mediator CD69 (2.77 vs. 3.19 MSI, p = .018) and the activation marker CD62P (2.48 vs. 3.15 MSI, p = .018, ). A comparative heatmap illustrating the expression of all markers by cluster in patients with ET and healthy individuals is shown in .
Figure 3. Subpopulation clustering analysis in non-stimulated platelets. a. UMAP representation of FlowSOM clustering result of healthy platelets (n = 6, left panel) and ET platelets (n = 6, right panel). Platelets were clustered into SOM (self-organizing map) of clusters, which were then merged into eight meta-clusters. Colors indicate clusters 1–8. b. Median signal intensity of transmembrane and activation markers in two subclusters differentially regulated in healthy controls and ET patients. Depicted markers show statistically significant differences in protein expression between healthy controls and ET patient samples within respective clusters. Cluster 3: CD63 (0.09 vs. 0.33 MSI, p = .034) and GPVI (2.77 vs. 3.36 MSI, p = .034). Cluster 8: CD62P (2.48 vs. 3.15 MSI, p = .018), GPVI (4.47 vs. 4.99 MSI, p = .018), CD69 (2.77 vs. 3.19 MSI, p = .018) and PAR1 (2.35 vs. 2.69 MSI, p = .018). The horizontal line within the box plot represents the median, the top and bottom the interquartile range (Q1–Q3), whisker bars indicate the largest observation that is less than or equal to the upper inner fence (UIF = Q3 + 1.5 × IQR) or the smallest observation that is greater than or equal to the lower inner fence (LIF = Q1–1.5 × IQR) and each dot represents the mean expression of one sample. * p < .05. c. Comparative heatmap of individual clusters. Heatmap depicts the marker median signal intensity of healthy donors and ET patients for each cluster in non-stimulated platelets (low [gray] and high [green] median signal intensity). ET: essential thrombocythemia.
![Figure 3. Subpopulation clustering analysis in non-stimulated platelets. a. UMAP representation of FlowSOM clustering result of healthy platelets (n = 6, left panel) and ET platelets (n = 6, right panel). Platelets were clustered into SOM (self-organizing map) of clusters, which were then merged into eight meta-clusters. Colors indicate clusters 1–8. b. Median signal intensity of transmembrane and activation markers in two subclusters differentially regulated in healthy controls and ET patients. Depicted markers show statistically significant differences in protein expression between healthy controls and ET patient samples within respective clusters. Cluster 3: CD63 (0.09 vs. 0.33 MSI, p = .034) and GPVI (2.77 vs. 3.36 MSI, p = .034). Cluster 8: CD62P (2.48 vs. 3.15 MSI, p = .018), GPVI (4.47 vs. 4.99 MSI, p = .018), CD69 (2.77 vs. 3.19 MSI, p = .018) and PAR1 (2.35 vs. 2.69 MSI, p = .018). The horizontal line within the box plot represents the median, the top and bottom the interquartile range (Q1–Q3), whisker bars indicate the largest observation that is less than or equal to the upper inner fence (UIF = Q3 + 1.5 × IQR) or the smallest observation that is greater than or equal to the lower inner fence (LIF = Q1–1.5 × IQR) and each dot represents the mean expression of one sample. * p < .05. c. Comparative heatmap of individual clusters. Heatmap depicts the marker median signal intensity of healthy donors and ET patients for each cluster in non-stimulated platelets (low [gray] and high [green] median signal intensity). ET: essential thrombocythemia.](/cms/asset/34125e29-c9c1-4d47-b516-44ad8161db72/iplt_a_2358244_f0003_oc.jpg)
Platelet surface receptor expression after TRAP stimulation
To investigate platelet reactivity, we stimulated the platelets with 10 µM TRAP. Again, we detected a downregulation of the integrin subunits of the fibrinogen receptor GPIIb/IIIa CD41 (2.11 vs. 0.80 MSI, p = .0359) and CD61 (2.51 vs. 1.46 MSI, p = .040) as well as CD42b (3.24 vs. 2.46 MSI, p = .040), CD36 (3.13 vs. 1.90 MSI, p = .043), and CD47 (2.61 vs. 1.42 MSI, p = .040) in ET (). After stimulation, platelet marker expression was increased compared to unstimulated platelets. However, we did not detect any significant differences in the expression levels of the activation markers CD62P, CD63, CD107a and CD154, between healthy controls and ET patients.
Figure 4. Receptor expression after TRAP-induced activation. Median signal intensity of relevant transmembrane receptors and activation markers in platelets after stimulation with 10 µM TRAP in healthy controls (n = 6, plotted in blue) and ET patients (n = 6, plotted in red). The horizontal line within the box plot represents the median, the top and bottom the interquartile range (Q1–Q3), whisker bars indicate the largest observation that is less than or equal to the upper inner fence (UIF = Q3 + 1.5 × IQR) or the smallest observation that is greater than or equal to the lower inner fence (LIF = Q1–1.5 × IQR) and each dot represents the mean expression of one sample. ns: nonsignificant. * p < .05. ET: essential thrombocythemia; TRAP: thrombin receptor-activating peptide.
Discussion
Here, we provide the first high-resolution phenotypical characterization of platelets of ET patients using mass cytometry. In an exploratory setting, we detected a differential expression of several key proteins involved in platelet activation and adhesion and an overexpression of prothrombotic transmembrane proteins, such as the collagen receptor GPVI and the activation marker CD62P. On the contrary, the integrin subunits of the fibrinogen receptor GPIIb/IIIa and the subunit of the von Willebrand factor receptor (CD42b) were downregulated in patients with ET.
ET is a clonal MPNCitation1 known to be associated with increased platelet activation.Citation11,Citation12 Our results are consistent with previous investigations of Arellano-Rodrigo et al.Citation7 showing that ET patients featured higher values of baseline CD62P, higher platelet-neutrophil aggregates, and platelet- monocyte complexes. In fact, CD62P is known to regulate platelet-leukocyte interaction and to induce leukocyte activation and neutrophil extracellular traps (NET) formation.Citation25
ET platelets are smaller compared to healthy platelets.Citation26,Citation27 Also in this study, the MPV of ET patients was significantly lower than of control subjectsWe also observed a significant inverse correlation between platelet count and MPV. This conforms the results of previous studies showing that ET platelets stay small during their lifespans.Citation27 However, we did not find a direct correlation of GPVI with MPV or platelet count, suggesting that the increased GPVI expression is an intrinsic feature of ET platelets and does not depend on the morphological phenotype or the elevated number of platelets in ET. The reduced signals detected in ET for CD41, CD61, and CD42b may be consistent with the smaller MPV, as these constitutive markers have been shown to correlate with the platelet volume.Citation28 In this context, the detected upregulation of the important GPVI receptor and of the adhesion protein CD62P is particularly relevant as it overcomes the smaller platelet size in ET.
GPVI, exclusively expressed in platelets, is the principal mediator of initiation and amplification of platelet activation caused by exposed collagen from the subendothelial matrix.Citation24 In contrast to current antiplatelet therapies (e.g., P2Y12 and thromboxane inhibition), targeting platelet adhesion receptors may allow lesion-specific platelet inhibition at the site of damaged endothelium or vulnerable plaques without enhancing the bleeding risk. This made GPVI an extremely appealing drug target and it became the focus of novel antithrombotic strategies.Citation29,Citation30 Since prevention of thrombotic events is the major objective in the treatment of ET patients, it is essential to identify the pathophysiological features of their prothrombotic profile. Our results highlight the GPVI pathway as a potential therapeutic target in ET to prevent thrombotic events shedding light on a new therapeutic niche which requires further investigations.
Interestingly, the GPVI upregulation seems to be driven by two platelet subgroups characterized by significantly higher levels of the activation markers CD63 (Cluster 3) and CD62P (Cluster 8, ). Cluster 8 is also characterized by higher expression of the thrombin receptor PAR1, the strongest platelet activation pathway, which could even increase the prothrombotic potential of this subgroup of platelets. Of note, we observed a significant overrepresentation of Cluster 3 in ET (22.13% vs. 2.94%) suggesting that the detected upregulations in ET are driven by this platelet subgroup. It has been known that patients with ET have significantly higher levels of immature reticulated platelets than healthy controlsCitation31,Citation32 and that these reticulated platelets even persist after platelet counts have normalized by cytoreductive treatment.Citation32 A recent study found that GPVI expression was elevated in highly reactive juvenile plateletsCitation33 suggesting that the observed increase in GPVI expression might be influenced by elevated levels of immature platelets in ET. Whether clonal hematopoiesis is responsible for an overproduction of immature platelets and a specific subgroup of prothrombotic platelets in ET remains to be validated by further studies.
Our study has several limitations. This is a descriptive analysis that does not provide mechanistic explanations beyond the differential expression of transmembrane proteins in ET platelets. Moreover, the small sample size does not allow to perform subanalyses based on single ET driver mutations. Another limitation of our analysis is that it is restricted to the selected 18 transmembrane proteins and activation markers. Other elements may be involved in the prothrombotic phenotype of ET. Further deeper proteomic analyses are needed to address this issue. Furthermore, our activation assay was limited to TRAP stimulation. Other physiological activators such as ADP and collagen were not used in this study and could be tested in the future.
Nevertheless, we provide the first high-resolution characterization of ET platelet expression using mass cytometry highlighting the existence of subgroups of platelets with specific expression patterns. This dataset sets the basis for further research on dysregulated activation pathways in ET which could lead to a personalization of antithrombotic therapies tailored on the ET platelet phenotype.
Authorship contributions
V.D., K.K., M.K., D.B. and I.B. designed the research and wrote the paper. M.K., K.K. and J.H. performed the experiments and made the figures. K.K., M.K. and M.L. did the bioinformatic analyses. V.D. and G.V. recruited the donors. M.K., J.H. and M.R. acquired the data at the CyTOF. J.R. provided the Helios platform for measurement. V.D., M.S., J.R., F.B., K.S.G., P.J.J., S.J., P.H., P.R., K.L., M.L., C.J.B., I.B. and D.B. interpreted the results and reviewed the paper.
Supplemental Material
Download PDF (595.5 KB)Acknowledgments
We thank Ritu Mishra and the Core Facility Cell Analysis at TranslaTUM (CFCA) with Klinikum rechts der Isar of Technical University Munich for their support. We also like to thank Judith Bernett, Quirin Manz and Lis Arend for their support with the bioinfomatic analysis.
Disclosure statement
The work of J.H. was supported by the China Scholarship Council (CSC).
Supplementary Material
Supplemental data for this article can be accessed online at https://doi.org/10.1080/09537104.2024.2358244
Correction Statement
This article has been republished with minor changes. These changes do not impact the academic content of the article.
Additional information
Funding
References
- Spivak JL. Myeloproliferative neoplasms. New Engl J Medicine. 2017;376(22):2168–9. doi:10.1056/nejmra1406186.
- Barbui T. Refining prognostication of thrombosis in ET. Am J Hematol. 2016;91(4):361–3. doi:10.1002/ajh.24320.
- Barbui T, Barosi G, Birgegard G, Cervantes F, Finazzi G, Griesshammer M, Harrison C, Hasselbalch HC, Hehlmann R, Hoffman R. et al. Philadelphia-negative classical myeloproliferative neoplasms: Critical concepts and management recommendations from European LeukemiaNet. J Clin Oncol. 2011;29(6):761–70. doi:10.1200/jco.2010.31.8436.
- Tefferi A, Pardanani A, Solomon CG. Essential thrombocythemia. N Engl J Med. 2019;381(22):2135–44. doi:10.1056/nejmcp1816082.
- Barbui T, Finazzi G, Carobbio A, Thiele J, Passamonti F, Rumi E, Ruggeri M, Rodeghiero F, Randi ML, Bertozzi I. et al. Development and validation of an international prognostic score of thrombosis in World Health Organization–essential thrombocythemia (IPSET-thrombosis). Blood. 2012;120(26):5128–33. doi:10.1182/blood-2012-07-444067.
- Braunstein EM, Chaturvedi S. Aspirin in ET: will twice a day keep thrombosis away? Blood. 2020;136(2):151–3. doi:10.1182/blood.2020005970.
- Arellano-Rodrigo E, Alvarez-Larrán A, Reverter JC, Villamor N, Colomer D, Cervantes F. Increased platelet and leukocyte activation as contributing mechanisms for thrombosis in essential thrombocythemia and correlation with the JAK2 mutational status. Haematologica. 2006;91(2):169–75.
- Barbui T, Falanga A. Molecular biomarkers of thrombosis in myeloproliferative neoplasms. Thromb Res. 2016;140:71–5. doi:10.1016/s0049-3848(16)30102-5.
- Falanga A, Marchetti M. Thrombosis in myeloproliferative neoplasms. Semin Thromb Hemostasis. 2014;40(3):348–58. doi:10.1055/s-0034-1370794.
- Oyarzún CPM, Glembotsky AC, Goette NP, Lev PR, Luca GD, Pietto MCB, Moiraghi B, Castro Ríos MA, Vicente A, Marta RF. et al. Platelet toll-like receptors mediate thromboinflammatory responses in patients with essential thrombocythemia. Front Immunol. 2020;11:705. doi:10.3389/fimmu.2020.00705.
- Karakantza M, Giannakoulas NC, Zikos P, Sakellaropoulos G, Kouraklis A, Aktypi A, Metallinos IC, Theodori E, Zoumbos NC, Maniatis A. et al. Markers of endothelial and in vivo platelet activation in patients with essential thrombocythemia and polycythemia vera. Int J Hematol. 2004;79(3):253–9. doi:10.1532/ijh97.e0316.
- Falanga A, Marchetti M, Vignoli A, Balducci D, Barbui T. Leukocyte-platelet interaction in patients with essential thrombocythemia and polycythemia vera. Exp Hematol. 2005;33(5):523–30. doi:10.1016/j.exphem.2005.01.015.
- Hauschner H, Horev MB, Misgav M, Nagar M, Seligsohn U, Rosenberg N, Koren‐Michowitz M. Platelets from Calreticulin mutated essential thrombocythemia patients are less reactive than JAK2 V617F mutated platelets. Am J Hematol. 2020;95(4):379–86. doi:10.1002/ajh.25713.
- Bongiovanni D, Klug M, Lazareva O, Weidlich S, Biasi M, Ursu S, Warth S, Buske C, Lukas M, Spinner CD. et al. SARS-CoV-2 infection is associated with a pro-thrombotic platelet phenotype. Cell Death Disease. 2021;12(1):50. doi:10.1038/s41419-020-03333-9.
- Klug M, Kirmes K, Han J, Lazareva O, Rosenbaum M, Viggiani G, von Scheidt M, Ruland J, Baumbach J, Condorelli G, Laugwitz K-L. et al. Mass cytometry of platelet-rich plasma: a new approach to analyze platelet surface expression and reactivity. Platelets. 2022;33(6):1–8. Published online 2021. doi:10.1080/09537104.2021.2009453.
- Arber DA, Orazi A, Hasserjian R, Thiele J, Borowitz MJ, Beau MML, Bloomfield CD, Cazzola M, Vardiman JW. The 2016 revision to the World Health Organization classification of myeloid neoplasms and acute leukemia. Blood. 2016;127(20):2391–405. doi:10.1182/blood-2016-03-643544.
- Klug M, Lazareva O, Kirmes K, Rosenbaum M, Lukas M, Weidlich S, Spinner CD, von Scheidt M, Gosetti R, Baumbach J. et al. Platelet surface protein expression and reactivity upon TRAP stimulation after BNT162b2 vaccination. Thromb Haemostasis. 2022;122(10):1706–11. Published online 2021. doi:10.1055/s-0041-1733934.
- Sumatoh HR, Teng KWW, Cheng Y, Newell EW. Optimization of mass cytometry sample cryopreservation after staining. Cytom Part A. 2017;91(1):48–61. doi:10.1002/cyto.a.23014.
- Kotecha N, Krutzik PO, Irish JM. Web‐based analysis and publication of flow cytometry experiments. Curr Protoc Cytom. 2010;53(1):10.17.1–10.17.24. doi:10.1002/0471142956.cy1017s53.
- Arend L, Bernett J, Manz Q, Klug M, Lazareva O, Baumbach J. et al. A systematic comparison of novel and existing differential analysis methods for CyTOF data. Brief Bioinform. 2022;23(1):bbab471. Published online 2021. doi:10.1093/bib/bbab471.
- Belkina AC, Ciccolella CO, Anno R, Halpert R, Spidlen J, Snyder-Cappione JE. Automated optimized parameters for T-distributed stochastic neighbor embedding improve visualization and analysis of large datasets. Nat Commun. 2019;10(1):5415. doi:10.1038/s41467-019-13055-y.
- Gassen SV, Callebaut B, Helden MJV, Lambrecht BN, Demeester P, Dhaene T, Saeys Y. FlowSOM: Using self‐organizing maps for visualization and interpretation of cytometry data. Cytom Part A. 2015;87(7):636–45. doi:10.1002/cyto.a.22625.
- Zeiler M, Moser M, Mann M. Copy number analysis of the murine platelet proteome spanning the complete abundance range. Molecular & Cellular Proteomics: MCP. 2014;13(12):3435–45. doi:10.1074/mcp.m114.038513.
- Nieswandt B, Watson SP. Platelet-collagen interaction: is GPVI the central receptor? Blood. 2003;102(2):449–61. doi:10.1182/blood-2002-12-3882.
- Kim SJ, Jenne CN. Role of platelets in neutrophil extracellular trap (NET) production and tissue injury. Semin Immunol. 2016;28(6):546–54. doi:10.1016/j.smim.2016.10.013.
- Sehayek E, Ben-Yosef N, Modan M, Chetrit A, Meytes D. Platelet parameters and aggregation in essential and reactive thrombocytosis. Am J Clin Pathol. 1988;90(4):431–6. doi:10.1093/ajcp/90.4.431.
- Lee E, Kim M, Jeon K, Lee J, Lee JS, Kim HS, Kang, HJ, Lee, YK. Mean platelet volume and platelet distribution width indicate that platelets remain small for most of their lifespans in patients with essential thrombocythemia. Clin Lab. 2019;65(4/2019). doi:10.7754/clin.lab.2018.180938.
- Lador A, Leshem-Lev D, Spectre G, Abelow A, Kornowski R, Lev EI. Characterization of surface antigens of reticulated immature platelets. J Thromb Thrombolys. 2017;44(3):291–7. doi:10.1007/s11239-017-1533-x.
- Borst O, Gawaz M. Glycoprotein VI -Novel target in antiplatelet medication. Pharmacol Therapeut. 2020;217:107630. doi:10.1016/j.pharmthera.2020.107630.
- Schüpke S, Hein-Rothweiler R, Mayer K, Janisch M, Sibbing D, Ndrepepa G, Hilz R, Laugwitz K-L, Bernlochner I, Gschwendtner S. et al. Revacept, a novel inhibitor of platelet adhesion, in patients undergoing elective PCI—design and rationale of the randomized ISAR-PLASTER trial. Thromb Haemostasis. 2019;119(9):1539–45. doi:10.1055/s-0039-1692423.
- Pedersen OH, Larsen ML, Grove EL, van Kooten Niekerk PB, Bønløkke S, Nissen PH, Kristensen SD, Hvas A-M. Platelet characteristics in patients with essential thrombocytosis. Cytom Part B: Clin Cytom. 2018;94(6):918–27. doi:10.1002/cyto.b.21642.
- Ryningen A, Apelseth T, Hausken T, Bruserud Ø. Reticulated platelets are increased in chronic myeloproliferative disorders, pure erythrocytosis, reactive thrombocytosis and prior to hematopoietic reconstitution after intensive chemotherapy. Platelets. 2006;17(5):296–302. doi:10.1080/09537100600746508.
- Veninga A, Handtke S, Aurich K, Tullemans B, Brouns S, Schwarz SL, Heubel-Moenen FCJI, Greinacher A, Heemskerk JWM, van der Meijden PEJ. et al. GPVI expression is linked to platelet size, age, and reactivity. Blood Adv. 2022;6(14):4162–73. doi:10.1182/bloodadvances.2021006904.