
Abstract
The purpose of this study is to investigate the molecular interactions and potential therapeutic uses of Eltrombopag (EPAG), a small molecule that activates the cMPL receptor. EPAG has been found to be effective in increasing platelet levels and alleviating thrombocytopenia. We utilized computational techniques to predict and confirm the complex formed by the ligand (EPAG) and the Thrombopoietin receptor (TPO-R) cMPL, elucidating the role of RAS, JAK-2, STAT-3, and other essential elements for downstream signaling. Molecular dynamics (MD) simulations were employed to evaluate the stability of the ligand across specific proteins, showing favorable characteristics. For the first time, we examined the presence of TPO-R in human umbilical cord mesenchymal stem cells (hUCMSC) and human gingival mesenchymal stem cells (hGMSC) proliferation. Furthermore, treatment with EPAG demonstrated angiogenesis and vasculature formation of endothelial lineage derived from both MSCs. It also indicated the activation of critical factors such as RUNX-1, GFI-1b, VEGF-A, MYB, GOF-1, and FLI-1. Additional experiments confirmed that EPAG could be an ideal molecule for protecting against UVB radiation damage, as gene expression (JAK-2, ERK-2, MCL-1, NFkB, and STAT-3) and protein CD90/cMPL analysis showed TPO-R activation in both hUCMSC and hGMSC. Overall, EPAG exhibits significant potential in treating radiation damage and mitigating the side effects of radiotherapy, warranting further clinical exploration.
Plain Language Summary
What is the context?
● Chemotherapy, radiation treatment, or immunological disorders can cause a decrease in platelet count (thrombocytopenia) or decrease all blood cell types (pancytopenia) in the bone marrow. This can make it challenging to choose the appropriate cancer treatment plan.
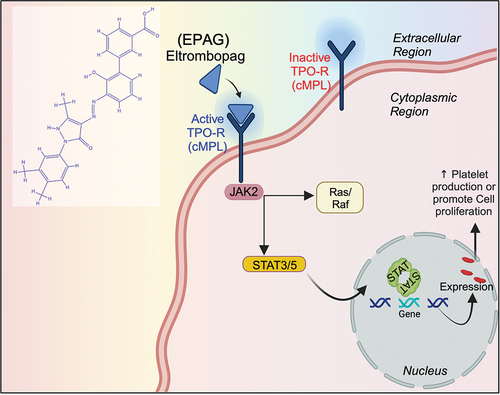
● Eltrombopag (EPAG) is an oral non-peptide thrombopoietin (TPO) mimetic that activates the cMPL receptor in the body. This activation leads to cell differentiation and proliferation, stimulating platelet production and reducing thrombocytopenia. The cMPL receptor is present in liver cells, megakaryocytes, and hematopoietic cells. However, its effects on stem cell proliferation and differentiation are not entirely understood.
What is the new?
● This study delves into the molecular interactions and therapeutic applications of EPAG, a small molecule that activates cMPL (TPO-R).
● The study offers a comprehensive analysis of the ligand-receptor complex formation, including an examination of downstream signaling elements. Furthermore, molecular dynamics simulations demonstrate the stability of the ligand when interacting with targeted proteins.
● The research investigates the presence of TPO-R on stem cell-derived endothelial cells, shedding insight into the ability of EPAG TPO-mimetic to promote angiogenesis and vasculature formation.
● The study revealed that EPAG has the potential to protect against UVB-induced radiation damage and stimulate stem cell growth.
What is the implications?
The study emphasizes the potential of EPAG as a promising option for addressing radiation injury and minimizing the adverse effects of radiotherapy. It could revolutionize treatments not only for thrombocytopenia but also for enhancing the growth of stem cells. Furthermore, the research deepens our understanding of EPAG’s molecular mechanisms, providing valuable insights for developing future drugs and therapeutic approaches for cell therapy to treat radiation damage.
Introduction
Bone marrow is crucial for producing blood cells, including platelets in our bodies. The process requires the involvement of specialized cells called megakaryocytes (MKs), which are formed by the interaction between hematopoietic stem cells (HSCs) and specific precursor cells.Citation1 Several transcription factors, such as GATA1/2, FOG-1, RUNX-1, FLI-1, SCL, GFI-1b, NFE-2, and MYB, tightly regulate the production of platelets. Thrombopoietin (TPO) is essential for regulating the development of megakaryocytes. TPO initiates a cascade of intracellular signaling pathways by binding to the cell surface receptor known as Myeloproliferative leukemia protein (MPL), mainly targeting the type I homodimeric receptors D261 and L265. This encompasses the initiation of crucial molecules for cellular growth and function, including JAK-2, STAT-3, ERK-2, and PI3K.Citation2,Citation3 Disruptions along this pathway can result in hematological disorders like thrombocytopenia or pancytopenia, which can be triggered by factors such as chemotherapy or immunological diseases.Citation4
Scientists have developed synthetic versions of thrombopoietin called TPO mimetics, such as RomiplostimCitation5 and EPAG, which stimulate platelet production by interacting with the MPL receptor. Regulatory agencies like the Food and Drug Administration, USA (US-FDA), and the European Medical Agency (EMA) have approved EPAG for the treatment of illnesses such as immune thrombocytopenic purpura and hepatitis C.Citation6 Additionally, TPO plays a pivotal role in restoring HSCs following bone marrow transplantation, underscoring its significance in sustaining the production of blood cells.Citation7,Citation8 Previous research has explored different methods to induce HSCs growth and increase platelet generation by targeting the MPL receptor. Studies have shown that the expression of TPO remains stable despite fluctuations in platelet counts, indicating a strong relationship between them. Additionally, the levels of TPO in the bloodstream are more closely related to the overall mass of platelets and megakaryocytes rather than the specific count of platelets. Platelets can also regulate the immunological response of various cell types.Citation9–11 Previous studies have suggested different methods to enhance the expansion of HSCs and increase platelet production by targeting the cMPL receptor.Citation12 Another study has indicated that Romiplostim has iron-chelating properties that promote the self-renewal of HSCs, potentially increasing their growth.Citation13
However, more research is needed to explore other types of mesenchymal stem cells (MSC), such as the human umbilical cord (hUCMSC) and human gingival (hGMSC). Advanced computer techniques like molecular docking and biomolecular simulation analysis can be used to understand the complex relationship between the cMPL receptor and EPAG. Computer programming allows accurate predictions of macromolecular interactions at the atomic level.Citation14,Citation15 Biological simulations employ various techniques to develop intricate computer models, aiding our comprehension of the functioning of the cMPL receptor. It is crucial to have a clear understanding of the interaction between cMPL and EPAG.Citation16 The aim of this study is to thoroughly investigate the molecular dynamics of the signaling cascade involving the cMPL receptor and its associated pathways through computer simulation. Additionally, we will examine the effectiveness of EPAG in regulating genes in hUCMSC and hGMSC culture using in-silico methods. Furthermore, we intend to evaluate the functional characteristics of EPAG, including its ability to promote angiogenesis, mitigate damage, and provide protection against UVB radiation injury. This study has the potential to yield valuable insights into the use of EPAG as a mitogen stimulant and a potential treatment for radiation-induced ischemia.
Materials and methods
Ligand preparation
Three-dimensional chemical structures of EPAG (ligand) molecules were obtained from PubChem (https://pubchem.ncbi.nlm.nih.gov/). ChemDraw performed 3D and geometry optimization with ligand energy minimization of small molecular chemical properties. The United Atom version of the AMBER force field was used to score Auto Dock, which reduces the number of atoms to be simulated by removing nonpolar hydrogen atoms, increasing the Van Der Waals’ radius of the heavy atom to which they are connected, and changing its partial charge to maintain the original total charge. All interacting atoms must be assigned the electrostatic contact energy estimated by AutoDock. This is done by converting SDF to Auto Dock 4 and Auto Grid 4-exclusive PDBQT format. Atom types (T) and partial charges (Q) are stored in PDBQT files.
Preparation of protein models
Protein structure of cMPL, JAK-2, RAS, and STAT-3 was selected (https://www.rcsb.org/). Co-crystallized structure (PDB IDs: 1V7M, 6VN8, 2FN4, and 6VN8), having resolution were selected from (RCSB) Protein Data Bank < 2 Å, R-Value Free < 0.30, R-Value Work < 0.25) with high resolution. The predicted protein structure was generated using the MGL tool to visualize the molecular interface.
Active site prediction
Dogsite Scorer, an automated pocket discovery technique, was used to predict the active site. It also assessed the drugability of the particular site by its physiochemical and geometric characteristics (https://proteins.plus/).Citation15 Overall, it was generated using PyMOL. The BIOVIA Discovery Studio was used to analyze molecule properties and chemical structures, perform virtual screenings, and predict the targeted area of molecules, generating 2D and 3D structures.
Molecular docking
Structure-based drug design approach finds significant interactions between the protein and low-energy ligands. Auto Dock was applied to analyze TPO receptor (EPAG) binding affinity and ligand efficacy. Using the docking score, a final energy evaluation was performed. The docking was done by Auto Dock Vina. The grid box was created using the Autodock tool, and site-specific docking was performed within the grid box. Hydrogen atoms and Kollman charges (4.03) were included in the protein, while Hydrogen atoms and Gasteiger charges were added to the ligand. The Gird box was generated using Auto Grid 4, the box dimensions (CMPL) X = 66.8184, Y = 90.6886, Z = 64.2913, (JAK-2) X = 56.2462, Y = 52.7932, Z = 49.1034, (RAS) X = 56.4526, Y = 48.7477, Z = 45.0532, (STAT-3) X = 61.8629, Y = 32.3111, Z = 86.6790. In Auto Dock Vina, nine poses were generated using the receptor and ligand files and a configuration file with grid box properties. An interaction of the docking pose with active site residues was observed, and the pose with a higher binding affinity is shown in .
Table I. The molecular docking of EPAG showing binding affinity.
Molecular dynamics simulations
Molecular dynamic (MD) simulations are valuable for analyzing the connections between macromolecular structure and function. A system containing 10 705 molecules, which amounts to 36 865 atoms, was simulated. We analyzed the stability of a modeled structure and the interaction between the ligand (EPAG) and proteins (cMPL, JAK-2, RAS, and STAT-3). All MD simulations were conducted using the GROMACS-2023.2 software package.Citation17 The CHARMM27 all-atom force field (CHARM22 with CMAP for proteins) was employed for the protein, and the ligand parameters were sourced from SwissParam, ensuring compatibility.
System preparation
The initial protein structure was curated to remove nonstandard residues or heteroatoms. The ligand, extracted from its docked state, was converted to mol2 format, and bond angles were fixed and subsequently uploaded to the SwissParam web server for topology generation. The protein-ligand complex was then solvated in a simulation box using the TIP3P water model. Sodium and chloride ions were added as necessary to neutralize the system.
Equilibration and production run
Before the production run, the ligand was restrained to maintain its orientation and position relative to the protein. The system was equilibrated in two phases: an NVT ensemble and an NPT ensemble. Post-equilibration, 100 nanoseconds were simulated using a time step of 2 fs. Neighbor searching was conducted at regular intervals of 20 steps of production. MD simulation was executed to probe the dynamic behavior of the protein-ligand complex.
Analysis
The PME algorithm was utilized to handle electrostatic interactions, employing a cutoff of 1.2 nm. A grid with cells was used for all the proteins shown in , employing 4th-order B-spline interpolation. A cutoff of 1.219 nm was employed for Van der Waals interactions. The temperature coupling was performed using the V-rescale algorithm. The Parrinello-Rahman algorithm was used to perform pressure coupling.
Table II. A gird for ligands.
Cells and cell culture
The MEG-01 cell line was obtained from ATCC (CRL-01) and cultured in RPMI 1640 medium (Gibco, Grand Island, NY, USA) supplemented with 10% fetal bovine serum (MP biomedicals, CA, USA) at 37°C in a humidified atmosphere of 5% CO2 in an incubator. The Human Gingival Mesenchymal Stem cells were obtained from Kosheeka in Noida, India. The Human umbilical cord MSCs were purchased from ATCC (Cat # PCS-500-010). Both cell types were cultured in Alpha-MEM medium from Lonza in Basel, Switzerland, supplemented with 10% fetal bovine serum (FBS) and L-glutamine from MP biomedicals in CA, USA. The cells were maintained in a controlled environment.
Cell viability assay
The MTT colorimetric dye reduction test (Sigma, St. Louis, MO, USA) was used to measure cell viability. MEG-01 (Positive control), hUCMSC, and hGMSC were plated at 20 × 103 cells per well on a 24-well plate for 24 hours. Treatment with EPAG (100 µM, 50 µM, 20 µM, 15 µM, 10 µM, 5 µM, 1 µM) for 24 hours was followed by 3 hours of MTT reagent (400 μL, 0.5 mg/mL)Citation18,Citation19and recorded absorbance at OD 570 nm in Microplate reader Model 680 (Bio-Rad, Hercules, CA, USA). Calcein AM live staining was performed for 24 h incubation with EPAG with pre-determined IC-50 concentrations, and images were captured using a Zeiss LSM 510 confocal microscope.
3[H] thymidine incorporation Assay
The3 [H] thymidine incorporation assay was carried out as described.Citation20,Citation21 The 25 × 103 cells were cultivated in DMEM at 37°C in 5% CO2 for 24 hours. After incubating with EPAG, add 3[H] thymidine (1 μci/mL) to every well, including the control. Following 24 hours, the cells underwent a PBS rinse and were then fixed using 10% ice-cold trichloroacetic acid to precipitate DNA. Radioactivity in the solution was measured using Perkin Elmer liquid scintillation spectrometer.
Differentiation of mesenchymal stem cells to endothelial-like cells (ECs) and phenotypic characterization
The cells were cultured using DMEM (Invitrogen, Paisley, UK) supplemented with 2 mM L-glutamine and 10% fetal bovine serum. When the cell culture reached 50% confluency, we added 50 ng/mL of synthesized recombinant VEGF-A (Abcam, MA, USA). The culture was then changed every 48 hours to allow for the differentiation of MSCs over ten days. In triplicate, 5 × 10⁴ cells/well were treated with EPAG and recombinant human VEGF-A separately (Positive control). Following a ten-day differentiation period, cells were extracted from growing plates using PBS containing four mM EDTA (Sigma-Aldrich, Munich, Germany). Following PBS washing, flow cytometry was conducted to stain for VEGF-A and CD31 using the method described in a previous study.Citation22
Tube formation with matrigel assay
Initially, the 96-well microplates were coated with Matrigel and left to polymerize for 30 minutes at 37°C. hUCMS-ECs and hGMSC-ECs were added at 2 × 10⁴ cells/well into each well covered with Matrigel. The cells were added to the IC-50 concentration of EPAG and EGM-2 for control cells.Citation19 Tube formation was observed at 24 and 48-hour intervals. Cells were fixed, CD31 staining was performed, and images were procured using an inverted fluorescent microscope (Olympus, Tokyo, Japan) at a low magnification of 20 × . Furthermore, RNA was extracted from non-fixed cells and used for qPCR analysis later.
Immunocytochemistry
Immunofluorescence was used to investigate the expression of primary Anti-cMPL (Antibodies online.com # AA 401–500), Anti-F-actin (abcam #ab205), Anti-VEGF-A (Sino biological # 101465-MM12), and Anti-CD90 (BD Pharmingen # clone 5E10). After fixation and washing, culture coverslips were blocked with 3% normal horse serum for one hour at room temperature, incubated with the unconjugated primary antibodies (1:100 dilution) at 4°C overnight, and incubated with the goat anti-rabbit IgG(H+L), Alexa Flour 647 (1:500) and goat anti-mouse IgG, Alexa Flour 488 (1:500 dilution) conjugated secondary antibodies for one hour at room temperature in dark conditions.Citation23 After multiple washes with PBS, the cultures were counterstained with Hoechst 33 342, DAPI, or propidium iodide for 5 minutes. The specimens were then carefully mounted with an antifading medium, and high-quality images were captured using a Zeiss LSM 510 confocal microscope.
Ultra violet – B (UV-B) induced model
The hUCMSC and hGMSC were cultured under 5% CO2 and 37°C controlled conditions. Once the cells reached 70% confluence after being passaged 3 or 4 times, they were carefully washed with PBS. Subsequently, they were treated with EPAG and exposed to UV-B radiation in cold PBS to preserve the medium components and prevent heat stress and oxidation.Citation24 The cells were irradiated on the ice at a distance of 15 cm from the six-lamp assembly. Each lamp had a power of 6 W, resulting in a UVB intensity of 4.08 mW/cm2 (312 nm). The UVB radiation doses for both cells were 60 mJ/cm2 and 200 mJ/cm2. Following radiation, the Calcein AM (live cell, green) measures the viable cell count at 480 nm absorbance every hour until it reaches the lowest signal, and the sample was collected in RNA later for mRNA analysis.
qPCR analysis
According to the manufacturer’s instructions, total RNA was isolated from the previously stored cell cultured sample using TRIzol Reagent (Gibco BRL). For reverse transcription (RT), 1 µg of total RNA was used in a final volume of 10 µL containing 250 pmol of random hexamers, 1 µL buffer, 25 mM of dithiothreitol,10 mM of each dNTP, 100 U of Super-script II reverse transcriptase enzyme and then transcribed into cDNA using the Verso cDNA Synthesis Kit (Roche, Mannheim, Germany). qPCR was performed using Power SYBR Green PCR Master Mix (Applied Biosystem, UK) on a Quanta Studio 6. Expression of RUNX-1, MYB, FLI-1, GFI-1, FOG-1, and VEGF-A were studied in the tube formation assay RNA sample, and cMPL, NFκB, JAK-2, STAT-3, RAS, MCL-1 was studied in the UVB treated RNA sample. All mRNA expressions were normalized by TBP, and all reactions were performed as biological triplicates.Citation25 All the primer details are provided in .
Table III. Primer sequences.
Statistics
Values are expressed as the mean and standard deviation of three independent experiments. Statistical analysis was performed using two-way ANOVA Bonferroni’s post hoc test using graph pad prism 10.2.2. (LA Jolla, CA). The results were statistically significant when *p < .05, **p < .01, ***p < .001 and ****p < .0001.
Results
Protein structure design predictions and analysis
The myeloproliferative leukemia virus oncogene (MPL) receptor, influenced by JAK-2 and STAT-3 signaling and RAS signaling pathways, plays a crucial role in cell development and differentiation. Thrombopoietin serves as the primary regulator of platelet production. Thus, we opted to create the protein structure, which is crucial in structural-based design. Therefore, after obtaining the cMPL, JAK-2, RAS, and STAT-3 crystal structures from the Protein Data Bank (PDB) (). The quality was evaluated through Ramachandran Plot analysis, which indicated that most residues (over 90.0%) are in the favorable region. At the same time, a small percentage (7–8%) are found in the additional allowed area. The remaining 1–2% residue can be observed in the permitted and non-permitted sections, as depicted in (Suppl – Figure S1A–D). The results strongly support the quality and reliability of the protein molecule, indicating its potential as a promising candidate for further study.
Schema 1. A schematic representation illustrates the EPAG and its molecular mechanism in cellular proliferation.
Analysis of intermolecular interactions and molecular dynamic simulations
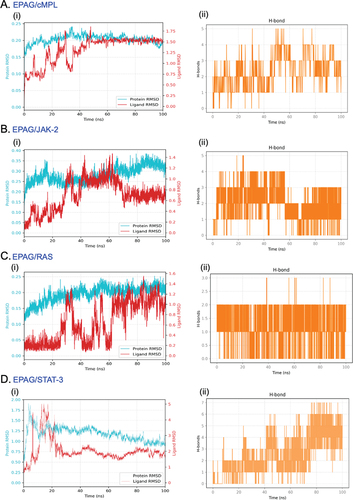
This study displays the successful docking of EAPG (ligand) with its predicted receptor cMPL ( i, ii and iii) and its downstream signaling proteins JAK-2 ( i, ii and iii), RAS ( i, ii and iii), and STAT-3 ( i, ii and iii). The 3D structure demonstrates the existence of a robust hydrogen bond between the ligand and its receptor molecules. This study investigated the 2D ligand interaction between EPAG and specific amino acid chains in targeted protein molecules. Our research has uncovered a significant discovery regarding the interaction between EPAG and the particular protein site. This interaction is marked by a robust conventional hydrogen bond involving Pro B:694, ARG B:738, and HIS B:692 bound to cMPL (). GLY A:996, GLU A:898, and LEU A:855 are bound to JAK-2 (). ASN A:142 and THR A:84 is bound to RAS (). THR A:277 protein is bound to STAT-3 (), and the macromolecules are shown in (Suppl– Figure S2A–D), demonstrating their structural arrangement. After conducting molecular docking, the most optimal docked pose was utilized to perform molecular dynamics simulations (MSD) using GROMACS to gain further understanding. MSD is an excellent tool for studying the interaction between ligands and proteins over time. An analysis was conducted to measure the stability of the complexes by examining the root-mean-square (RMSD) of protein backbone atoms and ligand atomic coordinates. The RMSD values for cMPL, JAK-2, RAS, STAT-3, and H-bonding are 0.25, 0.35, 0.25, and 2.00, respectively (). The RMSDs of the proteins are shown in cyan, while the RMSDs of the ligands are shown in red. The RMSD of cMPL, JAK-2, STAT-3, and RAS backbone remained consistently stable (Suppl– Figure S3A–D). The RMSD remains consistent throughout most of the total run time, indicating a reliable and steady interaction between the protein and ligand. In addition, the analysis of the root means square fluctuation of the protein’s backbone revealed consistent stability during the 100 ns MD simulation. The MD simulation results indicate a strong interaction between EPAG and cMPL, JAK-2, STAT-3, and RAS. The protein remains stable throughout the simulation (Suppl– Figure S4A–D).
Figure 1. The docked poses reveal the binding mode of various proteins, including cMPL, JAK-2, RAS, and STAT-3, into the binding capacity of EPAG. The ribbon structure illustrates the 3D protein structure of these molecules (A, B, C, D – i and ii), while the H-Bonds (A, B, C, D – iii) demonstrate the strong binding affinity of the ligand (EPAG).
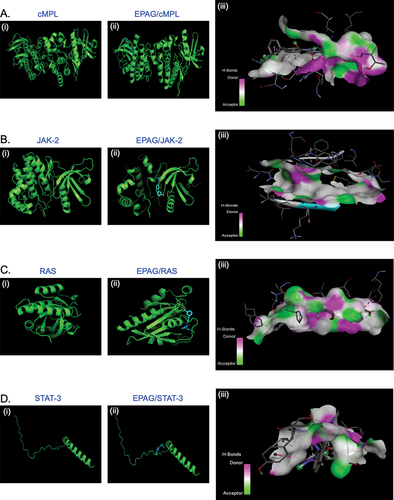
Figure 2. The conformation of EPAG is docked with cMPL (A), JAK-2 (B), RAS (C), and STAT-3 (D) ligands, revealing the interaction with important residues in the active site cleft.
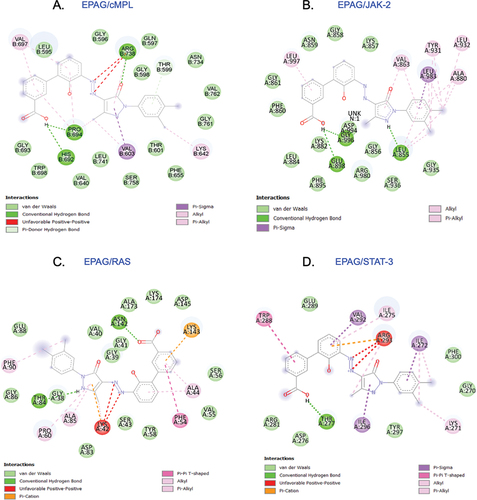
Figure 3. EPAG was subjected to molecular dynamic simulation. The results show the Protein backbone RMSD for each ligand-protein complex (A, B, C, and D – i). Additionally, the study observed the H-bond interactions between each Protein (cMPL, JAK-2, RAS, and STAT-3) and EPAG (A, B, C, and D – ii).
Assessment of cell viability and 3H proliferation assay in EPAG treated cells
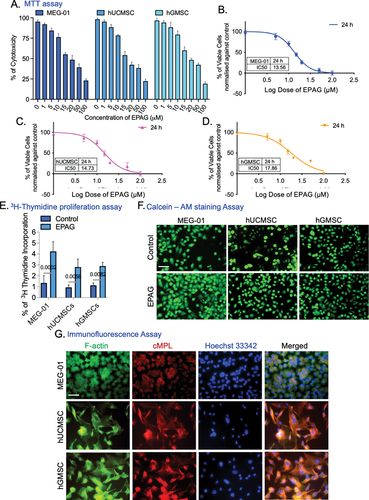
An MTT assay was performed on MEG-01, hUCMSC, and hGMSC cells. The cytotoxicity level showed a clear correlation with the dosage administered. After 24 h of incubation with EPAG, over 50% of the cells remained viable in the range of 10, 15, 20 μM, as shown in (). The achieved results were considered satisfactory. Further non-linear regression analysis () was performed on the number of viable and dead cells. Based on the Log dose calculation, we determined the IC-50 for MEG-01 (13.56 μM), hUCMSC (14.73 μM), and hGMSC (17.86 μM). In the subsequent experiments, which included thymidine incorporation assay and Calcein AM staining, cells were treated with EPAG for 48 h, receiving two consecutive doses of treatments on MEG-01, hUCMSC, and hGMSC. Results show a noteworthy boost of proliferation compared to non-treated control cells (). The immunostaining of cMPL confirms the presence of the TPO-R on hUCMSC and hGMSC, which was observed for the first time in this study. MEG-01 was utilized as a positive control ().
Figure 4. MTT assay shows the effects of EPAG on MEG-01 (Positive control), hUCMSC, and hGMSC, which are shown in (A), illustrating their percentage of cytotoxic properties. The non-linear regression model was performed to calculate the Inhibitory concentration of 50% cell death (IC-50) from 0 to 100 μM of EPAG on three different cells (B, C & D). The3H thymidine incorporation assay shows the proliferation efficiency of EPAG two dose for 48 h on all three cells compared to non-treated cells (E). Calcein AM staining confirms the enhanced proliferation of EPAG on all three cells; images were captured with 20 × magnification, 10 μm scale bar (F). Immunofluorescence analysis confirms the presence of F-actin, cMPL, and Hoechst 33 342 used to counterstain the nucleus shown in the (G). Images were captured 40 × magnifications, 20 μm scale bar.
Assessment of EPAG effects on tube formation in endothelial cells derived from hUCMSC and hGMSC
Our study demonstrates the successful differentiation of hUCMSC and hGMSC into endothelial lineages (ECs). The EC phenotypes were verified through flow cytometric analysis of VEGF-A (42.9% and 44.1%) and CD31 (53.4% and 54.8%) (). Phase contrast image of hUCMSC-ECs and hGMSC-ECs (). In addition, the properties of the endothelial phenotype are further confirmed by conducting VEGF-A immunostaining (). In addition, hUCMSC-ECs and hGMSC-ECs were treated with EPAG for the blood vessel formation assay. Following 24 and 48 hours of incubation, both types of ECs exhibited the formation of capillary-like structures on matrigel, as confirmed by CD31 immunostaining (). We used VEGF-induced angiogenesis as a positive control (Suppl– Figure S5A). Overall, the study revealed that EPAG promotes angiogenesis.
Figure 5. Flow cytometry analysis confirms the phenotypes of hUCMSC-ECs and hGMSC-ECs. The results show that hUCMSC-ECs have a VEGF-A expression of 42.9% and CD31 expression of 53.4% (A), while hGMSC-ECs have a VEGF-A expression of 44.1% and CD31 expression of 54.8% (B). The phase-contrast image (10X magnification, 10 μm scale bar) shows the differentiated endothelial-like cells obtained from hUCMSC and hGMSC (C). Immunofluorescence staining confirms the positive expression of VEGF-A and Propidium Iodide (PI) counterstain the nucleus, and images were captured with 60X magnifications, 40 μm scale bar (D). Confirmation of capillary-like structure confirmed by CD31 immunostaining for 24 and 48 h of both ECs; images were captured with 20X magnification, 20 μm scale bar (E). Gene expression profile specific to ECs shows the expression of RUNX-1 GFI-1b, VEGF-A, MYB, FOG-1, and FLI-1 (F-K). The expression levels were normalized using Tata-box binding protein (TBP). A heat map illustrates the Euclidean distance of the targeted gene expression pattern. Blue represents lower values, while red represents higher values (L).
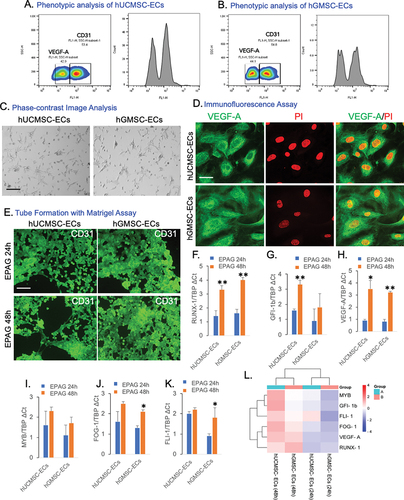
Analysis of EPAG effects on gene expression in endothelial cells derived from hUCMSC and hGMSC
Gene expression was analyzed after 24 and 48 hours of EPAG administration. After 48 hours of treatment, RUNX-1, GFI-1b, and VEGF-A expression were significantly higher in hUCMSC-ECs than in 24 hours. However, MYB, FOG-1, and FLI-1 expression increased at 48 hours, although not significant compared to 24 hours post-treatment. In contrast, after 48 hours of EPAG treatment on hGMSC-ECs, there was a considerable upregulation of RUNX-1, VEGF-A, FOG-1, and FLI-1. However, GFI-1b and MYB expression increased after 24 hours, but not significant (). EPAG treatments have demonstrated the activation of the specific gene responsible for maintaining the potency and regulate the platelet production in both differentiated ECs derived from human umbilical and gingival MSCs. An SRplot was used to investigate the bidirectional gene cluster, and a heatmap was generated to gain a deeper understanding of the identified genes ().
Analysis of EPAG effects on gene and protein expression in hUCMSC and hGMSC before and after UVB exposure
Exposure to UVB radiation leads to the death of hUCMSC and hGMSC due to oxidative damage. Our analysis indicates that a significant number of cells undergo cell death within the first 0–15 hours after UVB radiation exposure. These findings emphasize the considerable benefits of EPAG treatments in minimizing damage and acting as a shield against radiation. These treatments have shown promising results in enhancing the growth of hUCMSC and hGMSC both before and after UVB exposure. The study highlights the significant benefits of EPAG, as it improves mitogen activity and protects against cell death and DNA damage caused by UVB radiation ().
Figure 6. The analysis of live and dead cells in the UVB radiation model demonstrates the average fluorescent intensity of hUCMSC (A) and hGMSC (B) over a period of 0 – 15 hours. The gene expression analysis of EPAG treated UVB model, specifically shows the cMPL, NFκB, JAK-2, STAT-3, ERK-2, and MCL-1. The results were then normalized with TBP (C-H). A heat map represents the Euclidean distance of the targeted gene expression pattern (I). In addition, Immunofluorescence analysis confirms the expression change of CD90/cMPL protein in the control, UVB, EPAG, UVB/EPAG & EPAG/UVB groups of hUCMSC (J) and hGMSC (K). Images were captured with 40X magnification with a 20 μm scale bar.
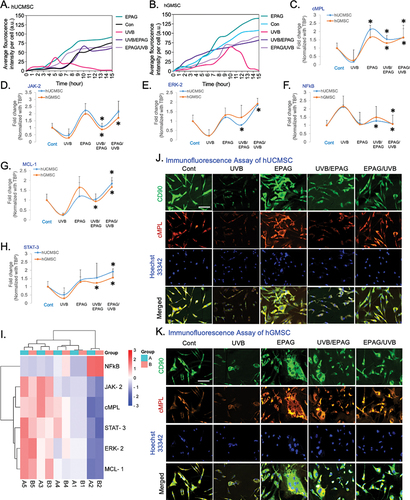
In addition, the gene expression studies of UVB-treated hUCMSC and hGMSC showed that the administration of EPAG significantly enhanced the growth of both cell types. There were significant changes in the expression of cMPL, JAK-2, ERK-2, and NFkB after exposure to UVB radiation and treatment with EPAG in hUCMSC (). However, the observed increase in MCL-1 and STAT-3 expression () did not show a significant statistical difference. In our investigation of hGMSC, we observed a significant increase in the expression of cMPL, JAK-2, MCL-1, and STAT-3 (). However, the expression of ERK-2 and NFkB did not show a significant increase (). EPAG administration to cells before UVB exposure was found to reduce the damaging effects of radiation and increase the proliferation of MSCs. The expression levels of several genes, including cMPL, ERK-2, MCL-1, NFkB, and STAT-3, showed a notable increase in hUCMSC. However, JAK-2 did not exhibit a significant increase. On the other hand, in hGMSC, the expression of cMPL, JAK-2, MCL-1, NFkB, and STAT-3 showed a considerable upregulation, although there was no statistically significant increase in ERK-2. An SRplot was used to explore the bidirectional gene cluster, resulting in a heatmap () that provided valuable insights into the identified genes.
The immunofluorescence analysis of CD90/cMPL has confirmed the presence of the TPO receptor protein in both UVB-irradiated hUCMC and hGMSC cells. Compared to the control group, the stemness properties of CD90 were reduced, and there was a noticeable decrease in cMPL expression due to UVB radiation damage. Unlike the control group, both hUCMSC and hGMSC in the EPAG-treated group exhibit mitogen stimulation in the culture. It is essential to mention that when EPAG is administered as a pre-treatment before UVB radiation, it effectively protects against damage in both hUCMSC and hGMSC. The nucleus was stained with Hoechst 33 342 (), and DAPI was tested as an additional control for nuclear staining (Suppl– Figure S5B).
Discussion
EPAG is a small molecule that activates the cMPL receptor. It interacts with the transmembrane domain of the receptor protein complex and triggers a signal transduction process involving the JAK/STAT pathways. These pathways ultimately lead to the complex process of cell differentiation and proliferation. Based on studies conducted on preclinical models and healthy volunteers, EPAG has been shown to effectively increase platelet counts and reduce thrombocytopenia in individuals with chronic hepatitis C-related cirrhosis.Citation6 Additionally, EPAG was well tolerated, with no reports of severe adverse events.Citation26 Furthermore, cMPL agonist drugs such as Nplate typically improve hematopoietic recovery by stimulating the production of white cells and platelets after total body irradiation.Citation27 It is widely recognized that the cMPL receptor is present in liver cells, megakaryocytes, and hematopoietic cells.Citation28 However, there is limited information available regarding the presence and impact of the cMPL receptor on stem cell proliferation and differentiation. In this study, we extensively investigate to predict and confirm a complex between a ligand (EPAG) and receptor (cMPL) using computational techniques. The ligand functions as a small molecule, while the receptor may be a predicted nucleic acid. Here, in our model, we demonstrated the activation of multiple downstream signaling pathway molecules, including cMPL, JAK-2, RAS, and STAT-3. Additionally, we performed molecular dynamics simulations to evaluate the stability of the ligand when interacting with different target proteins.Citation29
Molecular dynamics simulations can provide valuable insights into the structural conformations of proteins with parameters like RMSD, RMSF, and Rg values. When assessing the stability of a protein backbone in the presence of a ligand, it is helpful to consider the RMSD.A lower RMSD value throughout the MD simulation indicates higher stability in the protein-ligand system.Citation30 In contrast, a higher RMSD value suggests relatively weaker stability. Typically, protein systems consider lower RMSD values to be acceptable.Citation31 RMSF is another parameter used to analyze specific parts of the protein structure that deviate from their average structure. Increased RMSF values indicate that the protein structure will exhibit enhanced flexibility. However, only marginal flexibility exists in the protein-ligand system, resulting in decreased RMSF values.Citation32 In a 2020 study, Muralidharan et al. revealed that the RMSF of the terminal residues of this protein displayed a nearly identical profile.Citation33 Additionally, the Rg parameter is defined as the root mean square distance of a set of atoms from their center of mass, considering their masses. Furthermore, EPAG (Revolade) is a TPO-mimetic medication primarily used to treat immune thrombocytopenic purpura by enhancing platelet formation through TPO receptor activation.Citation34 Although megakaryocytes are the only hematopoietic cell lineages affected by the loss of TPO signaling, it is widely recognized that TPO signaling may play a role in maintaining hematopoietic stem cells.Citation35 In this study, we tested our computationally predicted hypothesis using an in-vitro model. For the first time, we demonstrated that adding EPAG to hUCMSC and hGMSC resulted in the expression of the cMPL receptor and induced significant improvements in the proliferation of both hUCMSCCitation36 and hGMSC.Citation21 Importantly, these improvements were observed without any changes in the cell phenotypes, as confirmed by experiments, including cell viability and 3 H Thymidine incorporation.
In this study, we conducted further experiments to study the development of angiogenesis in differentiated endothelial-like cells. Our results showed that the administration of EPAG significantly enhanced the progression of angiogenesis in these cells, leading to the formation of new vascular structures.Citation37 We also demonstrated that TPO-dependent angiogenesis triggers the activation of crucial angiogenesis factors, including RUNX-1, GFI-1b, VEGF-A, MYB, GOF-1, and FLI-1 in both hUCMSC-ECs and hGMSC-ECs. Additionally, we investigated the radioprotective properties of EPAG in hUCMSC and hGMSC exposed to UVB radiation, confirmed by the expression of CD90/cMPL.
Our research indicates that EPAG serves a dual function. It promotes the proliferation of both hUCMSC and hGMSCCitation38 and also helps mitigate the damage caused by UVB radiation. Additionally, it has been observed that EPAG exhibits radioprotective properties, shielding stem cells from radiation damage when administered before exposure. This effect has been demonstrated through gene expression analysis at the molecular level, using highly accurate MD simulation of molecules.Citation39 Our study indicates that specific genes such as JAK-2, ERK-2, MCL-1, NFkB, and STAT-3 are activated following the activation of TPO-R (cMPL) in both hUCMSC and hGMSC. These findings are consistent with previous reports. It has been shown in previous studies that HSCs express TPO-R, suggesting their potential for treating hematopoietic radiation injury syndrome.Citation38 Our study aims to identify a new source of MSCs for stem cell therapyCitation25 and to treat normal tissue damage following radiotherapy.Citation40 The objective is to facilitate the recovery of normal tissue exposed to ionizing radiation, thereby minimizing the unintended side effects of tissue damage.
In summary, this study suggests that EPAG could be a more effective and safer drug for enhancing the growth of hUCMSC and hGMSC. Computational methods, such as molecular dynamics simulations, provided more reliable findings for the drug discovery process. Furthermore, EPAG enhances proliferation and promotes the development of angiogenesis of endothelial-like cells. Interestingly, EPAG stimulates mitogens and protects against UVB radiation injury in an in vitro model. Therefore, considering all these factors, EPAG could potentially be used as a drug to treat and mitigate radiation injury syndrome.
Contribution
RS, DS, and SSO were responsible for conceptualization and methods. RS, DS, SSO, MGD, and SI conducted the experiments, while RS, RS DS, SSO, and NS handled the data analysis. RB, RS, and AC were responsible for writing, formatting, and editing the paper. After their contributions and critical examination, all authors approved the final version of the article.
Supplemental Material
Download PDF (813.7 KB)Acknowledgments
Thanks to Chettinad Academy of Research and Education for their invaluable support, we achieved great success with this project. Their unwavering assistance was instrumental in reaching our goals, and we are immensely grateful for their contribution. Thanks to Prof. Chandan Guha, Department of Radiation Oncology, Albert Einstein College of Medicine, New York, USA for his support and mentorship.
Disclosure statement
No potential conflict of interest was reported by the author(s).
Supplementary material
Supplemental data for this article can be accessed online at https://doi.org/10.1080/09537104.2024.2359028
Correction Statement
This article has been republished with minor changes. These changes do not impact the academic content of the article.
Additional information
Funding
References
- Chang Y, Bluteau D, Debili N, Vainchenker W. From hematopoietic stem cells to platelets. J Thromb Haemost. 2007;5:318–13. doi:10.1111/j.1538-7836.2007.02472.x.
- Chen W-M, Yu B, Zhang Q, Xu P. Identification of the residues in the extracellular domain of thrombopoietin receptor involved in the binding of thrombopoietin and a nuclear distribution protein (human NUDC). J Biol Chem. 2010;285(34):26697–709. doi:10.1074/jbc.M110.120956.
- Fox NE, Lim J, Chen R, Geddis AE. F104S c-Mpl responds to a transmembrane domain−binding thrombopoietin receptor agonist: proof of concept that selected receptor mutations in congenital amegakaryocytic thrombocytopenia can be stimulated with alternative thrombopoietic agents. Exp Hematol. 2010;38(5):384–91. doi:10.1016/j.exphem.2010.02.007.
- Besancenot R, Roos-Weil D, Tonetti C, Abdelouahab H, Lacout C, Pasquier F, Willekens C, Rameau P, Lecluse Y, Micol J-B, et al. JAK2 and MPL protein levels determine TPO-induced megakaryocyte proliferation vs differentiation. Blood J Am Society Hematol. 2014;124(13):2104–15. doi:10.1182/blood-2014-03-559815.
- Cines DB, Yasothan U, Kirkpatrick P. Romiplostim. Nat Rev Drug Discov. 2008;7(11):887–9. doi:10.1038/nrd2741.
- McHutchison JG, Dusheiko G, Shiffman ML, Rodriguez-Torres M, Sigal S, Bourliere M, Berg T, Gordon SC, Campbell FM, Theodore D, et al. Eltrombopag for thrombocytopenia in patients with cirrhosis associated with hepatitis C. N Engl J Med. 2007;357(22):2227–36. doi:10.1056/NEJMoa073255.
- Fox N, Priestley G, Papayannopoulou T, Kaushansky K. Thrombopoietin expands hematopoietic stem cells after transplantation. J Clin Invest. 2002;110(3):389–94. doi:10.1172/JCI0215430.
- Qian H, Buza-Vidas N, Hyland CD, Jensen CT, Antonchuk J, Månsson R, Thoren LA, Ekblom M, Alexander WS, Jacobsen SEW. et al. Critical role of thrombopoietin in maintaining adult quiescent hematopoietic stem cells. Cell Stem Cell. 2007;1(6):671–84. doi:10.1016/j.stem.2007.10.008.
- Zhang X, Zhao Y, Li X, Han P, Jing F, Kong Z, Zhou H, Qiu J, Li L, Peng J, et al. Thrombopoietin: a potential diagnostic indicator of immune thrombocytopenia in pregnancy. Oncotarget. 2016;7(7):7489. doi:10.18632/oncotarget.7106.
- Bussel JB, Soff G, Balduzzi A, Cooper N, Lawrence T, Semple JW. A review of romiplostim mechanism of action and clinical applicability. Drug Des Devel Ther. 2021;15:2243–68. doi:10.2147/DDDT.S299591.
- Balakrishnan R, Subbarayan R, Shrestha R, Chauhan A, Krishnamoorthy L. Exploring platelet-derived microvesicles in vascular regeneration: unraveling the intricate mechanisms and molecular mediators. Mol Biol Rep. 2024;51(1):393. doi:10.1007/s11033-024-09302-1.
- Kao Y-R, Chen J, Narayanagari S-R, Todorova TI, Aivalioti MM, Ferreira M, Ramos PM, Pallaud C, Mantzaris I, Shastri A. et al. Thrombopoietin receptor–independent stimulation of hematopoietic stem cells by eltrombopag. Sci Transl Med. 2018;10(458):eaas9563. doi:10.1126/scitranslmed.aas9563.
- Vlachodimitropoulou E, Chen Y-L, Garbowski M, Koonyosying P, Psaila B, Sola-Visner M, Cooper N, Hider R, Porter J. Eltrombopag: a powerful chelator of cellular or extracellular iron (III) alone or combined with a second chelator. Blood J Am Society Hematol. 2017;130(17):1923–33. doi:10.1182/blood-2016-10-740241.
- Roshni J, Vaishali R, Ganesh KS, Dharani N, Alzahrani KJ, Banjer HJ, Alghamdi AH, Theyab A, Ahmed SS, Patil S. et al. Multi-target potential of Indian phytochemicals against SARS-CoV-2: a docking, molecular dynamics and MM-GBSA approach extended to Omicron B. 1.1. 529. J Infect Public Health. 2022;15(6):662–9. doi:10.1016/j.jiph.2022.05.002.
- Malik R, Choudhary BS, Srivastava S, Mehta P, Sharma M. Identification of novel acetylcholinesterase inhibitors through e-pharmacophore-based virtual screening and molecular dynamics simulations. J Biomol Struct Dyn. 2017;35(15):3268–84. doi:10.1080/07391102.2016.1253503.
- Lozano ML, Segú-Vergés C, Coma M, Álvarez-Roman MT, González-Porras JR, Gutiérrez L, Valcárcel D, Butta N. Elucidating the mechanism of action of the attributed immunomodulatory role of eltrombopag in primary immune thrombocytopenia: an in silico approach. Int J Mol Sci. 2021;22(13):6907. doi:10.3390/ijms22136907.
- Choudhary S, Kesavan AK, Juneja V, Thakur S. Molecular modeling, simulation and docking of Rv1250 protein from Mycobacterium tuberculosis. Front Bioinform. 2023;3:1125479. doi:10.3389/fbinf.2023.1125479.
- Kailass K, Sadovski O, Capello M, Kang Y, Fleming JB, Hanash SM, Beharry AA. Measuring human carboxylesterase 2 activity in pancreatic cancer patient-derived xenografts using a ratiometric fluorescent chemosensor. Chem Sci. 2019;10(36):8428–37. doi:10.1039/C9SC00283A.
- Li F, Gou X, Xu D, Han D, Hou K, Fang W, Li Y. Improvement of tube formation model of cell: Application for acute hypoxia in in vitro study of angiogenesis. Microvasc Res. 2022;140:104297. doi:10.1016/j.mvr.2021.104297.
- Kim JS, Lee SD, Lee SJ, Chung MK. Development of an immunotherapeutic adenovirus targeting hormone-independent prostate cancer. OncoTargets Ther. 2013; 1635–42. doi:10.2147/OTT.S51749.
- Rao SR, Subbarayan R, Dinesh MG, Arumugam G, Raja STK. Differentiation of human gingival mesenchymal stem cells into neuronal lineages in 3D bioconjugated injectable protein hydrogel construct for the management of neuronal disorder. Exp. Mol. Med. 2016;48(2):209–209. doi:10.1038/emm.2015.113.
- Ranga Rao S, Subbarayan R. Passage‐dependent expression of STRO‐1 in human gingival mesenchymal stem cells. J Cell Biochem. 2019;120(3):2810–5. doi:10.1002/jcb.27674.
- Militi A, Cutroneo G, Favaloro A, Matarese G, Di Mauro D, Lauritano F, Centofanti A, Cervino G, Nicita F, Bramanti A, et al. An immunofluorescence study on VEGF and extracellular matrix proteins in human periodontal ligament during tooth movement. Heliyon. 2019;5(10). doi:10.1016/j.heliyon.2019.e02572.
- Gęgotek A, Jastrząb A, Dobrzyńska M, Biernacki M, Skrzydlewska E. Exogenous antioxidants impact on uv-induced changes in membrane phospholipids and the effectiveness of the endocannabinoid system in human skin cells. Antioxidants. 2021;10(8):1260. doi:10.3390/antiox10081260.
- Subbarayan R, Murugan Girija D, Raja STK, Krishnamoorthy A, Srinivasan D, Shrestha R, Srivastava N, Ranga Rao S. Conditioned medium-enriched umbilical cord mesenchymal stem cells: a potential therapeutic strategy for spinal cord injury, unveiling transcriptomic and secretomic insights. Mol Biol Rep. 2024;51(1):570. doi:10.1007/s11033-024-09503-8.
- Provan D, Saleh M, Goodison S, Rafi R, Stone N, Hamilton JM, Hassani H, Mayer B, Uhl J, Jenkins J, et al. The safety profile of Eltrombopag, a novel oral platelet growth factor, in thrombocytopenic patients and healthy subjects. J Clin Oncol. 2006;24(18_suppl):18596–18596. doi:10.1200/jco.2006.24.18_suppl.18596.
- Kumar VP, Holmes-Hampton GP, Biswas S, Stone S, Sharma NK, Hritzo B, Guilfoyle M, Eichenbaum G, Guha C, Ghosh SP. Mitigation of total body irradiation-induced mortality and hematopoietic injury of mice by a thrombopoietin mimetic (JNJ-26366821). Sci Rep. 2022;12(1):3485. doi:10.1038/s41598-022-07426-7.
- Noetzli LJ, French SL, Machlus KR. New insights into the differentiation of megakaryocytes from hematopoietic progenitors. Arterioscler Thromb Vasc Biol. 2019;39(7):1288–300. doi:10.1161/ATVBAHA.119.312129.
- Hollingsworth SA, Dror RO. Molecular dynamics simulation for all. Neuron. 2018;99(6):1129–43. doi:10.1016/j.neuron.2018.08.011.
- Kapla J, Rodríguez-Espigares I, Ballante F, Selent J, Carlsson J. Can molecular dynamics simulations improve the structural accuracy and virtual screening performance of GPCR models? PLOS Comput Biol. 2021;17(5):e1008936. doi:10.1371/journal.pcbi.1008936.
- Kufareva I, Abagyan R. Methods of protein structure comparison. Homol Model: Methods Mol Biol. 2012;857:231–57. doi:10.1007/978-1-61779-588-6_10.
- Bhowmick S, AlFaris NA, ALTamimi JZ, ALOthman ZA, Aldayel TS, Wabaidur SM, Islam MA. Screening and analysis of bioactive food compounds for modulating the CDK2 protein for cell cycle arrest: multi-cheminformatics approaches for anticancer therapeutics. J Mol Struct. 2020;1216:128316. doi:10.1016/j.molstruc.2020.128316.
- Muralidharan N, Sakthivel R, Velmurugan D, Gromiha MM. Computational studies of drug repurposing and synergism of lopinavir, oseltamivir and ritonavir binding with SARS-CoV-2 protease against COVID-19. J Biomol Struct Dyn. 2021;39(7):2673–8. doi:10.1080/07391102.2020.1752802.
- Cheng G. Eltrombopag, a thrombopoietin-receptor agonist in the treatment of adult chronic immune thrombocytopenia: a review of the efficacy and safety profile. Ther Adv Hematol. 2012;3(3):155–64. doi:10.1177/2040620712442525.
- de Graaf CA, Metcalf D. Thrombopoietin and hematopoietic stem cells. Cell Cycle. 2011;10(10):1582–9. doi:10.4161/cc.10.10.15619.
- Zhou Y, Zhou J, Xu X, Du F, Nie M, Hu L, Ma Y, Liu M, Yu S, Zhang J. et al. Matrigel/umbilical cord-derived mesenchymal stem cells promote granulosa cell proliferation and ovarian vascularization in a mouse model of premature ovarian failure. Stem Cells Dev. 2021;30(15):782–96. doi:10.1089/scd.2021.0005.
- Davulcu EA, Soyer NA, Vural F. Eltrombopag for the treatment of allogeneic hematopoietic stem cell transplantation-related poor graft function. Cureus. 2023;15(9):e44555. doi:10.7759/cureus.44555.
- Muntión S, Preciado S, Sánchez-Luis E, Corchete L, Díez-Campelo M, Osugui L, Martí-Chillón G-J, Vidriales M-B, Navarro-Bailón A, De Las Rivas J, et al. Eltrombopag increases the hematopoietic supporting ability of mesenchymal stem/stromal cells. Ther Adv Hematol. 2022;13:20406207221142137. doi:10.1177/20406207221142137.
- Chatterjee S, Maity A, Chowdhury S, Islam MA, Muttinini RK, Sen D. In silico analysis and identification of promising hits against 2019 novel coronavirus 3C-like main protease enzyme. J Biomol Struct Dyn. 2021;39(14):5290–303. doi:10.1080/07391102.2020.1787228.
- Coppes RP, van der Goot A, Lombaert IM. Stem cell therapy to reduce radiation-induced normal tissue damage. Semin Radiat Oncol. 2009;19(2):112–21. doi:10.1016/j.semradonc.2008.11.005.