
ABSTRACT
The focus of this article is the economic policies pursued in the UK in response to the coronavirus pandemic in the first twelve months of that crisis (February 2020 to January 2021). The measures of lockdown, quarantine, limitations on travel and so on are discussed as relevant to economic policies. The timeline of the policy responses to coronavirus, the evolution of the infections, and of economic activity is briefly outlined. The main fiscal policy responses in terms of development of policy programmes and the evolving budget deficit are considered, as are the policies of the Bank of England. There is a brief discussion of the financing and funding of public expenditure, and of post-pandemic budgetary policies. The failures of public procurement policies during the pandemic are reviewed, particularly in relation to the interface between public and private sectors. This is followed by consideration of aspects of inequalities and the coronavirus pandemic.
JEL CLASSIFICATION:
1. Introduction
This article is focused on the UK experience in the first twelve months (February 2020 to January 2021)Footnote1 of the coronavirus pandemic, and on policies pursued during that period. Overall evaluation of the effectiveness of government responses to the coronavirusFootnote2 is not directly tackled here.Footnote3 The measures of lockdown, quarantine, limitations on travel and so on are only discussed as relevant for economic policies and their effects.
In Section Two, I briefly outline the timeline of the policy responses to coronavirus, the evolution of the infections, and of economic activity. Section Three outlines the main fiscal policy responses, while Section Four moves on to explore some Bank of England policies. Section Five relates to the failures of the private contracting system and Section Six considers inequalities and coronavirus. Concluding comments are provided in Section Seven.
2. Timeline and Economic Events
2.1. Policy Responses
The World Health Organization (WHO) declared the coronavirus outbreak a public health emergency of international concern on 30 January 2020. The UK policy responses to the coronavirus crisis were rather slow, and the first emergency coronavirus meeting chaired by Prime Minister Johnson only occurred on 2 March when Britain had officially recorded 39 cases. On 9 March,Footnote4 when there had been four deaths from coronavirus in the UK, the action plan to tackle the virus was described as involving four phases: contain, delay, research, and mitigate. The public was advised that ‘the best thing we can all do is wash our hands for 20 seconds with soap and water’. There were signs that the government was intending to pursue a ‘herd immunity’ approach. However, three days later it (Johnson Citation2020b) moved to ‘delay its spread and thereby minimise the suffering’ by advising those with coronavirus symptoms to stay at home for at least seven days, thereby seeking to delay the peak of infection by a few weeks. By 16 March (Johnson Citation2020c), when cases were doubling every five or six days, government policy stated that, when anyone in a household had symptoms, all household members should stay at home for fourteen days. On 18 March (Johnson Citation2020d), it was announced that schools would be closed for most pupils (with exceptions for children of key workers and ‘vulnerable’ children) until further notice. Schools were then re-opened in June on a limited basis, and then fully re-opened for all in September with the start of the new school year. Schools were then subject to larger scale closures during January 2021.
A lockdown policy was announced on 23 March, starting three days later, which meant that members of the public were only allowed to leave their homes for limited reasons, including food shopping, exercise once per day, medical need and travelling for work when absolutely necessary. All shops selling non-essential goods were told to close, gatherings of more than two people in public were banned, and events, including weddings, were cancelled. From mid-May onwards, the lockdown was gradually relaxed. The first reversal of the easing of restrictions came at the end of June, when a local lockdown was imposed on the city of Leicester following a spike of coronavirus cases in the city. Throughout the rest of the year, there were frequent changes in regulations and guidance, often operated on a localised basis. A second lockdown started on 5 November, applying to England, with the other nations adopting different timetables and varying in the precise requirements. This lockdown was scheduled for an end date of 2 December. After relaxations for December, though with some sudden reversals, a third lockdown started in early January 2021. The COIVD-19 policy responses have been characterised by delays in taking action, particularly at the beginning, sudden reversals of policy with little notice, and degrees of policy differences between the four nations of the UK.Footnote5
2.2. Infection and Death Rates
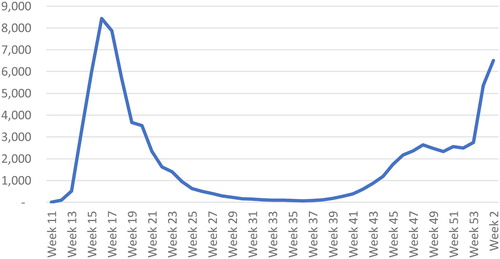
The time path of coronavirus infections is illustrated in It shows a sharp rise in the first half of April, a plateau in mid-April to early May, a decline until early August, a rise during August, September and October, a decline as the second lockdown has an effect, then a dramatic increase during December and into January, followed by a decline as the third lockdown has an effect. As a result of changes in the extent of testing, the statistics are not fully comparable over time. Deaths from coronavirus initially peaked at a weekly rate of over 9,000 in the week ending 17 April, and declined sharply thereafter, followed by rises in the fourth quarter of the year ().
Figure 1. Weekly COVID-19 infection rate. Source: Department of Health and Social Care data.
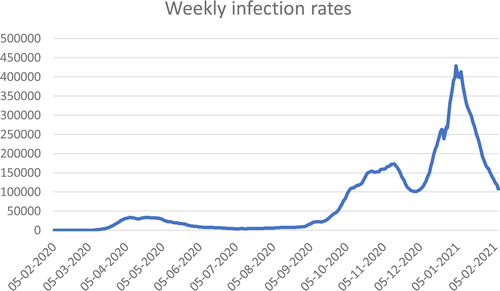
Figure 2. Weekly deaths from COVID, UK. Source: ONS, Deaths registered weekly in the UK, downloaded 28 January 2021; Week 11 = week ending 13 March; week 2(2021) = week ending 15 January 2021.
2.3. Employment and GDP
Gross domestic product fell by over 7 per cent in March 2020 over February, and by a further 19 per cent in April. It then recovered month by month through to October, when it was 6 per cent below the February figure. GDP then fell as some of the limitations on shops and services were re-introduced. During 2020, GDP was expected to be more than 10 per cent lower than 2019. indicates that the sharpest falls occurred in gross capital formation and private consumption, and those reflected in the fall in imports.
Table 1. Quarter to quarter changes in expenditure.
A flavour of the sectoral shifts is indicated in , noting that there has to be a large balancing item as the sectoral balances as reported do not sum to zero. The notable features are the increase in government borrowing between Q1 and Q2, and some decline between Q2 and Q3, with broadly matching movements in net savings in the household sector, corresponding to a sharp rise in savings as consumer expenditure was curtailed.
Table 2. Net borrowing/lending by sector.
The fall in output was not reflected in the unemployment rate, which started 2020 at 4 per cent and rose during the year to 5 per cent. The Coronavirus Job Retention Scheme (CJRS) was successful in maintaining people in work, albeit with significant reductions in pay for the low paid. The effects on unemployment are forecast to emerge in 2021, with rates of around 8 per cent expected.
3. Fiscal Policy Responses
The pre-arranged budget for the financial year 2020/21 was presented on 11 March, with the inclusion of fiscal measures responding to the coronavirus made close to the budget (Sunak Citation2020a). The budget was quickly supplemented by a further raft of measures announced on 20 March. The 2020 budget contained a fiscal loosening of £18 billion based on pre-COVID-19 assumptions, and then an additional £12 billion. The budget statement announced clear co-ordination with the Bank of England: ‘a 50 basis point reduction to interest rates, to support business and consumer confidence’. However, it is not clear how confidence is helped by a reduction in interest rates. In specific respect of the coronavirus, the government announced that ‘whatever extra resources our NHS needs to cope with coronavirus—it will get’, with a £5 billion emergency fund allocated immediately. There were some changes to welfare payments and, specifically, Statutory Sick Pay became available to those advised to self-isolate, and the minimum income floor in Universal Credit was raised temporarily. The extension of sick pay did not address the low level of statutory sick pay (£95.85 per week, around one-fifth of average earnings). Some, though by no means all, of the shortcomings of Universal Credit were temporarily addressed by a rise in the minimum income floor and some speeding up of payments.
Later, in his statement of 20 March, the Chancellor announced increases in Universal Credit and Working Tax Credit that were to benefit over 4 million households, with nearly £7 billion of extra support provided through the welfare system to boost people’s income (Sunak Citation2020b).
A second round of fiscal measures and new programmes followed, announced on 20 March. The most notable was the introduction of the CJRS, which was undertaken for the first time in the UK, with no limit on the amount of funding available for the scheme, and a willingness to support as many jobs as necessary. The wages of those furloughed, not working but kept on pay-roll, were covered by a grant of up to a total of £2,500 per month. The CJRS was initially intended for three months, backdated to 1 March, reflecting views on how long the pandemic would last, but was then extended at various times to at least the end of March 2021 and variations in the contribution of government to wages of those furloughed. At its peak in early May, the CJRS was supporting 8.9 million jobs, equivalent to over a quarter of the workforce, gradually declining as businesses were able to re-open. The data in September showed that the programme had cost the government £35.4 billion so far. There have been suggestions that up to £3.5 billion in CJRS payments may have been claimed fraudulently or paid out in error. HM Revenue and Customs told MPs on the Public Accounts Committee that it estimates that 5–10 per cent of furlough cash has been wrongly awarded.
In July 2020, the Chancellor of the Exchequer presented his Plan for Jobs to Parliament. A Job Retention Bonus was introduced whereby a one-off £1,000 payment was made to employers for every employee they had previously claimed for under the scheme, who remained continuously employed through to 31 January 2021. A Job Support Scheme was introduced from 1 November, for employees working at least one-third of their usual hours.
There were a range of measures intended to aid cash flow, including the deferment of self-assessment tax payments by the self-employed by six months, and the deferment of VAT payments by three months in Q2, followed by an extended payment period. A three-month mortgage holiday was available on application, although it was added to future interest payments. Subsequent measures included ‘Eat Out to Help Out’, whereby participating businesses offered a 50 per cent discount Monday to Wednesday of up to £10 per person on food and non-alcoholic drinks consumed on premises, and a temporary reduction in VAT in the hospitality sector.
The IMF (Citation2021) estimates that policy measures (announced up to 31 December 2020) would, for the UK, involve additional spending or foregone revenues amounting to the equivalent of 16.3 per cent of GDP, putting the UK amongst the largest of policy responses, and compared with a global average of 7.4 per cent. Of the total, 5.3 per cent (of GDP) was additional spending in the health sector, 10.9 per cent in the non-health sector and 0.3 per cent accelerated spending/deferred income. provides a summary of the effects of policy measures on expenditure and deficit based on IMF (Citation2021) data.
Table 3. Spending by UK government on COVID related policy measures, FY 2020–21.
The fiscal policy responses were notable for the scale of the resulting budget deficit, amongst the largest in the world. Fiscal policy rules with numerical targets for budget deficit and debt level were quickly abandoned in response to the coronavirus pandemic, and announcements by the Chancellor of the Exchequer were notable for their ‘we’ll spend whatever it takes’ tone, particularly in relation to expenditure on health and the furlough scheme, and recognising that estimating the extent of uptake and costs was difficult. The large increase in the budget deficit was (not surprisingly) matched by a dramatic rise in household savings and a decline in private investment. Much of the rise in household savings has the characteristic of being ‘forced’ in that it arises from closures, whether full or partial, of retail, entertainment and service establishments and of lockdowns.
4. Central Bank and Monetary Policy
The Bank of England lowered the bank rate from the 0.75 per cent level to 0.25 per cent on 13 March and then to 0.1 per cent on 23 March. The Bank of England (via the Monetary Policy Committee, MPC) engaged in further quantitative easing (QE) in two stages: on 19 March, increasing its holdings of UK government bonds and sterling non-financial investment-grade corporate bonds by £200 billion to a total of £645 billion. Subsequently, on 17 June, the MPC ‘agreed to increase the target stock of purchased UK government bonds by an additional £100 billion in order to meet the inflation target in the medium term’ (Bank of England Citation2020a, p. 3, emphasis added).
On 11 March, the Bank of England’s three policy committees announced a package of measures to support UK businesses and households through this period. On 17 March, HM Treasury announced the Covid Corporate Financing Facility (CCFF), for which the Bank acts as HM Treasury’s agent. The Bank of England enlarged the Term Funding Scheme with additional incentives for SMEs (TFSME) scheme, financed by the issuance of central bank reserves. The TFSME offered, over a twelve-month period, four-year funding of at least 10 per cent of participants’ stock of real economy lending at interest rates at, or very close to, Bank rate. Additional funding would be available for banks that increase lending, especially to small and medium-sized enterprises (SMEs).
The CCFF was designed to support liquidity among larger firms, helping them to bridge coronavirus disruption to their cash flows through the purchase of short-term debt in the form of commercial paper.
A temporary extension of the government’s Ways and Means (W&M) facility was agreed between the Treasury and the Bank of England, which provided ‘a short-term source of additional liquidity to the government if needed to smooth its cashflows and support the orderly functioning of markets, through the period of disruption from COVID-19’ (Bank of England news release, 9 April 2020). However, the Bank of England noted that ‘the government will continue to use the markets as its primary source of financing, and its response to Covid-19 will be fully funded by additional borrowing through normal debt management operations. Any use of the W&M facility will be temporary and short-term’ and any drawing to be repaid before the end of the year (2020).
5. Privatisation and Public–Private Contracts
In terms of dealing with the pandemic, the health service is at the front line, and, in the UK case, is an NHS that is (largely) free at the point of use, and where the vast majority of hospitals are publicly owned and operated. Many members of the present Conservative government have been long-standing advocates of privatisation of parts of the health service. Rogers (Citation2020a, p. 4) argues that, when Johnson became prime minister in July 2019, ‘a swathe of special advisors was put into Downing Street and all key ministries, from the Tufton Street cluster of neoliberal think tanks.Footnote6 The pandemic has been a golden opportunity to accelerate the final stages of the neoliberal transition.’
Two areas of supply related to the health service—provision of personal protective equipment (PPE) and the ‘test and trace’ system—have caused substantial problems. In both cases, there were issues concerning the relative roles of the public and the private, the contractual relations involved (e.g., to whom contracts were awarded, on what basis), difficulty of monitoring the contracts, especially when layers of sub-contracting were involved, and the nature of the companies to which the contracts were awarded.
5.1. Test and Trace
The importance of testing for coronavirus was stressed early on by the World Health Organization and many others (www.bbc.co.uk/news/av/world-51916707, 16 March 2020). On 20 May 2020, Prime Minister Johnson told the House of Commons that, ‘We will have a test, track and trace operation that will be world-beating, and yes, it will be in place by 1 June’, which is illustrative of the bombastic approach of the government and stands in contrast to the subsequent failures. The test and trace systems have been a major source of difficulty in counteracting the coronavirus; as Rogers (Citation2020b, p. 3) puts it, ‘the immediate crisis is being made far worse by an appallingly incompetent national test-and-trace system that is rapidly coming apart at the seams’. Rogers views ‘the combining of test and trace largely contracted out to private companies with Public Health England which had been starved of funds over the previous decade of austerity as developing this neoliberal agenda’. The key difficulties can be identified as arising from ‘the chaotic and hugely expensive privatisation of the whole process instead of properly funded use of local experts’ (Rogers Citation2020b).
Pollock (Citation2020) notes the erosion of the established system for contact tracing operated through Public Health England (PHE) and run by local public health protection teams in the public sector as a result of decades of cuts and closures. She identifies the inefficiencies of the two companies (Serco and Sitel) contracted for part of the contact tracing, with 27,000 workers employed by those two companies reaching and advising an average of about two cases and two contacts per call handler over a twelve-week period. Taylor (Citation2020), Conn and Geoghegan (Citation2020), Calver and Pogrund (Citation2020), and Sikka (Citation2021), amongst others, document cases of inexperienced firms contracted for test and trace, and often the close links of companies with Conservative politicians.
Initially, PHE carried out comprehensive test and trace activities for relatively low numbers of infections. Comprehensive contact tracing was suspended in mid-March as the national lockdown was introduced. Testing capacity was scaled up during April. A new NHS Test and Trace Service (NHST&T) was launched at the end of May 2020. NHST&T included only one public health expert on its top team (reported in the Local Government Chronicle, 15 September 2020), casting doubts on its relevant expertise:
NHST&T has an unusual organisational relationship with the Department [of Health & Social Care], with unclear accountability. NHST&T is subject to the Department’s financial, information and staffing controls, but its head, the executive chair, does not report to the Department’s ministers or permanent secretary, but rather to the Prime Minister and the Cabinet Secretary. (Department of Health & Social Care Citation2020, p. 8)
meet a target to provide results within 24 hours for tests carried out in the community. 93 per cent of results provided within 24 hours in June falling to a low of 14% in mid-October. It did not plan for a sharp rise in testing demand in early autumn when schools and universities reopened. (p. 10)
5.2. Personal Protective Equipment
Throughout the first months of the coronavirus crisis, there was a great shortage of personal protective equipment (PPE), reflecting the lack of preparedness for a pandemic, and how ‘in the six years before the COVID-19 pandemic, the government, committed to austerity, ran down the emergency PPE stockpile by 40%’ (Sikka Citation2021). ‘Many companies with proven track records offered to make or obtain PPE, but most were rejected or ignored by Public Health England (PHE) and the Government. Instead, rules for emergency procurement were used to commission many other companies that had no experience and little or no trading history’ (Colegrave Citation2020). Colegrave (Citation2020) describes the purchase of faulty antibody tests from China (£129 million) and the ordering of 10 million tests from Roche and Abbott with little evidence of their effectiveness (£919 million).Footnote8
Durrant et al. (Citation2021, p. 16) note the complaint that ‘the chaotic process for awarding contracts led to inexperienced or inappropriate suppliers winning big contracts’. They further report that ‘the National Audit Office found that business allocated to the ‘high-priority line’ for PPE contracts were 10 times more likely to get a contract than others. Businesses were allocated to this group based on leads from ministers and officials. The National Audit Office (NAO) found that the reasons for particular awards were often not documented, leaving the government open to charges of cronyism’ (ibid). Durrant et al. (Citation2021, p. 3) report that, of the £17.3 billion spent on such contracts, only 1 per cent was awarded through competitive tendering. Around 38 per cent was awarded through existing framework agreements that are designed to allow governments to procure goods and services quickly when needed. The remaining 61 per cent was awarded directly to contractors without any competition.
In their report on the procurement of PPE, the cross-party House of Commons Public Accounts Committee view the government’s ‘failure to be transparent about its decisions, publish contracts in a timely manner or maintain proper records of key decisions left it open to accusations of poor value for money, conflicts of interest and preferential treatment of some suppliers, and undermines public trust’ (Public Accounts Committee Citation2021, p. 3).
Bradley et al. (Citation2020), in the New York Times, analysed British expenditure on PPE, focusing on around 1,200 central ‘government contracts that have been made public, together worth nearly $22 billion’, and found that, ‘[o]f that, about $11 billion went to companies either run by friends and associates of politicians in the Conservative Party, or with no prior experience or a history of controversy. Meanwhile, smaller firms without political clout got nowhere.’ They reported that about $5 billion went to politically connected companies (former ministers and government advisers on staff, donators to the Conservative Party) and around $6 billion went to companies without prior experience in supplying medical PPE, including fashion designers, pest controllers and jewellers. Over $5 billion went to ‘companies with histories of controversy, from tax evasion and fraud to corruption and human right abuses’.
5.3. Effectiveness of Spending
As outlined above, a range of support measures for business and innovative (for the UK) means of support for employment were provided. What can be said about the effectiveness of the spending on such measures?
According to Durrant et al. (Citation2021, p. 8), the available evidence ‘suggests that the policies implemented to support long-term viable businesses and jobs have been successful’; indeed, nine in ten of those utilising the CJRS have now returned to their job. However, ‘there are examples of policies that have been poor value for money because they were poorly targeted, or subject to fraud, or both’ (p. 16).
The Self-Employment Income Support Scheme (SEISS) was designed as the self-employment equivalent of the furlough scheme: ‘self-employed recipients could keep trading and received a big grant even if they were not badly affected by Covid. Conversely, analysis has shown that the money is poorly targeted at those who are adversely affected by Covid’ (ibid).
It is anticipated that, for the Bounce Back Loan Scheme, £26 billion of the £80 billion worth of loans will never be paid back. Some of the businesses ‘receiving the loans are expected to default … because minimal checks have left the scheme open to fraudulent claims’ (p. 13). The NAO judges the fraud risk as ‘very high’, including the risk of multiple applications by one borrower, impersonation of businesses and links to organised crime.Footnote9
González-Pampillón et al. (Citation2021) report higher footfall (5–6 per cent) associated with recreational activities on days when the meal discount from the Eat Out to Help Out scheme was available. Over 160 million meals were claimed by the end of September at a cost to government of £849 million. However, ‘areas with a higher take-up [of Eat Out to Help Out] saw both … a notable increase in new COVID19 infection clusters within a week of the scheme starting, and again, a deceleration in infections within two weeks of the program ending’ (Fetzer Citation2020, p. 1).
5.3.1. Inequalities and Coronavirus
The full interactions between coronavirus, policy responses, and inequalities will take some time to be fully worked out and assessed. In this section some preliminary remarks are offered with specific reference to the ways in which the inequalities and disparities revealed by COVID-19 reflect and reinforce pre-existing inequalities.
5.4. Inequalities in Illness and Death
There have been significant disparities in illness and death rates. The largest disparity was found by age: among those disagnosed with COVID-19, people aged 80 or over were 70 times more likely to die than those under 40. The death rates have been higher in males than females (Public Health England Citation2020). The inequalities between areas of the country based on deprivation are illustrated in . The decile of areas with the highest index of multiple deprivation has COVID-19 related death rates (adjusted for age) of the order of 2–2.5 times the death rates of the least deprived areas. The degree of inequality revealed for COVID-19 related deaths tends to be somewhat greater than death from all causes.
Table 4. Age-standardised mortality rate per 100,000 population.
Public Health England (Citation2020) reported that the highest diagnoses and death rates are in mostly urban local authories. The death rates in London from COVID-19 were more than three times higher than those in the South West of England (with the lowest rate). The degree of inequality between regions is found to be much greater than the inequalities in all-cause mortality rates in earlier years. It has also been found that there was a particularly high increase (over previous years) in all causes of death among those born outside the UK and Ireland, those in a range of caring occupations, those driving passengers in road vehicles, those working as security guards and related occupations, and those in care homes.
The death rate has been higher for those in Black, Asian and Minority Ethnic (BAME) groups than in White ethnic groups: ‘These inequalities largely replicate existing inequalities in mortality rates in previous years, except for BAME groups, as mortality was previously higher in White ethnic groups’ (Public Health England Citation2020). Using a statistical model, the Office for National Statistics (Citation2020) found that, after adjusting for age and excluding care home residents, all ethnic groups other than Chinese females were at higher risk of dying from COVID-19 than the White ethnic population. The Runnymeade Trust (Citation2020) discussed in some detail the health inequalities between ethnic groups, stating that ‘the extra risk of death in minority ethnic groups is one of the starkest health inequalities in recent times’, and rejecting the view that comorbid diseases, such as diabetes, can explain such inequalities. Siddique (Citation2020) reported that, of those in intensive care in England, Wales and Northern Ireland in September, 33.9 per cent were not classified as White; they accounted for 35 per cent in April. Only 14 per cent of the population is classified as BAME.
Davillas and Jones (Citation2020) reported on the increase in psychological distress during the pandemic: although ‘the proportion of inequality explained by observed individual circumstances ha[d] decreased … [b]y April 2020, age and gender accounted for a larger share [of psychological distress than financial employment and housing conditions], through the impact of the pandemic on mental wellbeing among young people. Working in COVID-affected industries, household composition and parental occupation ha[d] also increased their association with the inequality in psychological distress.’
5.5. Employment and Earnings
Blundell et al. (Citation2020) found that most people in the bottom tenth of the earning distribution (apart from key workers in health and social care) are in sectors that have been forced to shut down, and 80 per cent are either in a shut-down sector or are unlikely to be able to do their job from home. This compares with only a quarter of the highest earning tenth. Young people and those of Pakistani, Bangladeshi or black ethnicity are also more affected than others in these respects.
Johnson et al. (Citation2021) reported that the COVID-19 crisis ‘exacerbated inequalities between the high- and low-paid and between graduates and non-graduates … . Non-graduates were far more likely than graduates to work in a locked-down sector and far less likely to be able to work from home.’ In the third quarter of 2020, there had been a 7 per cent reduction in the number of graduates but a 17 per cent reduction in the number of non-graduates doing any hours of paid work in a given week. The authors also found that the COVID-19 crisis particularly hit the self-employed and others in insecure and non-traditional forms of employment. The SEISS did not cover around 2 million people who had some self-employment income, nor a substantial additional number with incorporated businesses who took income in some combination of salary and dividends. As they remarked, this is an illustration of the difficulties faced by the state when establishing a safety net for those in non-traditional forms of employment.
Low-income households suffer from the reduction in income as they spend a high proportion of their budgets on necessities. In contrast, the rich have maintained their income but have been unable to spend on many of their usual recreational activities; however, ‘this “forced saving” will at least be available for them to spend later, and much of the spending that they have decreased is precisely what provided the livelihoods of those in shut-down sectors, typically on lower income’ (Blundell et al. Citation2020). ‘Forced saving’—declines in spending on goods and services that were substantially affected or shut down by lockdown—while significant across the income distribution, have been greater for higher income households:
Higher income groups appear to have accumulated more savings than in previous years during the crisis, with falling spending from forced saving outweighing income falls. In contrast, the poorest fifth have seen an average £170 per month decline in their bank balances between March and September (£1220 total and equivalent to 14% of pre-crisis income) relative to what we would expect in normal times, as income falls are not fully cancelled out by lower spending. This is likely to reflect both lower saving and higher debt. (Davenport et al. Citation2020, data refer to bank balance changes and not overall savings)
5.6. Education
According to Blundell et al. (Citation2020), the ‘school shutdowns are likely to accentuate the socio-economic divide in educational attainment’ because those schools with children from better-off families are more likely to provide learning activities that involve active engagement between teachers and students than schools attended by children from the most deprived families. Johnson et al. (Citation2021a, p. 3) reported that ‘pupils at private schools were twice as likely as state-school pupils to get daily online lessons during lockdown. Within the state sector, pupils from better-off homes were more likely to receive active support from schools and to have a better home learning environment’, including more space, bettter access to broadband and computer facilities, and availability of parents working from home to provide some assistance. Pupils from poorer areas and households were also more likely to miss days from school (ibid). Rose et al., (Citation2021) in their study of year 2 cohort children (aged 6–7), reported that they are ‘significantly behind’ where they should be in English and mathematics. On average, pupils were two months behind, with the gap between richest and poorest students being wider than in earlier years, at seven months for reading and mathematics.
6. After COVID-19
There are two obvious features of a post-pandemic world of particular relevance for the future conduct of fiscal policy, namely, a debt to GDP ratio considerably higher than prior to the pandemic and productive capacity smaller than it would have been through a combination of business failures and lower investment.Footnote10
The budget deficit in 2020/21 is forecast to be around 19 per cent of GDP (as compared with 2 per cent in 2019/20), and the public debt to GDP ratio to be around 105 per cent, as compared with a ratio prior to the global financial crisis of around 40 per cent. Much of the public debt is held by the Bank of England as a consequence of quantitative easing, though the counterpart of that is reserves held at the Bank of England by commercial banks on which interest is paid. The current level of interest rates means that the government is borrowing at negative real interest rates and the ratio of nominal interest payments to GDP will tend to decline as nominal GDP grows.
There have already been calls for the ‘debt issue’ to be addressed and debt reduced.Footnote11 It should first be noted that the budget deficit will tend to fall as economic activity revives and the fiscal measures to support employment and incomes are withdrawn. This would mean that the debt to GDP ratio could well fall: the condition being the deficit is less than the debt ratio multiplied by g/(1 + g), where g is the nominal growth rate. There will no doubt be appeals to the debt is a ‘burden on future generations’ perspective, even though it has been well-known for a very long time that government debt does not impose such burdens as the counterpart of that government debt is private sector wealth (assets). There will also be arguments that high levels of public debt are harmful for economic activity, particularly growth, invoking the now largely de-bunked work of Reinhart and Rogoff (Citation2010), who argued that a debt ratio of 90 per cent is crucial.Footnote12 There would be much more damage done to economic activity and to investment arising from attempts to specifically reduce the debt ratio over and above the fall in the debt ratio that will arise as the appropriate budget deficit declines.
It is important that no numerical target be plucked out of the air to determine the size of the budget deficit. Rather, the budget position needs to be set according to the economic conditions of the time and seeking to underpin full employment. There is no reason to specifically target a reduction in government debt (whether in absolute terms through a budget surplus or in relative terms).
During the coronavirus pandemic, investment has fallen substantially and businesses, particularly in retail, have closed. Unemployment is widely forecast to rise as more businesses close.
7. Concluding Comments
The UK has suffered badly during the COVID-19 pandemic and has the highest death rate in the world (amongst countries with more than 10 million inhabitants). The fall in GDP in the UK is amongst the highest too, as is the budget deficit. Marmot et al. (Citation2020), writing only of England, note the higher mortality rate and argue that ‘in addition to specific failures to control the pandemic it may relate to the policy decisions and socioeconomic conditions prior to the pandemic, that gave rise to England’s relatively poor state of health, pre-pandemic’ (p. 14). The policy responses have often been slow, especially in the first months of the pandemic. The Institute for Government identifies ‘a high number of [policy] U-turns, when ministers have reversed a previous decision’. Although changing policies as information and understanding change is inevitable, ‘many of these U-turns have happened after ministers have committed, unnecessarily, to one particular course of action that later proved unwise’. During 2020, the largest number of ‘ministerial directions’ in recent years was issued; that is, ‘formal instructions to officials that they should continue with a policy despite their concerns about its value for money or feasibility’ (Durrant et al. Citation2021, p. 4).
It can be readily recognised that dealing with COVID-19 was an exercise involving fundamental uncertainty: the nature of the virus and its effects, and the ways in which individuals would respond. In the face of fundamental uncertainty, confusion regarding how to respond, lack of preparedness, shifts in policy and so on is inevitable. However, the UK government had prepared a 2019 National Security Risk Assessment, which ‘is a comprehensive planning document that sets out the risks facing the UK—and what is needed to prepare for them … . Over 600 pages, it runs through dozens of potential threats—but an “influenza-type pandemic” is at the top of this worry list, as it has been for years’ (Hopkins Citation2020). One such scenario is as follows: ‘Up to 50% of the UK population may fall ill, with up to 20% of people off work during the peak weeks, causing a significant impact on business continuity. Critical national infrastructure may also be affected during peak periods. There would be a huge surge in demand for health and social care services’. (ibid).
However, ‘the results of previous exercises and the detailed assessments in the “2019 National Security Risk Assessment” were ignored or downgraded, and a key sub-group of the National Security Council that would otherwise have raised the alarm, the Threats, Hazards, Resilience and Contingency Committee, was actually closed down by Johnson as an unnecessary distraction from Brexit’ (Rogers Citation2020a, p. 3). It is, however, reasonable to argue (as with the global financial crisis) that the likelihood of a serious virus was (and for the future is) high, and, as with financial crises, historical precedents exist.
The macroeconomic responses in terms of supporting incomes and businesses and the provision of more resources for the health service and (to some degree) education were generally in the right direction, and amongst the largest in the world. Doubts regarding the effectiveness of those fiscal responses have been mentioned in the text. The major challenge will come as the pandemic (hopefully) comes to a close; that is, ensuring that fiscal policies support economic and social recovery and do not shift back to austerity and the masochism of ‘reducing the debt’. The ‘burden on future generations’ resulting from COVID-19 will not come from the scale of the national debt; rather, it will be from the damage to education, mental health, loss of family and friends and so on. Public expenditure must be directed to repairing those damages, and not exacerbating them by following a policy of austerity.
The failures of the ‘test and trace’ programmes highlighted the issue of using private contractors with limited experience in place of well-established, if under-resourced, public health professionals.
The shortcomings of the UK’s income support system were highlighted by the COVID-19 pandemic, with some emergency measures (such as a temporary raising of universal credit levels) but no development of long-term improvements to that system. The impacts of COVID-19 in terms of loss of income and employment and of health and life have followed the contours of existing inequalities in the UK: such losses have been experienced disproportionately by those on relatively low incomes, in more deprived regions, and ethnic minorities.
Rogers (Citation2020a, p. 4) posed the following question in relation to the UK: ‘what lies behind the abject COVID failure of a state supposedly better prepared than almost any other yet turning out to be a basket case?’ He indicated that there are many interlocking answers, many of which relate to a specific ideological position. But over and above the serial incompetence of many government ministers, it is the neoliberal outlook’s ‘deep distrust of local government, the public sector and intergovernmental cooperation, especially in the EU, and entrenched antagonism to trade unions and other aspects of labour relations’ that is to blame.
Disclosure Statement
No potential conflict of interest was reported by the author.
Notes
1 The first case reported in the UK was in January 2020, in York.
2 In general, the term coronavirus is used, although COVID-19 is also used, especially when quoting or referring to the work of others that uses that term.
3 See, for example, Calvert et al. (Citation2020), Conn et al. (Citation2020) for delays, etc., in UK government decision making in the early months of 2020.
4 This paragraph is based on PM Johnson’s statement on 9 March (Johnson Citation2020a).
5 See, for example, Calvert et al. (Citation2020), McTague (Citation2020), and Sinclair (Citation2020) on delays, missteps, etc., in the UK government’s responses to the pandemic.
6 This refers to a number of free market think tanks, including the Institute of Economic Affairs, Taxpayers’ Alliance, and the climate denial Global Warming Policy Foundation, which share the office address of 55 Tufton Street (and also a reputation for lack of transparency over sources of funds). See, for example, https://www.desmog.co.uk/55-tufton-street.
7 SAGE is the key body providing scientific advice to government.
8 Bright (Citation2020) provides further examples of contracts awarded to inexperienced companies and estimates that £190 million worth of PPE contracts were awarded to individuals with links to the Conservatives. Sikka (Citation2020) indicates the extent to which the contracts have been awarded without the use of competitive tendering and to businesses close to the Conservative Party.
9 See also, Thomas and Morris (Citation2020).
10 See Sawyer (Citation2021) for further discussion on deficits and debt after the pandemic.
11 For example, in a speech at the Conservative Party Conference, 5 October, the Chancellor of the Exchequer was reported to have vowed to ‘always balance the books’, despite increased spending in the wake of the Covid-19 pandemic. He also avowed that the Conservatives had a ‘sacred duty’ to ‘leave the public finances strong’ (www.bbc.co.uk/news/uk-politics-54419352).
12 Ash et al. (Citation2020) argued that there is ‘little evidence to suggest a subtantial, causal negative relationhip. We demonstrate that there is strong indication of a reverse causal relationship from GDP growth to public debt’ (p. 25). In Sawyer (Citation2017), I argued that there could well be elements of a relationship running from slow growth to high debt ratios.
References
- Ash, M., D. Basu, and A. Dube. 2020. ‘Public Debt and Growth: An Assessment of Key Findings on Causality and Thresholds.’ Political Economy Research Institute, Working Paper series, no. 433, re-issued April 2020.
- Bank of England. 2020a. ‘Monetary Policy Summary and Minutes of the Monetary Policy Committee Meeting Ending on 17 June 2020’.
- Bank of England. 2020b. ‘How has COVID Affected Household Savings?’ Bank Overground November 2020.
- Blundell, R., M. Costa Dias, R. Joyce, and X. Xu. 2020. COVID-19 and Inequalities. London: Institute for Fiscal Studies.
- Bradley, J., S. Gebrekidan, and A. McCann. 2020. ‘Waste, Negligence and Cronyism: Inside Britain’s Pandemic Spending.’ New York Times, December 17.
- Bright, S. 2020. ‘Government Awards £122 Million PPE Contract to One-Month-oOld-Firm’, Bylinetimes.
- Calver, T., and G. Pogrund. 2020. ‘Rugby Stars Dodge Testing Chaos Thanks to Randox Lab that Misses Targets for Public.’ Sunday Times, September 20.
- Calvert, J., G. Arbuthnott, and J. Leake. 2020. ‘Coronavirus: 38 Days when Brain Sleepwalked into Disaster.’ Sunday Times, April 18.
- Colegrave, S. 2020. ‘Boris Johnson’s Great Spaffometer.’ Bylinetimes, July 24. https://bylinetimes.com/2020/07/24/boris-johnsons-great-spaffometer/.
- Conn, D., and P. Geoghegan. 2020. ‘Revealed: Travel Agent Staff Running COVID-19 Track and Trace.’ Open Democracy, August 9.
- Conn, D., F. Lawrence, P. Lewis, S. Carrell, D. Pegg, H. Davies, and R. Evans. 2020. ‘Revealed the Inside Story of the UK’s Covid-19 Crisis.’ Guardian, April 29.
- Davenport, A., R. Joyce, I. Rasul, and T. Waters. 2020. ‘Spending and Saving During the COVID-19 Crisis: Evidence from Bank Account Data.’ IFS Briefing Note BN308.
- Davillas, A., and A. M. Jones. 2020. ‘The COVID-19 Pandemic has Increased and Broadened Inequality in Psychological Distress in the UK.’ VOX Portal, June 30.
- Department of Health and Social Care. 2020. The Government’s Approach to Test and Trace in England—Interim Report: Report by the Comptroller and Auditor General.
- Durrant, T., T. Pope, A. Lilly, B. Guerin, M. Shepheard, S. Nickson, J.-A. Hagen Schuller, E. Mullens-Burgess, and G. Dalton. 2021. Whitehall Monitor 2021. Institute for Government.
- Fetzer, T. 2020. ‘Subsidizing the Spread of COVID19: Evidence from the UK’s Eat-Out-to-Help-Out Scheme.’ University of Warwick, Department of Economics Paper No. 1310.
- González-Pampillón, N., G. Nunez-Chaim, and K. Ziegler. 2021. ‘Recovering from the First Covid-19 Lockdown: Economic Impacts of the UK’s Eat Out to Help Out Scheme.’ Centre for Economic Performance, COVID-19 Analysis Series No. 18.
- Hopkins, N. 2020. ‘Leaked Cabinet Office Briefing on UK Pandemic Threat-The Key Points.’ Guardian, April 24.
- IMF. 2021. Fiscal Monitor: Database of Country Fiscal Measures in Response to Pandemic. Washington: IMF.
- Johnson, B. 2020a. ‘Prime Minister’s Statement on Coronavirus (COVID-19): 9 March 2020.’ www.gov.uk/government/organisations/prime-ministers-office-10-downing-street.
- Johnson, B. 2020b. ‘Prime Minister’s Statement on Coronavirus (COVID-19): 12 March 2020.’ www.gov.uk/government/organisations/prime-ministers-office-10-downing-street.
- Johnson, B. 2020c. ‘Prime Minister’s Statement on Coronavirus (COVID-19): 16 March 2020.’ www.gov.uk/government/organisations/prime-ministers-office-10-downing-street.
- Johnson, B. 2020d. ‘Prime Minister’s Statement on Coronavirus (COVID-19): 18 March 2020.’ www.gov.uk/government/organisations/prime-ministers-office-10-downing-street.
- Johnson, P., R. Joyce, and L. Platt. 2021. The IFS Deaton Review of Inequalities: A New Year’s Message. Institute for Fiscal Studies.
- Marmot, M., J. Allen, P. Goldblatt, E. Herd, and J. Morrison. 2020. Build Back Fairer: The COVID-19 Marmot Review The Pandemic, Socioeconomic and Health Inequalities in England. London: Institute of Health Equity.
- McTague, T. 2020. ‘How the Pandemic Revealed Britain’s National Illness.’ The Atlantic, August 12.
- Office for National Statistics. 2020. ‘Updating Ethnic Contrasts in Deaths Involving the Coronavirus (COVID-19), England and Wales: Deaths Occurring 2 March to 28 July’.
- Pollock, A. M. 2020. ‘Track, Trace and the Myth of Private Sector Efficiency.’ Tribune, August 21. https://tribunemag.co.uk/2020/08/track-trace-and-the-myth-of-private-sector-efficiency.
- Public Accounts Committee. 2021. COVID-19: Government Procurement and Supply of Personal Protective Equipment. Forty-second Report of Session 2019-21, HC 928.
- Public Health England. 2020. Disparities in the Risk and Outcomes of COVID-19.
- Reinhart, C. M., and K. S. Rogoff. 2010. ‘Growth in a Time of Debt.’ American Economic Review 100 (2): 573–578.
- Rogers, P. 2020a. ‘Coronavirus Could Dethrone the Neoliberalism That’s Made the UK a Basket.’ Open Democracy, August 21.
- Rogers, P. 2020b. ‘Is it Time to Use the F-Word about Boris Johnson’s Disastrous Regime.’ Open Democracy, September 18.
- Rose, S., L. Twist, P. Lord, S. Rutt, K. Badr, C. Hope, and B. Styles. 2021. Impact of School Closures and Subsequent Support Strategies on Attainment and Socio-Emotional Wellbeing in Key Stage 1: Interim Paper 1, January 2021. National Foundation for Educational Research.
- Runnymeade Trust. 2020. ‘Ethnic Inequalities in COVID-19 are Playing Out Again—How Can we Stop Them?’
- Sawyer, M. 2017. ‘Lessons on Fiscal Policy after the Global Financial Crisis.’ In Economic Policies Since the Global Financial Crisis, edited by P. Arestis, and M. Sawyer. Houndsmill, Basingstoke: Palgrave Macmillan.
- Sawyer, M. 2021. ‘Keep Calm and Carry On: Responding to Higher Public Debt After the Pandemic.’ Academia Letters, Article 276.
- Siddique, H. 2020. ‘Black Britons Still Lack protection from Covid, Says Doctors’ Chief.’ Guardian, September 20.
- Sikka, P. 2020. ‘The Government is Using the Pandemic to Give Contracts to Cronies’ August 24 (https://leftfootforward.org/authors/prem-sikka/).
- Sikka, P. 2021. ‘Tories Waste Billions of Taxpayers’ Money.’ Chartist January 5.
- Sinclair, I. 2020. ‘“A National Scandal”: A Timeline of the UK Government’s Response to the Coronavirus Crisis.’ Medium.com.
- Sunak, R. 2020a. ‘Budget Speech’ (https://www.gov.uk/government/speeches/budget-speech-2020).
- Sunak, R. 2020b. ‘The Chancellor Rishi Sunak Provides an Updated Statement on Coronavirus’ 20 March (www.gov.uk/government/organisations/hm-treasury).
- Taylor, D. 2020. ‘Servo Wins Covid-19 Test-and-Trace Contract Despite £1m Fine.’ Guardian, June 6.
- Thomas, D., and S. Morris. 2020. ‘“A Giant Bonfire of Taxpayers’ Money”: Fraud and the UK Pandemic Loan Scheme.’ Financial Times, December 20.