
 ?Mathematical formulae have been encoded as MathML and are displayed in this HTML version using MathJax in order to improve their display. Uncheck the box to turn MathJax off. This feature requires Javascript. Click on a formula to zoom.
Abstract
Network abnormal traffic detection can monitor the network environment in real time by extracting and analysing network traffic characteristics, and plays an important role in network security protection. In order to solve the problems that the existing detection methods cannot fully learn the spatio-temporal characteristics of data, the classification accuracy is not high, and the detection time and accuracy are susceptible to the influence of redundant data in the sample. Thus, this paper proposes a network abnormal detection method (PCSS) integrating principal component analysis (PCA) and single-stage headless face detector algorithms (SSH). PCSS applies the PCA algorithm to the data preprocessing to eliminate the interference of redundant data. At the same time, PCSS also combines feature fusion and SSH to enhance the feature extraction of unclear features data, and effectively improve the detection speed and accuracy. Simulation experiments based on IDS2017 and IDS2012 data sets are carried out in this paper. Experimental results show that PCSS is obviously superior to other detection models in detection speed and accuracy, which provides a new method for efficiently detecting traffic attacks.
1. Introduction
In recent years, the Internet has been widely used in various fields of social production, affecting people's work and life. Network technology not only brings convenience to people, but also brings certain risks and challenges. Due to the openness of the Internet architecture, there are various new attacks against the vulnerabilities of network protocols and applications. As a new criminal means, some advanced network technologies are used by criminals, which poses a serious threat to social production and national security (S. Y. Ji et al., Citation2014).
The traffic generated by different network intrusion behaviours and users' normal behaviour is essentially different, and different network intrusion behaviours can be detected in theory (Marir et al., Citation2018). However, due to the complex topology of the network and the huge openness of the Internet, the network traffic data generated every day is not only large in scale but also high in dimension. As a result, only limited risk information can be detected by the traditional security monitoring methods, which cannot meet the requirements of attack and defence. In addition, the high-dimensional traffic data will increase the time complexity and spatial complexity of the security monitoring programme, causing “dimensional disaster”.
The traditional network abnormal traffic detection method mainly realises the abnormal monitoring of various indicators in the traffic by manually setting a fixed threshold. As the network environment is complex and changeable and new network attacks occur constantly, the threshold often needs to be adjusted according to the actual situation. The manually set threshold can no longer meet the needs of network protection and security, so the network abnormal traffic detection system must learn to set the threshold dynamically and autonomously. With the continuous development of deep learning, its ability of active learning has brought up new development opportunities for abnormal traffic detection. Many scholars began to introduce deep learning into network abnormal traffic detection (Cui et al., Citation2019). Deep learning can automatically learn various characteristics of traffic and classify traffic on this basis, so as to realise the detection of abnormal traffic and achieve surprising results. At present, applying deep learning to network abnormal traffic detection still faces many challenges. The high-dimensional traffic data brings great difficulties to the real-time detection of network abnormal traffic by using deep learning. In addition, the data imbalance leads to the traditional model prediction results that tend to those large amounts of data, resulting in inaccurate prediction accuracy. For high-dimensional data, principal component analysis (PCA) is used to reduce the dimension and improve the convergence speed of the model. Aiming at the data imbalance, feature fusion technology is introduced into the network model to fuse the low-level features and high-level features extracted from the data, to further improve the detection accuracy.
To solve some disadvantages of current deep learning methods, this paper proposes a new abnormal traffic detection model (PCSS). In this paper, PCA (Jin et al., Citation2008) is introduced into traffic data (Swarna Priya et al., Citation2020) preprocessing to reduce the dimension of high-dimensional data and obtain the key features of data. PCSS can fully learn the temporal and spatial features of data, and on this basis, carry out feature fusion. Moreover, the SSH framework in face detection is embedded into PCSS (Najibi et al., Citation2017), which enhances the extraction of semantic information in the data and further increases the receptive field.
The main contributions of this paper are as follows:
PCA is applied to the pre-processing of traffic data in this paper to reduce the dimension of high-dimensional data, remove the redundancy in the original data, extract the main features of data, and effectively reduce the data processing time.
The SSH model in the field of face detection is introduced into the network model designed in this paper, which enhances the receptive field, fully extracts the semantic information, and further strengthens the feature extraction of the data with no obvious features.
The PCSS model is verified on IDS2012 and IDS2017 datasets. The experimental results show that the PCSS model not only is fast and robust, but also can achieve a high recognition rate.
The rest of this paper is organised as follows. The second section reviews the related work in the field of network abnormal traffic detection. Then, the third section introduces the PCA data processing method and the PCSS network model, and the analyses of the experimental results are given in the fourth section. Finally, the fifth section concludes this paper.
2. Related work
This section gives a comprehensive overview and discussion of the related work, focusing on the development of network abnormal traffic detection methods, including data processing methods and network model design.
2.1. Data processing method
Effective data processing can enhance the characteristic information of data, which is conducive to the accuracy of network intrusion detection. Duque (Citation2015) introduced data cleaning into the field of traffic data processing earlier and solved the problem of data heterogeneity (W. Zhang et al., Citation2020) by converting the attributes of data sets into numerical data and storing them in a readable form. Experiments were carried out on the NSL-KDD dataset, and the accuracy was improved by using the K-mean algorithm to classify the processed data. In addition, the data imbalance (Sreeja, Citation2019) will also affect the detection accuracy of abnormal network traffic. Most standard algorithms assume that the class distribution is uniform or the standard error of the class distribution is within a controllable range. Therefore, when faced with complex unbalanced data sets, these algorithms cannot well represent the distribution characteristics of the data, resulting in low prediction accuracy of the algorithms. Some scholars by random sampling (Y. Li et al., Citation2021), random undersampling (Deng et al., Citation2020) technology to reduce the imbalance of data, a random sample from a few classes, select a random sample to replace, and the instance multiple copies of supplementary training data, so a single instance may be multiple-choice, easily lead to data fitting (D. Li et al., Citation2021), random owe sampling and random sampling instead. Undersampling randomly selects samples from most classes and removes samples from them, thus reducing the number of examples in most classes in the transformed data, but causing a large amount of data to be discarded (Liang, Long, et al., Citation2021), making the decision boundary between minority and majority instances more difficult to learn (H. Li et al., Citation2021), resulting in reduced classification performance.
Chawla et al. (Citation2002) proposed a synthetic minority class oversampling technique (smote) that generates synthetic examples by operating in the Feature Space. A few classes are oversampling obtained by interpolating multiple minority class instances (Deng, Shang, Cai, Zhao & Zhou, Citation2021), and randomly selecting neighbourhood domains from k-nearest neighbours based on the amount of oversampling required, thus effectively avoiding overfitting problems (Liang, Ning, et al., Citation2021). However, there are some problems in this method, there is certain blindness in SMOTE during the choice of nearest neighbours and it cannot overcome the data distribution problem of unbalanced data set, which is easy to cause the distribution marginalisation problem. Liang, Xiao, et al. (Citation2021) improved SMOTE technology and introduced it to the field of network anomaly traffic detection, preprocessing the original traffic data, and on this basis, proposes a feature selection method based on information gain (Deng, Shang, Cai, Zhao & Song, Citation2021), which constructs a simplified subset of features on the original traffic data set technically and further improves the quality of the training data set, but it takes a long time. J. Zhang et al. (Citation2020) combine genetic algorithms with feature selection on the former basis to further enhance feature selection, which effectively reduces data dimensionality, increases detection rates, and maintains a low false-positive rate.
2.2. Network abnormal traffic detection method
Anderson (Citation1980) first proposed the concept of network abnormal traffic detection in 1980, aiming at detecting illegal behaviours that damage hosts without interfering with network usage. With the continuous progress and development of science and technology, many methods (Q. Tian et al., Citation2020) are used for intrusion detection to detect attacks with good prediction accuracy and improve real-time prediction capabilities.
Julisch (Citation2003) initially used the network abnormal traffic detection method to detect abnormal attacks by clustering the traffic and then detecting abnormal traffic according to the manually set threshold (X. Chen et al., Citation2021), which achieved a certain effect. but the current network traffic data is too complex and it is difficult to set thresholds manually (Liang et al., Citation2020), so this method is less scalable. At present, mainly through supervised machine learning algorithms for network anomaly traffic detection (Han et al., Citation2020), such as support vector machine (SVM) (W. H. Chen et al., Citation2005), k-nearest neighbour (KNN) (S. Zhang et al., Citation2017), random forest (RF) (Paul et al., Citation2018), Naive Bayes (NB) (Murphy, Citation2006), artificial neural network (ANN) (Manzoor & Kumar, Citation2017), etc. The method based on machine learning is the most studied network anomaly traffic detection method, However, all network abnormal traffic detection methods based on machine learning need to manually extract the characteristics of traffic data to determine its type, which is time-consuming and laborious, with high false alarm rate and low attack traffic detection rate.
Deep learning (LeCun et al., Citation2015) has good adaptive, self-organising and generalisation abilities (H. Liu et al., Citation2021). Therefore, it can solve the problem that traditional machine learning requires the manual design of feature thresholds (Ioffe & Szegedy, Citation2015). Deep learning can make the detection system have higher detection efficiency, so it has been widely studied by scholars in recent years. He et al. (Citation2017) constructed an intrusion detection system based on a convolutional neural network (CNN) and applied a generative adversarial network to synthesise attack traces, which achieved certain effect, but had poor detection effect on high-dimensional data (Xiao et al., Citation2021). Y. Zhang, Chen, Guo, et al. (Citation2019) proposed a network abnormal traffic detection method combining CNN and LSTM, which can effectively model the feature information contained in the traffic data, so as to realise automatic extraction of the spatio-temporal features of the traffic data. However, there are some problems with the data processing methods and anomaly detection methods mentioned above (D'Angelo et al., Citation2021). First, data feature extraction is not sufficient enough to handle the traffic data generated by the current complex network environment (Han et al., Citation2021). Second, scholars focus on the final overall sorting metrics, ignoring each type of sorting metrics in abnormal dataset traffic (Ning et al., Citation2021). Third, both KDD data sets and NSL-KDD data sets are fixed and data feature dimensions are not high enough to adequately simulate real network traffic, and the selection of features on this basis is not reasonable. Fourth, many algorithms do not consider time costs, and while some mainstream anomaly traffic detection algorithms are able to increase detection time for unbalanced abnormal traffic data (H. Ji et al., Citation2021), they do not meet the requirements of big data calculations.
This paper designs a network model (PCSS) that can learn spatio-temporal features of traffic data and fuse the learned features. PCSS learns traffic data more fully.in addition, the PCSS integrated SSH in the field of face detection module, enhances the semantic information extraction, to further improve the classification efficiency and accuracy. Compared with the traditional work, the method proposed in this paper is less time-consuming, and has high detection accuracy and strong practical value.
3. Model and method
PCA is a data analysis method, mainly used to reduce the dimensionality of high-dimensional data, so as to obtain the main attributes of the data. In the original network traffic data, there are many duplicate or meaningless attributes for traffic detection, resulting in too high data dimension, slow training and low accuracy of the traditional network model. To solve this problem, this paper introduces the PCA algorithm into the field of traffic data processing to simplify the attributes without losing the meaning of the traffic data itself, remove noise and redundancy to obtain more typical information.
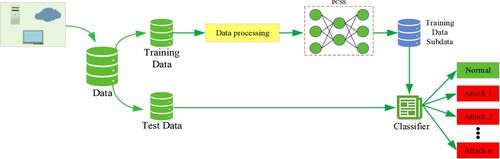
In this section, the network model PCSS is proposed and the overall process of a network abnormal traffic detection method integrating PCA and SSH are given, as shown in Figures and , respectively. Then, the data preprocessing method and how to use PCA to reduce the dimension of traffic data are introduced in detail.
Figure 1. The structure of PCSS.
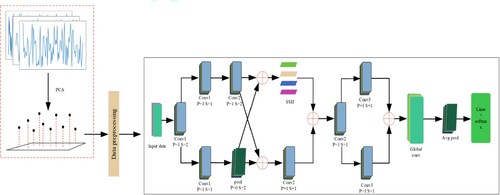
Figure 2. Overall system flow chart.
3.1. PCSS network model
In this subsection, the network model proposed is described and the related technologies are introduced in detail.
3.1.1. Overall model architecture
As shown in Figure , the data processed by the PCA algorithm is input into the network model PCSS, which is mainly composed of two parallel convolutional layers divided into three stages. Feature fusion is used to fuse the temporal and spatial features of traffic data. PCSS combines PCA algorithm with feature fusion technology to learn traffic data more fully and effectively solve the problem of data imbalance. The PCSS is mainly divided into two layers and three stages. In the first stage, the first layer and the second layer learn the attribute characteristics of traffic data from different aspects. In the process of learning, the characteristics of each layer are fused many times to strengthen the results of learning (Cui et al., Citation2020). The first layer consists of two convolution layers and an SSH module, in which the stripe and padding of the first convolution are set to 1, the padding of the second convolution is set to 1, and the stripe is set to 2. The SSH module was originally applied in the field of face detection and can use different detection and recognition methods for targets of different scales, where the ability of data classification can be enhanced (Xie et al., Citation2021). The second layer is composed of two convolution layers and a pool layer. The stripe and padding of the two convolution layers are set to 1, the padding of the pool layer is set to 0, and the stripe is set to 2. Then, the learning results of the first stage are fused through the feature fusion technology and input to the convolution layer of the second stage through the channel. The second stage is also a two-layer structure, each layer has a convolution layer, and the padding and stripe of the convolution layer are set to 1. In the second stage, the learning features are further combined. The third stage is a layer structure, which is composed of a global conv module, AVG pooling and a classification in FCN. This stage is mainly used to further extract the learning features. After three stages of learning, we can more fully learn the spatial characteristics of traffic. Figure is the overall workflow chart of the system. It mainly includes original data dimensionality reduction, data set preprocessing, network model training and abnormal traffic detection.
To reduce the model's complexity, the size of all convolution kernels in the PCSS network model is set to 3*3, in which the multilayer stacked 33 convolution kernels can also obtain the receptive field of equivalent larger convolution kernels. For the convolution operation, assuming that is the input feature mapping of the current layer and the convolution kernel
is 3*3, the current output feature
can be expressed as
(1)
(1) where
represents the offset term. In actual network traffic, the distribution of samples of different traffic types is quite different. In a highly imbalanced flow sample, the system can quickly identify the flow data category with a large sample size, but for data with a small sample size. There is often a problem of poor detection effect. The proposal of batch processing can solve the over-fitting problem well and speed up training by reducing the internal covariate shift of the input data, so as to quickly complete the convergence of the model. The introduction of batch standardisation (Ioffe & Szegedy, Citation2015) reduces the dimensionality of features and the imbalance of the network, and can better adapt to data with small sample sizes, by calculating the mean and variance of a small batch of samples, and then normalising the relevant data. The related process is as follows:
For n input samples, the average -band variance
of small batches is calculated, and then normalised according to the average value and variance ; the specific process is as follows:
(2)
(2)
(3)
(3)
(4)
(4) where
represents the average characteristic size of all samples in a small batch and
represents the variance of all samples in a small batch. Sample
obtains
by standardising
and
, and each input layer uses normalisation operation to make all input data obtain the same distribution without sample difference. To improve the stability of the network model, two learnable parameters are introduced to scale and shift the features and the model learns the original sample distribution to enhance the generalisation ability of different types of data.
(5)
(5) After the data perform batch normalise (BN), the nonlinearity is introduced through the activation function. To accelerate the convergence speed of the network and solve the influence of gradient explosion and gradient disappearance, all activation functions use the ReLU function. So the final output feature map is expressed as
(6)
(6) where g is the activation function. Each category is defined as follows:
(7)
(7)
3.1.2. SSH
SSH is a face detection algorithm and its main innovation lies in multi-scale detection, the introduction of more context information, and the grouping of loss functions. Its network model is shown in Figure , whose model structure is improved on the basis of VGG16. The SSH face detection algorithm, similar to YOLO (Y. Tian et al., Citation2019) and SSD (W. Liu et al., Citation2016), is performed directly from the first few convolutional layers of the classification network, which is different from the conventional two-stage face detection algorithm. Face detection is tested on the WIDER (Solt, Citation2016) data set. Compared with the ResNet101 network, it has fewer parameters, faster speed, and higher accuracy. It can be seen from the network model structure diagram that the SSH network model introduces different detection modules in the convolutional layers of different depths to detect faces of different scales.
Figure 3. SSH model.
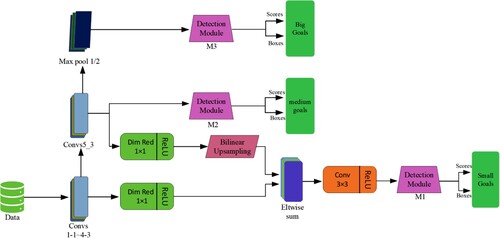
For targets of different scales, three detection modules with different structures are integrated into the network model. The detection module M3 is spliced in conv5-3 and added with a max-pooling layer, and the detection module M2 is directly spliced in conv5-3 convolution. After a max-pooling layer operation with a stride of 2, there is a difference between the detection module M3 and the detection module M2. The Max-pooling operation is used to increase the receptive field so that M3 can detect a face larger than M2. For the detection module M1, the features of conv4-3 and conv5-3 are fused to detect small-sized faces. To reduce the memory consumption, the number of channels is reduced from the original 512 dimensions to 128 dimensions through the dimension reduction of convolution operation, and the bilinear interpolation up-sampling operation is performed to increase the size of the feature map. Then carrying out the corresponding summation and finally splicing on the detection module M1 after passing through a
convolution layer. SSH combines three designed detection modules on three convolutional layer feature maps of different depths to detect small, medium, and large images of different scales. This article fuses SSH into PCSS, which can improve the learning ability of sample data of different sizes.
3.2. Data processing
Data processing mainly includes data preprocessing and dimensionality reduction of high-dimensional data using PCA.
3.2.1. Data preprocessing
The traffic data set in pcap format is used in this article. Since the data in the pcap file is stored in binary format, it needs to be preprocessed before it can be input into the network model for related training. Effective data processing can enhance the characteristic information in the data and improve the accuracy of the model to a certain extent. This paper proposes an original stream feature extraction method that can eliminate a large amount of zero data that is useless for feature learning. PCSS inherited and improved the methods provided by Y. Zhang, Chen, Jin, et al. (Citation2019), Y. Zhang, Chen, Guo, et al. (Citation2019) and M. Li et al. (Citation2021). First, the flow is divided by the ancestor, and the upper limit of the number of data packets that can be contained in each flow is set, and then the number of data flows contained in the attack flow is increased. Second, a certain number of data packets will be intercepted in the data stream. When the number of data packets is less than the number of interceptions, forward padding is used to facilitate short data streams. The relevant steps are as follows:
Step 1: Based on the five-tuple information, the tags provided by the dataset are compared with the original pcap file. All malicious traffic is extracted separately and stored in a csv file. This paper draws on the data processing method of Li et al. and makes improvements. This paper divides the continuous PCAP flow into multiple discrete flow units and extracts information from the discrete units that quote each flow information.
Step 2: Create several blank arrays to store the required data, and determine whether the data packet belongs to malicious traffic. If so, store the tuple, original data, and label in the corresponding location ; otherwise, it will not be processed. After completing the data traversal, store all malicious traffic in a csv file. For the extracted abnormal traffic, this article refers to the five-tuple information to divide the abnormal traffic into data streams. Only five data packets are extracted for each data stream. For a data stream with more than five packets, it is regarded as a new data stream.
Step 3: Clear interference information in network traffic data packets, eliminate duplicate data and empty files, and read all abnormal data streams. The data are converted from hexadecimal data to decimal, and the data stream is reduced according to the threshold value of the number and length of the data packet. The purpose is to obtain a file for each type of malicious traffic. For the length of the tailored packet, if the length is less than 96 bits, we will fill it with data 0 to 96 bits. If it is greater than 96 bits, we will subtract the extra part. If the number of packets in the network stream is less than 5, we are at the end of the stream. Fill the former data to 480 bytes instead of introducing 0 elements, which will make the data distribution more compact and reduce redundancy.
After completing the above steps, each network traffic contains five data packets, and each of which is distinguished by the hexadecimal number “FF”. The specific steps are shown in Algorithm 1.
3.2.2. Reduce dimensionality of high-dimensional data by PCA
The basic steps of the PCA data dimensionality reduction algorithm are as follows:
Normalise the original traffic data.
Select the complete data set at the initial stage. Suppose there is a matrix of size
that must be converted into an n-dimensional vector with the input data
Use the following equation to calculate the N-dimensional average vector:
Calculate the covariance:
Calculate the eigenvalues and eigenvectors of the matrix.
Sort the obtained eigenvectors according to the size of their corresponding eigenvalues, and then select n eigenvectors to form a
The newly obtained matrix M is used to transform the sample into a new space, that is, the formation process of principal components.
4. Experiment and result analysis
At the beginning of this chapter, the environment required for the experiment is introduced, including the hardware environment, software environment, and the data set used in the experiment. In addition, evaluation indicators used in the experiment and the parameters configuration during model training are also presented. In the last part of this chapter, a specific introduction to the experimental part is launched.
4.1. Experimental environment
The experimental environment is shown in Table .
Table 1. Experiment-related environment.
4.2. Hyperparameter settings
In PCSS, we fixed the size of the convolution kernel as 3*3. The batch size used by the model during training was 256, in which momentum was fixed at 0.9 and weight decay was set at to prevent overfitting and model falling into local optimum. We use CrossEntropyLoss function to continuously optimise model parameters and Adam optimiser to accelerate network convergence. Setting the learning rate too large or too small will affect the convergence of the model, resulting in the model missing the best point. Therefore, a total of 10 epochs are designed in this article. The learning rate setting of each epoch is shown in Table .
Table 2. Learning rate setting.
4.3. Evaluation indicators
This chapter mainly introduces the standards for evaluating the pros and cons of detection methods in abnormal network traffic detection. Among them, all evaluation indicators are obtained from the confusion matrix (Visa et al., Citation2011). In the confusion matrix, TP represents a positive sample predicted by the model as a positive class, TN represents a negative sample predicted by the model as a negative class, and FP represents a negative sample predicted by the model as a positive class, FN represents the positive samples predicted to be negative by the model, and the relevant evaluation indicators are as follows:
(11)
(11)
(12)
(12)
(13)
(13)
(14)
(14)
(15)
(15)
Precision represents the ratio of the predicted correct sample to all samples, Recall rate is a measure of coverage, in all positive cases, multiple positive cases are classified as positive cases, and false-positive rate is called the false-positive rate that refers to the percentage of negative samples being predicted incorrectly. Accuracy is called detection accuracy, which means that the correctly predicted sample is divided by all samples. F1_score is a weighted average of model accuracy and recall, with a maximum value of 1 and a minimum value of 0. For the above evaluation indicators, the accuracy rate, recall rate, and accuracy standards are all close to 1, indicating that the better the model is, the closer the false-positive rate is to 0.
4.4. Experimental results and analysis
In this subsection, three sets of experiments are designed to verify the performance of the network abnormal traffic detection method that combines PCA and SSH proposed in this paper. The ablation experiments are performed on the IDS2012 (Atli et al., Citation2018) and IDS2017 (Panigrahi & Borah, Citation2018) datasets, respectively. First, the feasibility of the PCA algorithm in the field of abnormal traffic detection and the superiority of the PCSS model combined with the PCA algorithm on IDS2012 compared to other methods are verified. And then, the superiority of the PCSS model is further verified on the IDS2017 data set.
4.4.1. Comparison of PCA dimensionality reduction experiments
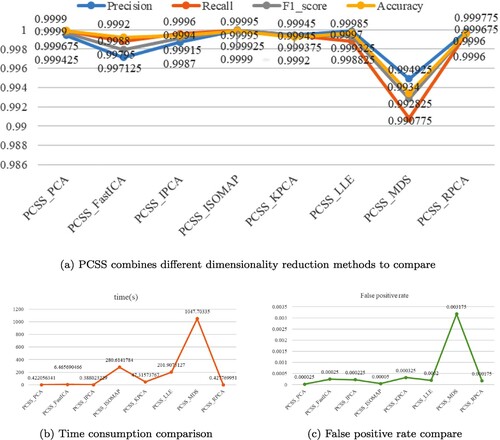
Currently, there are many dimensionality reduction methods. To verify the optimality of the PCSS network model combined with PCA, experiments are carried out on IDS2012 data set by combining PCSS with different dimensionality reduction methods, and the performance is evaluated through precision, recall and other evaluation indicators. From the experimental results in Figure , it can be drawn that the accuracy performance of PCSS combined with PCA and ISOMAP is much better than that of PCSS combined with other dimensionality reduction algorithms, but the time consumed by ISOMAP is much higher than that of the PCA algorithm, which further verifies the feasibility of PCSS network model combined with PCA.
Figure 4. PCSS combines different dimensionality reduction algorithms. (a) PCSS combines different dimensionality reduction methods to compare; (b) time consumption comparison and (c) false-positive rate comparison.
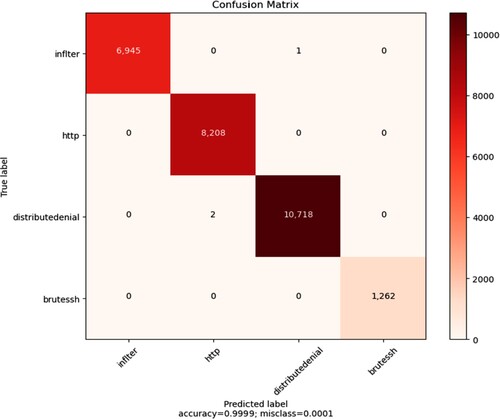
To understand the errors of the experimental results of the proposed network abnormal traffic detection algorithm combining PCA and SSH, the experimental results are made into the heat diagram shown in Figure . The diagonal numbers in Figure represent the number of correct predictions and the remaining numbers are the number of incorrect predictions. As can be seen from the figure, the method proposed in this paper has achieved a high detection success rate for the four kinds of abnormal flow detection in IDS2012 data set, and the prediction error is controlled at a very low level, which further verifies the superiority of the method proposed in this paper.
Figure 5. Heat map of experimental results.
4.4.2. IDS2012 data set experimental verification
To verify the ability of PCSS to detect abnormal network traffic in combination with PCA data dimensionality reduction, the proposed method is compared with other current abnormal network traffic detection methods on the IDS2012 data set. The specific experimental results are shown in Figures and . From the experimental results, it can be seen that the PCSS network model proposed in this paper achieves good results without adding the PCA algorithm, and is significantly better than CNN and CNN in the evaluation indexes such as precision and recall_LSTM and other detection methods, but they are basically the same as PCNN, DT and other detection methods. After adding the PCA algorithm, the method proposed in this paper is obviously better than other detection methods mentioned in this paper.
Figure 6. Experimental comparison of various abnormal traffic detection algorithms.
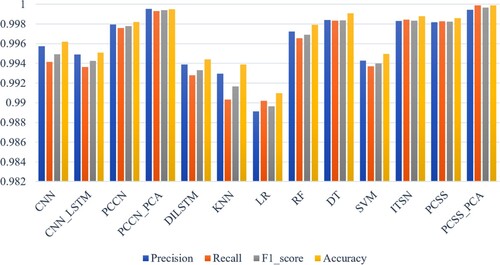
Figure 7. False-positive comparison of various anomaly detection algorithms.
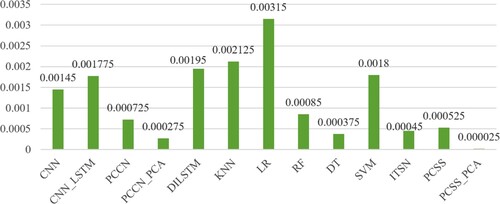
In order to verify the validity of the PCA algorithm, additional experiments are designed in this paper. This article restores the PCCN network model and then enters the data processed by the PCA algorithm into the model. It can be seen from Figures and that after training the data processed by PCA and PCNN have been significantly improved in various experimental evaluation indicators, which again verify the feasibility of PCA in the field of abnormal traffic detection.
4.4.3. Further comparative experiments
Since the IDS2012 data set only contains traffic data of four attack types, to further explore the detection performance of the proposed PCSS algorithm on unknown traffic types in a complex environment, further verification is carried out on the IDS2017 data set. The experimental results are shown in Tables – . It can be seen that the proposed method has the highest overall accuracy compared to other abnormal traffic detection methods. Compared with the ITSN network model, it has the highest overall accuracy on the IDS2017 data set. The detection accuracy of these several categories has reached a high level but the balance of detection is poor, while the detection accuracy of other categories needs to be improved. It can be seen from the experimental results that the PCSS network model combined with the PCA data dimensionality reduction method has a high detection accuracy for both a single class and the whole class. Furthermore, its evaluation indicators such as Precision, Recall rate, and F1_score have all achieved good experimental results.
Table 3. Precision comparison.
Table 4. Accuracy comparison.
5. Conclusion
This paper proposes a method for detecting abnormal network traffic that integrates PCA and SSH. The method first performs PCA dimensionality reduction on the original traffic data to obtain the necessary characteristics of the data to further reduce data redundancy, and then send the processed data to the combination of feature fusion and SSH. The proposed PCSS method achieves nearly 100% detection level on the data sets IDS 2012 and IDS 2017, and its performance is much higher than that of other comparative experiments. The experimental results show that the PCSS algorithm can resist data imbalance and can fully learn the inherent characteristics of network traffic data in fewer samples. The network abnormal traffic detection method proposed in this paper opens up a new idea for real-time protection of network security and plays a positive role in promoting the development of the network security industry.
Although the network abnormal traffic detection method that integrates PCA and SSH has an excellent performance in detecting abnormal network traffic, the current network is complex and changeable and new attack types are emerging in an endless stream. Owing to the implementation of the PCSS model which is based on a closed set protocol, it cannot meet the detection requirements of new network abnormal traffic and has poor scalability. It may even be incorrectly classified as a training data set. Considering the practical application significance of abnormal traffic detection, It is necessary to design a network model, which can automatically learn the new types of attacks in the network environment. In terms of resisting various types of cyberattacks, the PCSS model will be improved in the future to enhance its practical value and practical significance.
Table 5. F1_score comparison.
Table 6. Recall comparison.
Table 7. False-positive rate comparison.
Acknowledgments
In addition to the authors listed in the paper, Ming Li also contributed to the content studied in this paper and are gratefully acknowledged.
Disclosure statement
No potential conflict of interest was reported by the authors.
Additional information
Funding
References
- Anderson, J. P. (1980). Computer security threat monitoring and surveillance (Technical Report). James P. Anderson Company.
- Atli, B. G., Miche, Y., Kalliola, A., Oliver, I., Holtmanns, S., & Lendasse, A. (2018). Anomaly-based intrusion detection using extreme learning machine and aggregation of network traffic statistics in probability space. Cognitive Computation, 10(5), 848–863. https://doi.org/10.1007/s12559-018-9564-y
- Chawla, N. V., Bowyer, K. W., Hall, L. O., & Kegelmeyer, W. P. (2002). SMOTE: Synthetic minority over-sampling technique. Journal of Artificial Intelligence Research, 16(9), 321–357. https://doi.org/10.1613/jair.953
- Chen, W. H., Hsu, S. H., & Shen, H. P. (2005). Application of SVM and ANN for intrusion detection. Computers & Operations Research, 32(10), 2617–2634. https://doi.org/10.1016/j.cor.2004.03.019
- Chen, X., Liang, W., Xu, J., Wang, C., Li, K. C., & Qiu, M. (2021). An efficient service recommendation algorithm for cyber-physical-social systems. IEEE Transactions on Network Science and Engineering. https://doi.org/10.1109/TNSE.2021.3092204
- Cui, M., Han, D., & Wang, J. (2019). An efficient and safe road condition monitoring authentication scheme based on fog computing. IEEE Internet of Things Journal, 6(5), 9076–9084. https://doi.org/10.1109/JIoT.6488907
- Cui, M., Han, D., Wang, J., Li, K. C., & Chang, C. C. (2020). ARFV: An efficient shared data auditing scheme supporting revocation for fog-assisted vehicular ad-hoc networks. IEEE Transactions on Vehicular Technology, 69(12), 15815–15827. https://doi.org/10.1109/TVT.25
- D'Angelo, G., Palmieri, F., Robustelli, A., & Castiglione, A. (2021). Effective classification of android malware families through dynamic features and neural networks. Connection Science, 33(3), 786–801. https://doi.org/10.1080/09540091.2021.1889977
- Deng, W., Shang, S., Cai, X., Zhao, H., Song, Y., & Xu, J. (2021). An improved differential evolution algorithm and its application in optimization problem. Soft Computing, 25(7), 5277–5298. https://doi.org/10.1007/s00500-020-05527-x
- Deng, W., Shang, S., Cai, X., Zhao, H., Zhou, Y., Chen, H., & Deng, W. (2021). Quantum differential evolution with cooperative coevolution framework and hybrid mutation strategy for large scale optimization. Knowledge-Based Systems, 224(1), 107080. https://doi.org/10.1016/j.knosys.2021.107080
- Deng, W., Xu, J., Zhao, H., & Song, Y. (2020). A novel gate resource allocation method using improved PSO-based QEA. IEEE Transactions on Intelligent Transportation Systems, 23(3), 1737–1745. https://doi.org/10.1109/TITS.2020.3025796
- Duque, S. (2015). Using data mining algorithms for developing a model for intrusion detection system (IDS). Procedia Computer Science, 61(5), 46–51. https://doi.org/10.1016/j.procs.2015.09.145
- Han, D., Pan, N., & Li, K. C. (2020). A traceable and revocable ciphertext-policy attribute-based encryption scheme based on privacy protection. IEEE Transactions on Dependable and Secure Computing, 19(1), 316–327. https://doi.org/10.1109/TDSC.2020.2977646
- Han, D., Zhu, Y., Li, D., Liang, W., Souri, A., & Li, K. C. (2021). A blockchain-based auditable access control system for private data in service-centric IoT environments. IEEE Transactions on Industrial Informatics, 18(5), 3530–3540. https://doi.org/10.1109/TII.2021.3114621
- He, K., Gkioxari, G., Dollár, P., & Girshick, R. (2017). Mask r-cnn. In Proceedings of the IEEE International Conference on Computer Vision (pp. 2961–2969).
- Ioffe, S., & Szegedy, C. (2015). Batch normalization: Accelerating deep network training by reducing internal covariate shift. In International Conference on Machine Learning (pp. 448–456).
- Ji, H., Zhang, H., Shao, L., He, D., & Luo, M. (2021). An efficient attribute-based encryption scheme based on SM9 encryption algorithm for dispatching and control cloud. Connection Science, 33(4), 1094–1115. https://doi.org/10.1080/09540091.2020.1858757
- Ji, S. Y., Choi, S., & Jeong, D. H. (2014). Designing a two-level monitoring method to detect network abnormal behaviors. In Proceedings of the 2014 IEEE 15th International Conference on Information Reuse and Integration (IEEE IRI 2014) (pp. 703–709).
- Jin, X., Zhang, Y., Li, L., & Hu, J. (2008). Robust PCA-based abnormal traffic flow pattern isolation and loop detector fault detection. Tsinghua Science & Technology, 13(6), 829–835. https://doi.org/10.1016/S1007-0214(08)72208-9
- Julisch, K. (2003). Using root cause analysis to handle intrusion detection alarms [Unpublished doctoral dissertation]. Universität Dortmund.
- LeCun, Y., Bengio, Y., & Hinton, G. (2015). Deep learning. Nature, 521(7553), 436–444. https://doi.org/10.1038/nature14539
- Li, D., Han, D., Zheng, Z., Weng, T. H., Li, H., Liu, H., Castiglione, A., & Li, K. C. (2021). MOOCsChain: A blockchain-based secure storage and sharing scheme for MOOCs learning. Computer Standards & Interfaces, 81. https://doi.org/10.1016/j.csi.2021.103597
- Li, H., Han, D., & Tang, M. (2021). A privacy-preserving storage scheme for logistics data with assistance of blockchain. IEEE Internet of Things Journal, 9(6), 4704–4720. https://doi.org/10.1109/JIOT.2021.3107846.
- Li, M., Han, D., Yin, X., Liu, H., & Li, D. (2021). Design and implementation of an anomaly network traffic detection model integrating temporal and spatial features. Security and Communication Networks, 2021. https://doi.org/10.1155/2021/7045823
- Li, Y., Wang, X., Wang, W., Zhang, Z., Wang, J., Luo, X., & Xie, S. (2021). Learning adversarial policy in multiple scenes environment via multi-agent reinforcement learning. Connection Science, 33(3), 407–426. https://doi.org/10.1080/09540091.2020.1832961
- Liang, W., Long, J., Li, K. C., Xu, J., Ma, N., & Lei, X. (2021). A fast defogging image recognition algorithm based on bilateral hybrid filtering. ACM Transactions on Multimedia Computing, Communications, and Applications (TOMM), 17(2), 1–16. https://doi.org/10.1145/3391297
- Liang, W., Ning, Z., Xie, S., Hu, Y., Lu, S., & Zhang, D. (2021). Secure fusion approach for the internet of things in smart autonomous multi-robot systems. Information Sciences, 579(1), 468–482. https://doi.org/10.1016/j.ins.2021.08.035
- Liang, W., Xiao, L., Zhang, K., Tang, M., He, D., & Li, K. C. (2021). Data fusion approach for collaborative anomaly intrusion detection in blockchain-based systems. IEEE Internet of Things Journal, 1–1. https://doi.org/10.1109/JIOT.2021.3053842
- Liang, W., Zhang, D., Lei, X., Tang, M., Li, K. C., & Zomaya, A. (2020). Circuit copyright blockchain: Blockchain-based homomorphic encryption for IP circuit protection. IEEE Transactions on Emerging Topics in Computing, 9(3), 1410–1420. https://doi.org/10.1109/TETC.2020.2993032
- Liu, H., Han, D., & Li, D. (2021). Behavior analysis and blockchain based trust management in VANETs. Journal of Parallel and Distributed Computing, 151(2), 61–69. https://doi.org/10.1016/j.jpdc.2021.02.011
- Liu, W., Anguelov, D., Erhan, D., Szegedy, C., Reed, S., Fu, C. Y., & Berg, A. C. (2016). Ssd: Single shot multibox detector. In European Conference on Computer Vision (pp. 21–37).
- Manzoor, I., & Kumar, N. (2017). A feature reduced intrusion detection system using ANN classifier. Expert Systems with Applications, 88, 249–257. https://doi.org/10.1016/j.eswa.2017.07.005
- Marir, N., Wang, H., Feng, G., Li, B., & Jia, M. (2018). Distributed abnormal behavior detection approach based on deep belief network and ensemble SVM using spark. IEEE Access, 6, 59657–59671. https://doi.org/10.1109/ACCESS.2018.2875045.
- Murphy, K. P. (2006). Naive Bayes classifiers (Vol. 18(60), pp. 1–8). University of British Columbia.
- Najibi, M., Samangouei, P., Chellappa, R., & Davis, L. S. (2017). Ssh: Single stage headless face detector. In Proceedings of the IEEE International Conference on Computer Vision (pp. 4875–4884).
- Ning, Z., Shi, W., Xiao, L., Liang, W., & Weng, T. H. (2021). A novel approach for anti-pollution attacks in network coding. Connection Science, 33(3), 447–462. https://doi.org/10.1080/09540091.2020.1841109
- Panigrahi, R., & Borah, S. (2018). A detailed analysis of CICIDS2017 dataset for designing intrusion detection systems. International Journal of Engineering & Technology, 7(3.24), 479–482.
- Paul, A., Mukherjee, D. P., Das, P., Gangopadhyay, A., Chintha, A. R., & Kundu, S. (2018). Improved random forest for classification. IEEE Transactions on Image Processing, 27(8), 4012–4024. https://doi.org/10.1109/TIP.2018.2834830
- Solt, F. (2016). The standardized world income inequality database. Social Science Quarterly, 97(5), 1267–1281. https://doi.org/10.1111/ssqu.2016.97.issue-5
- Sreeja, N. (2019). A weighted pattern matching approach for classification of imbalanced data with a fireworks-based algorithm for feature selection. Connection Science, 31(2), 143–168. https://doi.org/10.1080/09540091.2018.1512558
- Swarna Priya, R. M., Maddikunta, P. K. R., Parimala, M., Koppu, S., Gadekallu, T. R., Chowdhary, C. L., & Alazab, M. (2020). An effective feature engineering for DNN using hybrid PCA-GWO for intrusion detection in IoMT architecture. Computer Communications, 160(6), 139–149. https://doi.org/10.1016/j.comcom.2020.05.048
- Tian, Q., Han, D., Li, K. C., Liu, X., Duan, L., & Castiglione, A. (2020). An intrusion detection approach based on improved deep belief network. Applied Intelligence, 50(10), 3162–3178. https://doi.org/10.1007/s10489-020-01694-4
- Tian, Y., Yang, G., Wang, Z., Wang, H., Li, E., & Liang, Z. (2019). Apple detection during different growth stages in orchards using the improved YOLO-V3 model. Computers and Electronics in Agriculture, 157, 417–426. https://doi.org/10.1016/j.compag.2019.01.012
- Visa, S., Ramsay, B., Ralescu, A. L., & Van Der Knaap, E. (2011). Confusion matrix-based feature selection. MAICS, 710, 120–127.
- Xiao, T., Han, D., He, J., Li, K. C., & de Mello, R. F. (2021). Multi-Keyword ranked search based on mapping set matching in cloud ciphertext storage system. Connection Science, 33(1), 95–112. https://doi.org/10.1080/09540091.2020.1753175
- Xie, Y. X., Ji, L. X., Li, L. S., Guo, Z., & Baker, T. (2021). An adaptive defense mechanism to prevent advanced persistent threats. Connection Science, 33(2), 359–379. https://doi.org/10.1080/09540091.2020.1832960
- Zhang, J., Zhang, Y., & Li, K. (2020). A Network intrusion detection model based on the combination of relieff and borderline-smote. In Proceedings of the 2020 4th High Performance Computing and Cluster Technologies Conference & 2020 3rd International Conference on Big Data and Artificial Intelligence (pp. 199–203).
- Zhang, S., Li, X., Zong, M., Zhu, X., & Cheng, D. (2017). Learning k for knn classification. ACM Transactions on Intelligent Systems and Technology (TIST), 8(3), 1–19. https://doi.org/10.1145/2990508
- Zhang, W., Han, D., Li, K. C., & Massetto, F. I. (2020). Wireless sensor network intrusion detection system based on MK-ELM. Soft Computing, 24(16), 12361–12374. https://doi.org/10.1007/s00500-020-04678-1
- Zhang, Y., Chen, X., Guo, D., Song, M., Teng, Y., & Wang, X. (2019). PCCN: Parallel cross convolutional neural network for abnormal network traffic flows detection in multi-class imbalanced network traffic flows. IEEE Access, 7, 119904–119916. https://doi.org/10.1109/Access.6287639
- Zhang, Y., Chen, X., Jin, L., Wang, X., & Guo, D. (2019). Network intrusion detection: Based on deep hierarchical network and original flow data. IEEE Access, 7, 37004–37016. https://doi.org/10.1109/ACCESS.2019.2905041.