
 ?Mathematical formulae have been encoded as MathML and are displayed in this HTML version using MathJax in order to improve their display. Uncheck the box to turn MathJax off. This feature requires Javascript. Click on a formula to zoom.
Abstract
Metro passenger flow prediction is an essential part of crowd flow forecasting and intelligent transportation management systems. However, two challenges still need to be addressed to achieve a more accurate prediction: (1) accounting for featural dependence instead of considering only the temporal connection and spatial relations; (2) utilising graph structures to address non-European relationships of spatial and featural dependence. To address these challenges, we developed a novel model called the multi-featured spatial-temporal (MFST) and dynamic multi-graph convolutional network (DMGCN) model. Temporal connections are learned from both the local and global information in a time-series sequence using the combination of a time-trend feature mapping block and a gated recurrent unit block. Spatial relation and featural dependence are separately captured by two DMGCN blocks. Each DMGCN block encodes various relationships by constructing multiple graphs consisting of predefined and non-defined topologies. The results of evaluations conducted of the MFST tensor and the DMGCN on the real-world Beijing subway dataset indicate that the prediction performance of the proposed model is superior to that of the existing baselines. The proposed model thus contributes significantly to the improvement of public safety by providing early warnings of large passenger flow and enabling the smart scheduling of resources.
1. Introduction
Owing to the increasing demand for smart cities, intelligent urban rail transit has always been an important area that needs to be highlighted. To date, metro has been one of the most popular means of transport. However, it has been susceptible to security issues due to massive crowds. Improving the effect and quality of passenger flow prediction provides is significantly aids in avoiding public safety accidents caused by the congestion. With the advances in artificial intelligence and the application of deep learning in multiple domains (Chang et al., Citation2021; Chen et al., Citation2021; LeCun et al., Citation2015; Samek et al., Citation2021), several researchers have focused on implementing an effective and accurate prediction of metro passenger flow (Liu et al., Citation2019; Wang et al., Citation2021; Zhang et al., Citation2021). However, despite years of research achievements, the dynamic capturing of various dependencies in the dimensions of time, space, and features remains a challenge in the accurate metro passenger flow prediction problem.
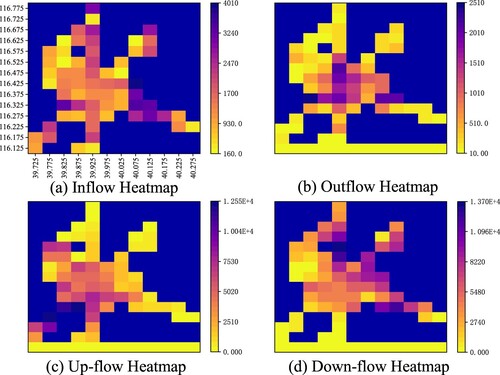
The featural dependence considerations are a vital challenge for accurate flow predictions, in addition to the temporal connections and spatial relations. As shown in , the metro passenger flow contains time, space, and feature variables. (a) shows the four flows at all stations recorded in a fixed time slice, and (b) shows the inflow at all stations recorded in a continuous period. The feature variables include the inflow, outflow, upstream section flow (up-flow), and downstream section flow (down-flow), as shown in . The heatmap in indicates the typical passengers who travel from the urban fringe (inflow) to the centre of the city (outflow) in the morning rush hour. The four flows are converted between themselves along with the changes in both space and time.
Figure 1. Visualisation of multi-featured spatial-temporal (MFST) tensor.
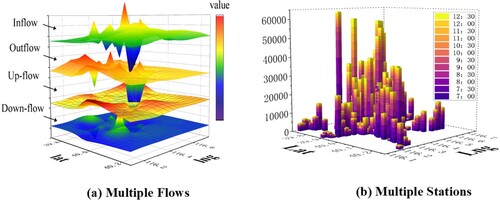
Figure 2. Heatmap visualisation of various flows. (a) Inflow, (b) outflow, (c) up-flow, and (d) down-flow recorded at 7:00 am on July 1st, 2019.
According to the elaboration provided, we simultaneously consider abundant relationships, including temporal connection, spatial relation, and featural dependence, implying that the raw input is deemed as a multi-featured spatial-temporal (MFST) tensor. In previous studies, the output is predicted by considering the inflow and outflow as inputs (Bai et al., Citation2021; Gong et al., Citation2022; Han et al., Citation2019). To achieve the same forecasting goal, our proposed method considers four types of flows. Further, the superior performance resulting from considering MFST tensors is demonstrated on a real-world dataset.
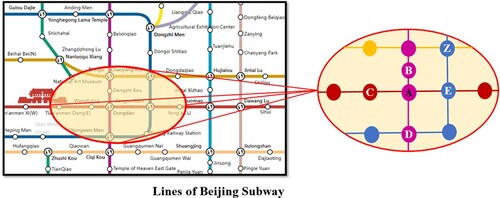
The following two examples are provided to explain the challenge of capturing the various relationships with graph structures. As shown in , the information regarding the Dongdan station represented by Vertex A is learned by considering its connected stations represented by Vertices B, C, D, and E. In the first case, Vertex A is linked with B, C, D, and E, implying that the information updated in A is only influenced by Vertices B, C, D, and E. Vertex A also receives the shift values from Vertex Z when the sampling time is long, which is ignored by the GCN approaches. In the second case, suppose that Vertex B possesses an adequate flow that is different from that in Vertex E; however, when computing the information update of Vertex A, both Vertices B and E share the same influential factor.
Figure 3. Relative vertices selected and their corresponding influence intensity for Vertex A.
To address the aforementioned two challenges, we propose a novel model known as MFST and DMGCN (MFST-DMGCN) to solve the accurate prediction tasks, where two DMGCN blocks including featural and spatial (F- and S-DMGCN) blocks are specifically designed to capture the spatial relation and featural dependence, respectively. A time-trend feature mapping (TF-M) block and a GRU block are proposed to obtain the local trend information and global contests in the time-series sequence. The outputs of MFST-DMGCN can provide data fundamentals for intelligent urban rail management, such as avoiding crowding accidents and enhancing metro operation efficiency.
The contributions of this work are as follows:
We view the metro passenger flow as an MFST tensor to consider multiple relationships regarding not only the temporal correction and spatial relations but also the featural dependence of the whole metro system.
TF-M and gated recurrent unit (GRU) blocks are employed to consider the temporal local context and global information, whereas the DMGCN block is designed to dynamically obtain the non-European spatial relation using multiple graphs, including a predefined and a non-defined topology aided by the self- attention mechanism.
To better express the featural dependence so that the internal interactions among features are clearer and more reasonable, four passenger flows are acquired and employed in this research: inflow, outflow, up-flow, and down-flow.
The results of experiments conducted using raw data from the Beijing subway verify that the proposed model achieves better prediction performance than the existing baseline models.
2. Related work
2.1. Metro passenger flow prediction
Urban metro development has gained substantial research attention recently (Hou et al., Citation2019; Li et al., Citation2020; Liu et al., Citation2021). Increased demand for accurate forecasting in practice leads to increased interest in metro passenger flow prediction (Gong et al., Citation2022; Zhang et al., Citation2020). The related work is reviewed in the following two sections.
2.1.1. Time-series analysis and machine learning methods
In recent decades, several time-series analysis methods have been proposed for passenger flow prediction, such as the autoregressive integrated moving average (ARIMA) model (Yinna et al., Citation2019) and the vector autoregression (VAR) model (Song et al., Citation2021). However, these statistical methods perform poorly because the practice metro passenger flow are numerous and nonlinear. Moreover, a group of machine learning approaches have been proposed, such as the support vector machines (SVM) model (Wang & Wang, Citation2015) and the genetic particle swarm optimisation SVM (GPSO- SVM) model (Mei et al., Citation2017). These approaches can compute nonlinear dependencies but express time consumption owing to heavily depend on high-quality feature engineering.
With the advances in artificial intelligence and the application of deep learning in multiple domains, such as speech recognition (Hinton et al., Citation2012), semantic image segmentation (Jiang et al., Citation2021) and sentiment classification (Cao et al., Citation2021), a new insight has been developed to address the crowd flow prediction problem (Han et al., Citation2019; Liu et al., Citation2019; Wang, Huang, et al., Citation2020). Metro passenger flow forecasting has been firstly deemed as a time-series prediction. The long short-term memory (LSTM) network and the GRU, as an improvement of the LSTM, have been exploited for prediction tasks (Cui et al., Citation2020; Hema & Kumar, Citation2021; Ji & Hou, Citation2017; Ma et al., Citation2015). However, these typical RNN-based approaches only consider temporal dependencies and fail to consider spatial relationships.
2.1.2. Deep learning methods in spatial-temporal prediction
With the performance improvements resulting from viewing the input data as a spatiotemporal sequence forecasting problem (Shi et al., Citation2015), a set of spatial- temporal deep learning approaches have been designed. Liu et al. (Citation2019) proposed an end-to-end LSTM-based architecture. Bai et al. (Citation2021) designed the A3T-GCN model to learn the short-time trend by using GRUs and learning the spatial dependence based on the GCN. Moreover, one-dimensional convolutional neural networks (1D-CNNs) have also been exploited to gather temporal connections in spatial-temporal prediction. Yu et al. (Citation2017) employed convolutional structures to capture the temporal dynamic behaviours. Guo et al. (Citation2019) utilised a CNN to exploit temporal dependencies from nearby times. However, restricted by the kernel size in convolution, these approaches are weak in capturing a long-term temporal sequence.
2.2. Utilising graph structures in non-European relationships
The GCN is excellent in aggregating the non-European information, that is widely utilised in several tasks, such as forecasting wind speed (Khodayar & Wang, Citation2019), exploring epidemics outbreak (La Gatta et al., Citation2021) and addressing recognition assignment (Wang et al., Citation2022). With the proposed spatial graph convolution methods (Zhang et al., Citation2021; Zhao et al., Citation2020), GCNs are being applied in passenger flow prediction to capture the spatial correlations. However, because the adjacency matrix in GCN is constantly, it is difficult for GCN methods to integrate rich topological information (Hu et al., Citation2022; Li et al., Citation2018; Wang, Zhu, et al., Citation2020). Multi-graph can capture the pairwise non-Euclidean correlations. For instance, the spatiotemporal DMGCN (ST-MGCN) designs to encode the complicated spatiotemporal dependencies into multiple graphs (Geng et al., Citation2019). However, the adjacency matrix in multi-graph is still constantly, the result is not good.
The attention mechanism can produce the influence intensity in graph structures based on the inputs (Qian et al., Citation2020). The attention-based spatial-temporal GCN (ASTGCN) model contains the spatial-temporal attention mechanism to capture the dynamic spatial-temporal correlations (Guo et al., Citation2019). The Graph WaveNet presents an adaptive dependency matrix to learn spatial dependency (Wu et al., Citation2019).
Motivated by these two extension approaches, we propose a DMGCN to consider richer non-European information by multi-graph and learn the influence intensity among graph structures via the self-attention mechanism.
3. Problem statement
3.1. Metro spatial network
A metro spatial network is defined as a graph describing the connection among all metro stations, where
denotes a set of vertices
in the metro space (N denotes the number of stations),
denotes two adjacent matrices, of which
is filled with values of “0” and “1” (“1” indicates an edge-bridging between two vertices, whereas “0” indicates no edge between the two vertices), and the value of
in matrix
ranges from “0” to “1” and signifies the strength of the edge that connects the vertices
and
.
3.2. Metro feature network
A metro feature network is defined as a graph describing the relationships among all the passenger flows, where
denotes a set of
vertices in metro features (
denotes the number of features in the metro flow),
are two adjacent matrices, of which
is filled with values of “0” and “1” (“1” indicates an edge-bridging between two vertices, and “0” indicates no edge between two vertices), and the value of
in matrix
ranges from “0” to “1” and signifies the strength of the edge that connects the vertices
and
.
3.3. MFST tensor
The MFST tensor contains three variables: time, space, and feature. These variables can be deemed as multiple observations of each station in all timestamps t, denoted as , where N represents the number of stations and
is the number of features.
3.4. Problem statement
MFST data are multidimensional tensors that contain time, space, and feature variables; however, both the spatial relation and the featural dependence are updated over time. Therefore, the passenger flow forecast in the metro is a time-series prediction problem.
Given a historical sequence of MFST tensors , the metro flow forecast task aims to predict a feature of all nodes in the subsequent
timestamps denoted as
. These values can be represented by the forecasting model
with parameter
, and the graph structures
and
are mapped from the data.
(1)
(1)
4. Methodology
4.1. Overview
Our proposed MFST-DMGCN model comprises TF-M, F-DMGCN, DMGCN, and GRU blocks. It addresses featural dependence, temporal connection, and spatial relation simultaneously. The highlight idea the proposed model is the design of the DMGCN block, which captures the various non-European relationships in MFST tensor. An overview framework of MFST-DMGCN is shown in , the detailed process is illustrated in four steps.
Figure 4. Architecture of the proposed MFST and dynamic multi-graph convolutional network (MFST-DMGCN) model.
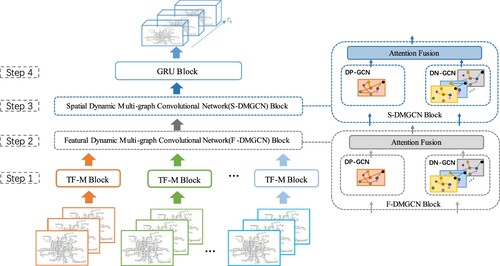
First, the raw tensors are divided into several groups according to the types of features. These groups are respectively put into different TF-M blocks to capture the local trend information in a time-series sequence. The results of different TF-M blocks are stacked to produce high-dimensional representative hidden states
, where
is the number of out channels in the TF-M blocks. Second, the hidden states are fed into the F-DMGCN block to dynamically capture the various feature relationships. Third, the result of F-DMGCN block
is fed into the S-DMGCN block to dynamically learn the relationships among space. Finally, the output of the S-DMGCN block
is fed into the GRU block to learn the temporal dependencies, and a final prediction result
is obtained. To ensure the effectiveness of this model, the residual connection and layer normalisation are added in all blocks.
4.2. TF-M block
Owing to considering the local trend in time series and mapping more information, we designated the TF-M block as the first step of the model. The following example that demonstrates the difference between a traditional mapping approach and our TF-M approach. (b) shows a continuous-time sequence in raw data; V1 and V2 are the same values in time C and F but present different time characteristic, i.e. a morning peak and an evening peak. (a) shows the different mapping results between the aforementioned two mapping approaches.
Figure 5. Difference between traditional and time-trend feature mapping (TF-M).
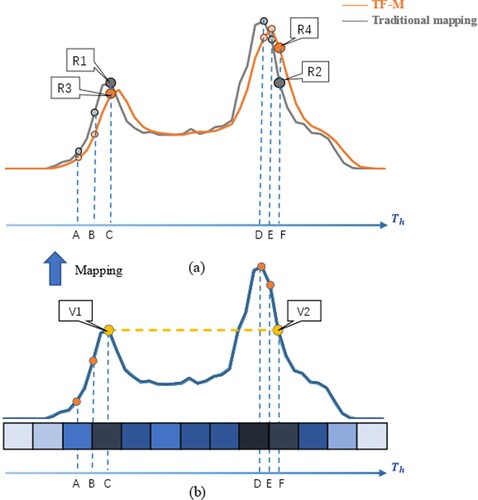
The traditional mapping approach do not consider the characteristic of time C and F. In contrast, the TF-M approach learns the characteristic by considering the influence of A and B on C and the impact of D and E on F, thus the mapping result presents a more realistic temporal situation.
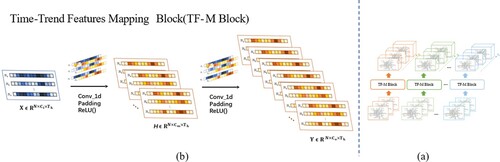
The details of the TF-M block are presented in . The raw input data are firstly divided into four groups based on the types of features and projected by four parallel TF-M blocks; the results of each block are stacked to create the output as shown in (a). (b) shows the entire process of each TF-M block, which consists of two 1D-CNN layers connected by an activation function . The input of each block
can be treated as the time sequence of each
channel, a sliding window is employed to aggregates the
neighbour moments in a time sequence. The convolution kernels in two layers are respectively
and
. The padding operation makes the input
, the hidden state
and the output
share the same length of time sequence
.
Figure 6. Diagram of TF-M blocks.
4.3. DMGCN block
This section illustrates the DMGCN block which is the mainstay of the F-DMGCN block and the S- DMGCN as the second and third step in the MFST- DMGCN model. The DMGCN block can be expressed by the following four aspects, the attention fusion, the dynamic predefined GCN (DP-GCN) layer, the dynamic non-defined GCN (DN-GCN) layer and the attention fusion.
The attention mechanism is excellent in picking relatively influential parameters of the current state through learning the weights among the queries with all keys (Guo et al., Citation2021; Vaswani et al., Citation2017). Self-attention is a particular part of the attention mechanism, whose characteristic is that the queries, keys, and values share the same dimension. The factor
is added to scale the dot product in the self-attention mechanism to effectively construct the global receptive field as shown in Equation (2) (Vaswani et al., Citation2017).
(2)
(2)
The DP-GCN layer is structured by a predefined graph topology that implies the connection between two relative vertices is fixed. Moreover, to capture the dynamic relative influence from the unchanged connections, the self-attention matrix are employed as shown in Equation (3), that denotes the dynamic relationship strength between each two vertices.
(3)
(3)
Then, an element-wise dot-product operation is used to bind the self-attention score matrix with the adjustment matrix A. In different networks, V has different meanings. In the metro feature network, V implies that the features are equivalent as F in the input , whereas in the metro spatial network, V implies that the stations are equal to N in the input
. The definition of the DP-GCN is as follows:
(4)
(4)
To capture the various relationships in both spatial connection and featural dependency, a DN-GCN layer is designed to adaptively learn the connection between each vertex in the entire network. The same input is used in this layer to calculate the weight matrix based on the self-attention mechanism, as follows:
(5)
(5)
The weight matrix
is utilised as an adjustment matrix to dynamically capture the connection between vertices in the entire network. The definition of DN-GCN is as follows:
(6)
(6)
This part is used to gather the outputs of the DP-GCN and DN-GCN layers to produce the output of the DMGCN block. Attention fusion is applied to dynamically integrate the results of the DP-GCN and DN-GCN layers; the definition of the output in the block is as follows:
(7)
(7)
where
separately donate the weight learned from the corresponding two outputs.
4.4. GRU block
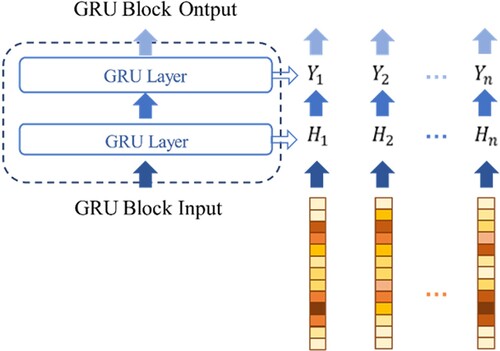
The GRU is an improvement of the LSTM network that is simpler to calculate and implement. It effectively learns the temporal dependence by memorising the history information of the entire time series. The GRU block is proposed as the fourth step of MFST-DMGCN to extract the global temporal features from the output of the previous block. The concrete functions of this block are defined in Equations (8)–(11). The complete structure and details of this block are presented in .
(8)
(8)
(9)
(9)
(10)
(10)
(11)
(11)
where
denotes the output at time
,
and
represent the update and reset gates at time t, respectively, and the output at time
is
. The weights and biases are represented by
and
in the operations, respectively.
Figure 7. Diagram of the gated recurrent unit (GRU) block.
5. Experiments
5.1. Dataset
The dataset comprises information about the passenger flows in the Beijing subway recorded at 30 min intervals in 301 subway stations. Four types of flows are measured in the data: inflow, outflow, up-flow, and down-flow, which signify the number of passengers entering the station, leaving the station, travelling in one direction, and travelling in the opposite direction, respectively. Considering the impact of the Covid-19 outbreak in 2020, the period of these flows was from July to December 2019. We selected the daily data from 6:00 am to 11:00 pm because the passenger flow is zero between 11:00 pm to 6:00 am for most of the stations. The weights on several input timesteps are learned and determined by the model itself. Therefore, the impacts of weekends on weekdays are considered in the model. The data we selected from July to October in 2019 contained 122 days as the training set, November in the same year contained 31 days as the validation set, whereas the last 30 days as the test set. Additionally, the data were transformed using Z-score normalisation to eliminate background correlations. Moreover, considering the correlation in the metro network, a 301 × 301 spatial adjacency matrix and a 4 × 4 feature adjacency matrix were constructed separately to capture the spatial connection and feature dependency.
5.2. Settings
To avoid the evaluation results being influenced by the magnitude of the data, the mean absolute error (MAE), root- mean-square error (RMSE), and symmetric mean absolute percentage error (SMAPE) and weighted mean absolute percentage error (WMAPE) were adopted in all experiments as the evaluation metrics. The definitions are as follows:
(12)
(12)
(13)
(13)
(14)
(14)
(15)
(15)
To make an equitable comparison in these experiments, the historical data over the past 6 h (12 steps) is utilise ed as the same inputs to predict passenger inflow among all stations for the next 30, 60, and 90 min, respectively.
5.3. Baseline models
To assess the performance of our model, six popular models widely used in the forecasting of passenger flow problems were selected as baseline models:
MLP (Karlaftis & Vlahogianni, Citation2011): Multi-layer perceptron, a widely utilised ANN model.
LSTM (Ma et al., Citation2015): Long Short-Term Memory network, a special RNN model.
GRU (Fu et al., Citation2016): Gated Recurrent Unit network, a special RNN model.
TGCN (Zhao et al., Citation2020): Temporal graph convolutional network, a combination with the graph convolutional network and the gated recurrent unit.
STGCN (Li et al., Citation2018): A spatial-temporal graph convolution model based on the spatial method.
ASTGCN (Guo et al., Citation2019): The spatial-temporal convolution and attention mechanism are employed to dynamically capture the spatial patterns and the temporal features.
Graph WaveNet (Wu et al., Citation2019): The combination of graph and temporal convolutions to adaptively capture spatial-temporal dependencies.
5.3.1. Results analysis
To present the prediction results, three time slices with different prediction intervals are selected, specifically, 30, 60, and 90 min as examples. The ground truth and predicted passenger inflow are plotted with red and green lines respectively in .
Figure 8. Visualisation of ground truth and predicted passenger inflow of the 301 stations at 7:00, 7:30, and 8:00 on Dec 1st, 2019.
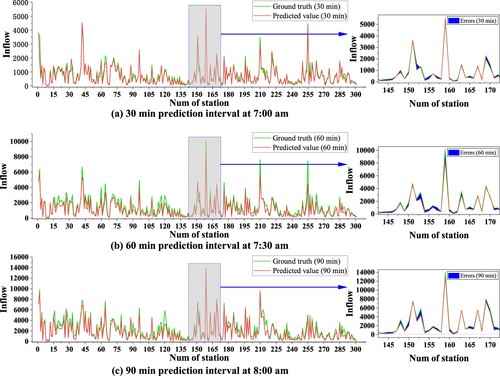
To illustrate the details more clearly, the results of thirty stations, from No. 135 to 165, were selected, and the errors between the ground truth and the prediction are drawn in blue in the enlarged graphs of . The results show that our proposed model achieved accurate predictions for the whole subway system during the next 30, 60, and 90 min. The temporal connections are well captured by the proposed MFST-DMGCN model.
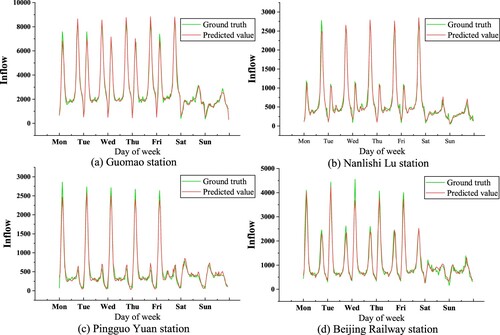
To show the prediction accuracy, four stations with different characteristics in space from December 2nd to 8th, 2019, were selected as examples with ground truth and prediction plotted using red and green lines, respectively in . Guomao station ((a)), Nanlishi Lu station ((b)), Pingguo Yuan station ((c)) and Beijing Railway station ((d)) containing different space characters are respectively selected. The prediction accuracies of the four stations are nearly identical, which indicates the spatial relationships are well learned by the MFST-DMGCN model.
Figure 9. Visualisation of ground truth and predicted passenger inflow of four stations in the first week of December 2019.
5.3.2. Comparisons with baseline models using different input data features
The feature that uses inflow as the only input data to predict the value of inflow was denoted “simple input” while the other using four types of flows containing the inflow, outflow, up-flow, and down-flow as the input data to complete the same prediction task was denoted “multiple inputs”. Tables and summarise separately the average performances of the above two results.
Table 1. Comparison of different models utilising multiple inputs.
Table 2. Comparison of different models utilising simple input.
We compare the improvements of MAE, RMSE, and SMAPE in different models by utilising simple input and multiple inputs in (g)–(i) together with Tables and . The results of utilising multiple inputs are mostly superior then applying simple input, which proves the advantages of considering featural dependence in metro passenger forecasting.
Figure 10. Performance of methods on two types of input data with increasing prediction interval.
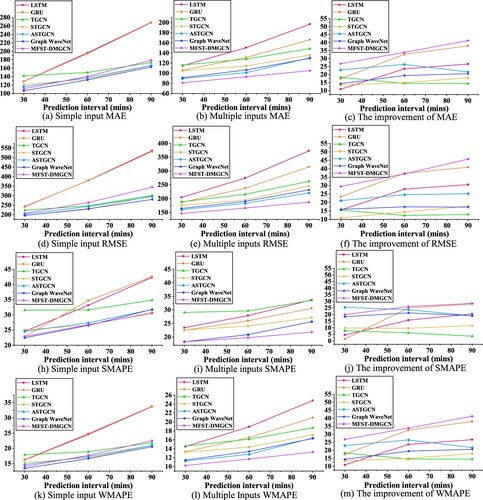
The results of the baseline models of MLP, LSTM, and GRU are less satisfactory than those of the others because of the lack of spatial relations and featural dependence considerations. The SMAPE and WMAPE results of STGCN perform better than the MLP, LSTM, and GRU in the 60- and 90-min durations particularly due to considering the spatial connections. However, they are less satisfactory than our proposed model. Finally, the SMAPE and WMAPE results of our model are slightly lower than the ASTGCN and Graph WaveNet because they fail to consider the effect of featural dependency. In general, the proposed MFST-DMGCN model achieves the best prediction performance specially in the 60- and 90-min durations.
5.3.3. Ablation experiments
Four variant versions of MFST-DMGCN were designed, with the same settings as MFST-DMGCN. The variants and corresponding differences are as follows: MFST-DMGCN -no-TF-M, MFST-DMGCN (no-F-DMGCN), MFST-DMGCN no-S-DMGCN and MFST-DMGCN (no-GRU).
The results are shown in and . The MFST-DMGCN (no-TF-M) model performed considerably worse than the MFST-DMGCN model, proving that the block is excellent in gathering local information along a temporal dimension. Moreover, MFST-DMGCN is separately improves on the MFST-DMGCN (no-F-DMGCN) and the MFST-DMGCN (no-S-DMGCN), which denotes the necessary of these two components. Comparing the result of MFST-DMGCN (no-S-DMGCN) with that of MFST-DMGCN (no-F- DMGCN) shows that the effect of employing DMGCN in the domination of space is superior to using it in the domination of feature. Additionally, MFST-DMGCN achieves a better performance than MFST-DMGCN (no-GRU), indicating that the GRU block compared with two fully connected layers performs more effectively, especially in the next 60- and 90-min predictions.
Figure 11. Ablation analysis of MFST-DMGCN.
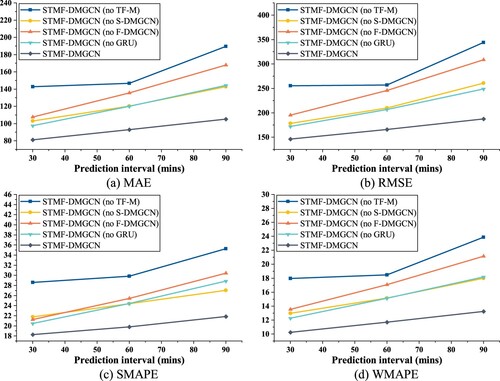
Table 3. Ablation experiment of MFST-DMGCN on multiple inputs.
6. Conclusion
In this study, we obtained a deep comprehension of metro passenger flow forecasting tasks that deem metro passenger flow as an MFST tensor to consider temporal connection, spatial relation, and featural dependence. Subsequently, we proposed a novel model, MFST-DMGCN, that can effectively and dynamically capture the various relationships of the MFST tensor. The output of our model predicts the arrival crowds in every station. It provides data to support in three aspects: station operation decisions, train schedule timetable adjustment, and early warning of heavy congestion. Through the spatial and temporal relations among stations, the forewarning of large passenger flow could be made not only to the congested station, but also to the nearby stations. Meanwhile, this model could promote public safety by providing scientific reference on unscheduled massive crowds, congestion transmission prediction, and emergency passenger crowd limitation and metro timetable adjustment.
The MFST-DMGCN model comprises a TF-M block that obtains the local trend information in a time-series sequence and provides sufficient expressive power. Two DMGCN blocks – F- and S-DMGCN blocks – are used to consider the predefined and non-defined topologies to dynamically capture the connection between space and feature based on a self-attention mechanism. Comparisons of the MFST-DMGCN model on a real-world Beijing subway dataset with existing baseline models were conducted. The results of comparisons utilising different types of input data and ablation experiments verify the feasibility and the superiority of the proposed model.
For the time dimension, a TF-M block and a GRU block are incorporated to deal with the prediction task with a time-series forecast. The predictions of multiple future periods (30, 60, and 90 min) can provide forewarning precaution to public safety systems with buffer time. For the space dimension, the prediction of metro passenger flow at the whole subway station offers a clearer understanding of the spatial distribution of the passengers so that the further planning of metro construction and resource allocation can be more reasonable for future urban constructions. For the feature dimension, this study innovatively added up-flow and down-flow features to reveal more detailed information regarding passengers’ travel behaviour. Indeed, busy metro stations are more possible to cause the occurrence of safety accidents. In future work, considering more external features such as the weather, pandemics, major holidays, accidents, or machine breakdowns could enable the model to make more accurate predictions. Replacing the GRU block with other approaches in the fourth step of the proposed model may also produce more accurate predictions. Further, some potential extensions could be trailed to handle other traffic domains such as the forecasting of highway traffic or bike-sharing demand predictions.
Disclosure statement
No potential conflict of interest was reported by the author(s).
Additional information
Funding
References
- Bai, J., Zhu, J., Song, Y., Zhao, L., Hou, Z., Du, R., & Li, H. (2021). A3T-GCN: Attention temporal graph convolutional network for traffic forecasting. ISPRS International Journal of Geo-Information, 10(7), 485–494. https://doi.org/10.3390/ijgi10070485
- Cao, Z., Zhou, Y., Yang, A., & Peng, S. (2021). Deep transfer learning mechanism for fine-grained cross-domain sentiment classification. Connection Science, 33(4), 911–928. https://doi.org/10.1080/09540091.2021.1912711
- Chang, F., Ge, L., Li, S., Wu, K., & Wang, Y. (2021). Self-adaptive spatial-temporal network based on heterogeneous data for air quality prediction. Connection Science, 33(3), 427–446. https://doi.org/10.1080/09540091.2020.1841095
- Chen, Y. F., Lin, Y. K., & Huang, C. F. (2021). Using deep neural networks to evaluate the system reliability of manufacturing networks. International Journal of Performability Engineering, 17(7), 600–608. https://doi.org/10.23940/ijpe.21.07.p4.600608
- Cui, Z., Ke, R., Pu, Z., & Wang, Y. (2020). Stacked bidirectional and unidirectional LSTM recurrent neural network for forecasting network-wide traffic state with missing values. Transportation Research Part C: Emerging Technologies, 118, 102674. https://doi.org/10.1016/j.trc.2020.102674
- Fu, R., Zhang, Z., & Li, L. (2016). Using LSTM and GRU neural network methods for traffic flow prediction. Proceeding of 2016 Youth Academic Annual Conference of Chinese Association of Automation (YAC) (pp. 324–328).
- Geng, X., Li, Y., Wang, L., Zhang, L., Yang, Q., Ye, J., & Liu, Y. (2019). Spatiotemporal multi-graph convolution network for ride-hailing demand forecasting. Proceedings of 2019 AAAI Conference on Artificial Intelligence (pp. 3656–3663). https://doi.org/10.1609/aaai.v33i01.33013656
- Guo, S., Lin, Y., Feng, N., Song, C., & Wan, H. (2019). Attention based spatial-temporal graph convolutional networks for traffic flow forecasting. Proceedings of 2019 AAAI Conference on Artificial Intelligence (pp. 922–929). https://doi.org/10.1016/j.dcan.2021.09.007
- Guo, S., Lin, Y., Wan, H., Li, X., & Cong, G. (2021). Learning dynamics and heterogeneity of spatial-temporal graph data for traffic forecasting. IEEE Transactions on Knowledge and Data Engineering. https://doi.org/10.1109/TKDE.2021.3056502
- Gong, Y., Li, Z., Zhang, J., Liu, W., & Zheng, Y. (2022). Online spatio-temporal crowd flow distribution prediction for complex metro system. IEEE Transactions on Knowledge and Data Engineering, 34(2), 865–880. https://doi.org/10.1109/TKDE.2020.2985952
- Han, Y., Wang, S., Ren, Y., Wang, C., Gao, P., & Chen, G. (2019). Predicting station-level short-term passenger flow in a citywide metro network using spatiotemporal graph convolutional neural networks. ISPRS International Journal of Geo-Information, 8(6), 243–267. https://doi.org/10.3390/ijgi8060243
- Hema, D., & Kumar, K. A. (2021). An optimized intelligent driver’s aggressive behaviour prediction model using GA-LSTM. International Journal of Performability Engineering, 17(10), 880–888. https://doi.org/10.23940/ijpe.21.10.p6.880888
- Hinton, G., Deng, L., Yu, D., Dahl, G. E., Mohamed, A., Jaitly, N., Senior, A., Vanhoucke, V., Nguyen, P., Sainath, T. N., & Kingsbury, B. (2012). Deep neural networks for acoustic modeling in speech recognition: The shared views of four research groups. IEEE Signal Processing Magazine, 29(6), 82–97. https://doi.org/10.1109/MSP.2012.2205597
- Hou, Z., Dong, H., Gao, S., Nicholson, G., Chen, L., & Roberts, C. (2019). Energy-saving metro train timetable rescheduling model considering ato profiles and dynamic passenger flow. IEEE Transactions on Intelligent Transportation Systems, 20(7), 2774–2785. https://doi.org/10.1109/TITS.2019.2906483
- Hu, N., Zhang, D., Xie, K., Liang, W., & Hsieh, M.-Y. (2022). Graph learning-based spatial-temporal graph convolutional neural networks for traffic forecasting. Connection Science, 34(1), 429–448. https://doi.org/10.1080/09540091.2021.2006607
- Ji, J., & Hou, J. (2017). Forecast on bus trip demand based on arima models and gated recurrent unit neural networks. Proceedings of 2017 International Conference on Computer Systems, Electronics and Control (pp. 105–108). https://doi.org/10.1109/ICCSEC.2017.8446813
- Jiang, D., Qu, H., Zhao, J., Zhao, J., & Hsieh, M.-Y. (2021). Aggregating multi-scale contextual features from multiple stages for semantic image segmentation. Connection Science, 33(3), 605–622. https://doi.org/10.1080/09540091.2020.1862059
- Karlaftis, M. G., & Vlahogianni, E. I. (2011). Statistical methods versus neural networks in transportation research: Differences, similarities, and some insights. Transportation Research Part C: Emerging Technologies, 19(3), 387–399. https://doi.org/10.1016/j.trc.2010.10.004
- Khodayar, M., & Wang, J. (2019). Spatio-temporal graph deep neural network for short-term wind speed forecasting. IEEE Transactions on Sustainable Energy, 10(2), 670–681. https://doi.org/10.1109/TSTE.2018.2844102
- La Gatta, V., Moscato, V., Postiglione, M., & Sperli, G. (2021). An epidemiological neural network exploiting dynamic graph structured data applied to the covid-19 outbreak. IEEE Transactions on Big Data, 7(1), 45–55. https://doi.org/10.1109/TBDATA.2020.3032755
- LeCun, Y., Bengio, Y., & Hinton, G. (2015). Deep learning. Nature, 521(7553), 436–444. https://doi.org/10.1038/nature14539
- Li, C., Cui, Z., Zheng, W., Xu, C., & Yang, J. (2018). Spatio-temporal graph convolution for skeleton based action recognition. Proceedings of 2018 AAAI Conference on Artificial Intelligence (pp. 3482–3489). https://arxiv.org/abs/1801.07455v2
- Li, Z., Yang, J., Yao, D., Wang, J., & Pang, Q. (2020). Reliability analysis of a metro braking control system based on fuzzy go method. International Journal of Performability Engineering, 16(11), 1826–1834. https://doi.org/10.23940/ijpe.20.11.p14.18261834
- Liu, Q., Guo, Q., Wang, W., Zhang, Y., & Kang, Q. (2021). An automatic detection algorithm of metro passenger boarding and alighting based on deep learning and optical flow. IEEE Transactions on Instrumentation and Measurement, 70, 1–13. https://doi.org/10.1109/TIM.2021.3054627
- Liu, Y., Liu, Z., & Jia, R. (2019). DeepPF: A deep learning based architecture for metro passenger flow prediction. Transportation Research Part C: Emerging Technologies, 101, 18–34. https://doi.org/10.1016/j.trc.2019.01.027
- Ma, X., Tao, Z., Wang, Y., Yu, H., & Wang, Y. (2015). Long short-term memory neural network for traffic speed prediction using remote microwave sensor data. Transportation Research Part C: Emerging Technologies, 54, 187–197. https://doi.org/10.1016/j.trc.2015.03.014
- Mei, D., Yan, Q., Gao, L., & Xu, E. (2017). A short-term traffic flow prediction model based on EMD and GPSO-SVM. Proceeding of 2017 IEEE Advanced Information Technology, Electronic and Automation Control Conference (pp. 2554–2558).
- Qian, T., Wang, F., Xu, Y.-J., Jiang, Y., Sun, T., & Yu, Y. (2020). CABIN: A novel cooperative attention based location prediction network using internal-external trajectory dependencies. Proceedings of the 29th International Conference on Artificial Neural Networks (pp. 521–532). https://doi.org/10.1007/978-3-030-61616-8-42
- Samek, W., Montavon, G., Lapuschkin, S., Anders, C. J., & Mueller, K.-R. (2021). Explaining deep neural networks and beyond: A review of methods and applications. Proceedings of the IEEE, 109(3), 247–278. https://doi.org/10.1109/JPROC.2021.3060483
- Shi, X., Chen, Z., Wang, H., Yeung, D.-Y., Wong, W. K., & Woo, W.-C. (2015). Convolutional LSTM network: A machine learning approach for precipitation nowcasting. Proceedings of 2015 Conference and Workshop on Neural Information Processing Systems (pp. 802–810). https://arxiv.org/abs/1506.04214
- Song, X., Guo, Y., Li, N., & Zhang, L. (2021). Online traffic flow prediction for edge computing-enhanced autonomous and connected vehicles. IEEE Transactions on Vehicular Technology, 70(3), 2101–2111. https://doi.org/10.1109/TVT.2021.3057109
- Vaswani, A., Shazeer, N., Parmar, N., Uszkoreit, J., Jones, L., Gomez, A. N., Kaiser, Ł, & Polosukhin, I. (2017). Attention is all you need. Proceedings of the 31st International Conference on Neural Information Processing Systems (pp. 5998–6008). https://arxiv.org/abs/1706.03762
- Wang, H. Y., & Wang, Y. Z. (2015). Vessel traffic flow forecasting with the combined model based on support vector machine. Proceedings of 2015 International Conference on Transportation Information and Safety (pp. 695–698). https://doi.org/10.1109/ICTIS.2015.7232151
- Wang, J., Zhang, Y., Wei, Y., Hu, Y., Piao, X., & Yin, B. (2021). Metro passenger flow prediction via dynamic hypergraph convolution networks. IEEE Transactions on Intelligent Transportation Systems, 22(12), 7891–7903. https://doi.org/10.1109/TITS.2021.3072743
- Wang, L., Chen, J., Chen, Z., Liu, Y., & Yang, H. (2022). Multi-stream part-fused graph convolutional networks for skeleton-based gait recognition. Connection Science, 34(1), 652–669. https://doi.org/10.1080/09540091.2022.2026294
- Wang, X. P., Huang, L., Huang, H., Li, B., Xia, Z., & Li, J. (2020). An ensemble learning model for short-term passenger flow prediction. Complexity, 2020, 6694186. https://doi.org/10.1155/2020/6694186
- Wang, X., Zhu, M., Bo, D., Cui, P., Shi, C., & Pei, J. (2020). AM-GCN: Adaptive multi-channel graph convolutional networks. Proceedings of the 26th ACM SIGKDD International Conference on Knowledge Discovery & Data Mining (pp. 1243–1253). https://doi.org/10.1145/3394486.3403177
- Wu, Z., Pan, S., Long, G., Jiang, J., & Zhang, C. (2019). Graph wavenet for deep spatial-temporal graph modeling. Proceedings of the 28th International Joint Conference on Artificial Intelligence (pp. 1907–1913). https://doi.org/10.24963/ijcai.2019/264
- Yinna, Y., Li, C., & Feng, X. (2019). Passenger flow prediction in bus transportation system using AMIRA models with big data. Proceedings of 2019 International Conference on Cyber-Enabled Distributed Computing and Knowledge Discovery (pp. 436–443). https://doi.org/10.1109/CyberC.2019.00081
- Yu, B., Yin, H., & Zhu, Z. (2017). Spatio-temporal graph convolutional networks: A deep learning framework for traffic forecasting. Proceedings of the 27th International Joint Conference on Artificial Intelligence (pp. 3634–3640). https://doi.org/10.24963/ijcai.2018/505
- Zhang, J., Che, H., Chen, F., Ma, W., & He, Z. (2021). Short-term origin-destination demand prediction in urban rail transit systems: A channel-wise attentive split-convolutional neural network method. Transportation Research Part C: Emerging Technologies, 124, 102928. https://doi.org/10.1016/j.trc.2020.102928
- Zhang, J., Chen, F., Guo, Y., & Li, X. (2020). Multi-graph convolutional network for short-term passenger flow forecasting in urban rail transit. IEEE Transactions on Intelligent Transportation Systems, 14(10), 1210–1217. https://doi.org/10.1049/iet-its.2019.0873
- Zhao, L., Song, Y., Zhang, C., Liu, Y., Wang, P., Lin, T., Deng, M., & Li, H. (2020). T-GCN: A temporal graph convolutional network for traffic prediction. IEEE Transactions on Intelligent Transportation Systems, 21(9), 3848–3858. https://doi.org/10.1109/TITS.2019.2935152