
 ?Mathematical formulae have been encoded as MathML and are displayed in this HTML version using MathJax in order to improve their display. Uncheck the box to turn MathJax off. This feature requires Javascript. Click on a formula to zoom.
Abstract
Owing to saturated markets, fierce competition, dynamic criteria, along with introduction of new attractive offers, the considerable issue of customer churn was faced by the telecommunication industry. Thus, an efficient Churn Prediction (CP) model is required for monitoring customer churn. Therefore, this work proposes a novel framework to predict customer churn through a deep learning model namely Swish Recurrent Neural Network (S-RNN). Finally, SRNN is adapted to classify the Churn Customer (CC) and a normal customer. If the result is a churn customer, network utilisation history is analysed for retention process. Whereas, the number of churn customers based on the area network usage is not recognised in this frameworkOwing to saturated markets, fierce competition, dynamic criteria, along with introduction of new attractive offers, the considerable issue of customer churn was faced by the telecommunication industry. Thus, an efficient Churn Prediction (CP) model is required for monitoring customer churn. Therefore, this work proposes a novel framework to predict customer churn through a deep learning model namely Swish Recurrent Neural Network (S-RNN). Finally, S-RNN is adapted to classify the Churn Customer (CC) and a normal customer. If the result is a churn customer, network utilisation history is analysed for retention process.
1. Introduction
The development of social media technology provides an excellent opportunity for companies to communicate with customers or potential customers (Dai & Wang, Citation2021). Multiple perceptions in the number of mobile phone clients were observed during previous years. Especially for big cities, the saturation stage is seen in the telecommunication market. Many mobile telecommunication companies face extremely challenging business environments because the market is already saturated. Since numerous customers are exchanging their registered services betwixt competing companies, the mobile telecommunication industry is becoming progressively more saturated (Alboukaey et al., Citation2020). To provide unwavering data along with voice coverage jointly in urban and rural areas, immense competition among telecom service providers has occurred as a result of the digital explosion. At various echelons, satisfying customer necessities are in great urge for service providers (Sridhar et al., Citation2020). To investigate efficient devices data/voice transmission, enhancing QoS in communication systems has unlocked (Meeravali et al., Citation2021). There was a realisation by the company that the marketing efforts’ focus ought to be given to customer retention instead of customer acquisition since retaining clients is less cost-effective together with more profitable than joining fresh subscribers (Vafeiadis et al., Citation2015). In reality, the profit will be very less for the network providers to attract new customers than to avert the current customers from quitting (Lu et al., Citation2014). Therefore, so as to identify those customers, who are most probably going to leave or churn, the network providers are increasingly engaged in constructing predictive models. A churner is defined as the customer who closes the existing provider’s subscription and makes another new subscribing. Owing to CC, a huge loss occurs in telecommunication system along with becoming a serious concern (Huang, Kechadi, et al., Citation2010; Amin et al., 2020). Unlike post-paid customers, pre-paid customers aren’t bound to a service provider, bad network connections together with the network packages’ cost are the reason for the customers churning (De Caigny et al., Citation2018). The overall reputation of a company was impacted by the Churning. It resulted in its brand loss as well as affected the companies’ profits (Huang & Kechadi, Citation2013). So as to keep their clients, organisations need a profound comprehension of why beat occurs (Kumar et al., Citation2019). For those clients who are ready to quit utilising an item or management, anticipating the client is held by churn analysis. Additionally, the information centred mining project that removes the potential outcomes are named client churn investigation (Geervani & Sandeep, Citation2019).
Therefore, one amongst the main concerns in the telecommunication industries is deemed as the CC (Dalvi et al., Citation2016). Thus, the reasons behind the reasons for CC who are willing to switch to another network in addition to the behaviour patterns as of the prevailing CCs’ data are necessary for business analysts in addition to customer relationship management analysers (Hong et al., Citation2009). The accurate requirements of the customers can well be identified centred upon this data (Jain et al., Citation2020). For reducing the ratio of customers that are going to churn, it is utilised in the designing of retention strategies (rendering exclusive offers in addition to promotions to the customers and convincing them to keep utilising their networks) (Tsai & Lu, Citation2009). When analogised to new clients, elevated sales along with diminished marketing cost was led by retaining prevailing clients. a crucial part of the telecom sector’s tactical decision-making and planning process involves customer churn prediction activity that gets resulted from the facts. A large quantity of data are being produced in the telecommunication sector and the data encompasses missing values, which brings about bad CP because of which the precise CP is a complicated task (Yabas et al., Citation2012). The customer retention procedure is eased by structuring a churn prediction model. In this persistently rising competitive environment, the success of mobile telecommunications companies relies on this way.
In order to cope with the churning prediction issue, numerous Machine Learning (ML) algorithms were developed (Amin, Al-Obeidat, et al., Citation2017). Neglecting the temporal nature of customer behaviour that might produce a loss of the discriminative capability, non-consideration of class rarity and incapability to finalise the causes for churn, performing data reduction without implementing dimensionality reduction, thereby augmenting the complexity and improper regarding of switching expenses, customer contentment factors as well as professional level demographic factors are the drawbacks even though good predictors have been offered by these studies (Amin et al., Citation2016; Huang et al., Citation2012; Keramati et al., Citation2014). The features are selected randomly by some existing approaches (Huang, Buckley, et al., Citation2010; Mitrovic et al., Citation2017). This arbitrary selection involves duplicating as well as the abandonment of the data values, which brings about a lack of consistency and exhibiting differing performances (Hoppner et al., Citation2018; Mozer et al., Citation2000). The work has developed Swish RNN centred customer CP for the telecommunication industry with a novel FS strategy for mitigating the aforementioned issues caused amid customer CP (Maldonado et al., Citation2019).
The paper is arranged as: Section 2 surveys the related works concerning the proposed work, Section 3 explains the proposed methodology called Swish RNN based customer CP for telecommunication industry with a novel FS strategy and Section 4 illustrates the results and discussion of the proposed work based on performance metrics. Lastly, Section 5 concludes the paper.
2. Literature survey
Ullah et al. (Citation2019) generated a CP design that utilised the classification along with clustering techniques aimed at the CC’s identification and rendered the aspects behind the customers’ churn on the telecommunication sector. Via information gain as well as a correlation attribute ranking filter, FS was carried out. Initially, classification algorithms categorised the CC’s data. The Random Forest (RF) carried out well with 88.63% rightly classified instances. Subsequent to classification, the CC’s data were segmented as well as categorised into groups via cosine similarity. Group-centred retention was rendered. Additionally, the attribute-selected classifier algorithm has generated the rules for identifying the churn factors that were vital in the determination of root causes of churn. Better churn classification was generated via the developed CP design with the aid of the RF algorithm. Also, based on k-means clustering, the customer was profiled. Moreover, it rendered aspects behind the churning of CC. Nevertheless, for obtaining higher prediction rates, the scheme wasn't robust.
Idris and Khan (Citation2016) formed Filter–Wrapper and Ensemble Classification Process, which was an intelligent CP system aimed at telecommunication. The filter- in addition to wrapper-centred FS was joined together. The learning capability of an ensemble classifier that the diverse base classifiers built was exploited. Particle Swarms Optimization (PSO)-centred under-sampling and Minimal Redundancy and Maximal Relevance (mRMR) FS was employed. The impact of imbalanced class distribution together with large dimensionality was lessened. The irrelevant together with redundant features were additionally discarded with the employment of a Genetic Algorithm (GA) in the Wrapper phase. The feature space was employed and exploited by the RF, Rot Boost, Rotation Forest, together with Support Vector Machine (SVM). Lastly, with majorities of voting as well as stacking, the ensemble classifier was built. Better performance in churn forecast was achieved as well as it outperformed the other top-notch methods. However, performance degradation was found towards the unstructured data.
Wu et al. (Citation2021) applied customer analytics aimed at churn management. Data pre-processing, Exploratory Data Analysis (EDA), CP, factors analysis, customers segmentation, together with customer behaviour analytics were the “6” components. CP as well as the customer segmentation process was rendered telecommunication operators with an entire churn analysis aimed at better management of customer churn. Initially, multiple ML classifiers envisaged the churn status of the customers. Subsequent to the CP’s implementation, Bayesian Logistics Regression was utilised. The factor analysis was conducted. Some imperative features were figured out for CC segmentation. Next, K-means clustering performed CC segmentation. Customers were segmented into disparate groups. The marketers in addition to decision-makers were given help for the adaptation of retention strategies more accurately. Concerning better accuracy, F1-score, and precision the last outcome trounced the other prevailing works. This approach’s limitation was that it consumed almost equivalent processing time for larger as well as small datasets.
Ahmed and Maheswari (Citation2017) rendered a meta-heuristic-centred CP technique that efficiently carried out the CP on vast telecommunication data. A hybrid form of the Fire-Fly (FF) algorithm was employed as the classifier. The compute-intensive constituent of the FF algorithm was the comparison block. Every FF was contrasted with every other FF for identifying the one with the uppermost light intensity. This constituent was swapped by means of the Simulated Annealing technique and also the classification process was done. The FF algorithm functioned best on churn data. Effectual and quicker outcomes were rendered by the hybridised FF algorithm. The false-positive rates were drastically lessened. The outcomes with higher accuracy rates were rendered. Nevertheless, the scheme ineffectively managed the higher dimensionality telecommunication data.
Idris et al. (Citation2012) examined the significance of a PSO-centred under-sampling technique and managed the imbalanced data distribution in association with disparate feature reduction techniques, say Principle Components Analysis (PCA), Fisher’s ratios, F-score, together with mRMR. The performance on sampled optimally and lessened features were employed as well as evaluated by means of the RF together with K Nearest Neighbours (KNN) classifiers. Sensitivity, specificity, along with Area Under the Curves (AUC) centred measures evaluated prediction performance. Lastly, centred on PSO, mRMR, along with RF called Chr-PmRF, it was observed via the assessment that the presented approach carried out quite well in the CP. Consequently, it could well be beneficial aimed at the extremely competitive telecommunication industry. Nevertheless, the relationship betwixt the variables was not regarded.
Amin, Shah, Khattak, Moreira, et al. (Citation2018) presented “4” varied data transformation methodologies like box–cox, log, rank, along with Z-score intended for Cross-Company CP (CCCP) prediction grounded on various classifiers. Here, by utilising Spearman’s correlation statistical mechanism, the correlation betwixt the subject dataset’s attributes was detected. For CCCP, merely the attributes that interconnected with every single other were chosen. After that, by utilising an approximate equivalent frequency discretisation model, the continuous-valued attributes were normalised into discrete-valued attributes since this model could considerably ameliorate the classification performance. The empirical outcomes displayed that by enhancing the classifiers’ performances, the data normality was augmented by the data transformation methodologies. Nevertheless, when analogised with the other data transformation methodologies, the Z-Score data transformation model could not obtain better outcomes.
Amin, Anwar, et al. (Citation2017) produced a model to discover Compromised User Credential (CUC) in a live database by utilising a hybrid mechanism by evaluating along with analogising the user’s present as well as past operational behaviour. The amalgamation of ripple down rules, prudent evaluation, along with SEs was utilised to construct this methodology. By employing the prudent checkpoint model, a prudence message was created whenever an alteration in the user’s behaviour, which could not gratify the rules (RBP approach), was identified. The outcomes displayed that the CUC could be effectively detected by the presented model with higher accuracy along with a lower error rate. Alternatively, since the samples’ size could mislead any time when an abnormal situation happened, the error rate did not rely on the samples’ size.
Amin et al. (Citation2016) reviewed “6” renowned sampling methodologies; additionally, analogised these major models’ performance (Synthetic Minority Oversampling Technique (SMOTE), Couples Top-N Reverse k-Nearest Neighbour (TRkNN), Mega-trend Diffusion Function (MTDF), Adaptive Synthetic Sampling approach (ADASYN), Majority Weighted Minority Oversampling Technique (MWMOTE), together with Immune Centroids Oversampling Technique (ICOTE)). Furthermore, by utilising openly accessible datasets, “4” rules-generation algorithms like Covering, Learning from Example Module, version 2 (LEM2), and Exhaustive along with Genetic algorithms were analysed. The empirical outcomes displayed that regarding genetic algorithms, the MTDF along with rules-generation models’ performance was better than that of the remaining oversampling together with rule-generation methodologies. However, from the two-class as well as multi-class classifiers, the Receiver Operating Characteristic (ROC) attained was not evaluated.
Amin, Shah, et al. (Citation2017) provided the Just-In-Time (JIt) aimed at Customer CP (CCP) in the telecommunication sector. Here, the classifiers were trained on adequate historical data amassed in well-structured Customer Relationship Management (CRM) of one company; in addition, they were implemented with extracted data on freshly found company’s data. The required dataset should be obtained from the telecommunication sector in the JIT. To design the cross-company JIT model for CCP, the SVM classifier was espoused as a base classifier methodology. The feature space in such higher-dimensional data could be learned independently by the SVM. The experiential outcomes displayed greater performance than other conventional methodologies. Conversely, since the algorithm was chosen regarding the outcome’s accuracy, it was time-consuming.
Amin et al. (Citation2019) introduced a features weighting model by employing a GA for CCP in the telecom industry. To assign weights automatically to the attributes regarding NB classification, the GA was utilised by this model. Prior to the development of the CCP model, pre-processing was performed to get the apt data. From the feature set, the phone number attribute was removed to enhance the CCP’s consistency. The experiential outcomes displayed that by obtaining higher accuracy along with precision, the provided methodology outshined with better performance. Nevertheless, the zero frequency issue was a drawback here since it assigned zero probability to a categorical variable whose category in the test data set wasn’t accessible in the training dataset.
Amin, Shah, Khattak, Baker, et al. (Citation2018) implemented a JIT approach for CCP. JIT-CCP model wielded the Cross-company concept, for example, a company (source) data were employed as a training set, and other company (target) data were regarded for testing. The cross-company data should be cautiously transmitted before being implemented for classification for assisting JIT-CCP. Additionally, it offered an empirical contraction and effect with and without state-of-the-art data transformation techniques. As an underlying classifier, experiments on publicly available benchmark datasets were executed and wielded Naive Bayes. The JIT-CCP’s performance was significantly enhanced by the data transformation methodologies. However, the precision of CCP was not adequate.
Amin, Rahim, Ali, et al. (Citation2015) evaluated a 3-phase customer CP methodology. Initially, by eradicating the redundancy and increasing the relevance that decreased and hugely associated feature set, a supervised feature selection process was espoused to choose the related subset of features. Next, via Ripple Down Rule (RDR), a knowledge-based system (KBS) was constructed. Via prudence evaluation, the brittle churn KBS issue was tackled. Prompt to the decision-maker was issued, when the case was beyond the sustained knowledge in the database. For analysing the Knowledge Acquisition (KA) in the KB system, a methodology for SE was presented. In the telecommunication industry, the introduced approach might be the best option for CP. However, the complexity of customer retention was maximised since the state and area code of CC were not found.
Amin, Rahim, Ramzan, et al. (Citation2015) examined and analogised the predictive performance of “2” familiar oversampling SMOT and Megatrend Diffusion Function (MTDF) along with “4” rule generation algorithms like Exhaustive, Genetic, Covering and LEM2 grounded on rough set classification by employing openly present data sets. By eradicating the unwanted features from the dataset, the helpful feature extraction might be a key in not just developing the classification but also decreasing the computational cost and complexity. For feature extraction that not just elected the good feature subset but also decreased the feature space, the minimal Redundancy Maximum Relevance (mRMR) technique was wielded. To choose the final one, the predictive performance of oversampling methodologies and rules generation techniques were employed. Nevertheless, due to various sample reactions, the over fitting problem took place in SMOT.
Amin, Shehzad, Khan, et al. (Citation2015) introduced a rough set theory, a rule-centric decision-making methodology to extract rules for CP. For exploring the “4” various Exhaustive, Genetic, Covering and LEM2 algorithms, experiments were executed. When analogised to other “4” rules generation algorithms, rough set classification centred on genetic algorithm, rules generation attained the apt performance. Additionally, entire customers that will churn or possibly may churn might be entirely predicted; in addition, offered helpful information to the strategic decision-makers. However, the quantitative data can’t be tackled by the rough set theory.
Amin et al. (Citation2014) validated customer CP in which rough set theory was wielded as a 1-class classifier and multi-class classifier to examine the trade-off in the selection of an effectual classification model for customer CP. For exploring the performance of “4” various rule generation algorithms like exhaustive, genetic, covering along with LEM2, experiments were performed. When analogised to other “3” rule generation algorithms, the rough set as a one-class classifier together with a multi-class classifier grounded on a genetic algorithm achieved apt performance. Moreover, for binary/multi-class classification issues, the rough sets as a multi-class classifier offered enhanced outcomes by implementing those methodologies to the openly present dataset. Nevertheless, for categorising the churner, a rule generation model requisites extra duration along with was less effectual.
3. Proposed methodology
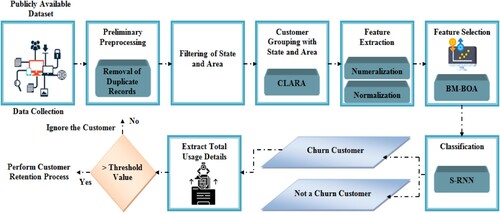
CP is the process of predicting whether the customer will change the telecommunication network or not. If the clients are not content with the services of any telecommunication company, customer churn occurs. It brings about the service migration of customers who begin switching to other service providers. In order to evade that, it is required to envisage the churned customer as early as probable and fulfil their expectations. A swish RNN based customer CP is proposed for the telecommunication industry with an FS strategy. As of the telecommunication-CP dataset, the data are gathered. Next, the initial pre-processing is carried out on the amassed data. Next, the respective state together with area of the customers is filtered out. Next, the CLARA clustering algorithm groups together the equivalent customers centred upon the state in addition to the area. After that, the clustered data are yet again subjected to pre-processing wherein the clustered data gets numeralised and normalised. Thus, additionally, intricacy can well be avoided. Next, the most needed and imperative features are fetched out as of the pre-processed data. The BM-BOA algorithm selected the most helpful and appropriate features for the work. These chosen features are inputted into the classifier. Whether the customer is a churner or not is efficiently predicted by S-RNN. The network utilisation record of the customer is examined if it is predicted as a CC. The equivalent threshold value is fixed centred on the network utilisation by the client. If the network is utilised by the client on a large basis, the retention process is performed to maintain them in the same network. The customer who utilises the network limitedly will be ignored. The proposed method’s architecture is exhibited in .
Figure 1. Architecture of the proposed method.
3.1. Data collection
Primarily, the data are gathered from the telecommunication CP dataset. The demographics information of the customers, network utilisation history of the customers, customers account information, et cetera are present in that dataset. Centred on the aforesaid data, the churn can well be predicted.
3.2. Preliminary preprocessing
Subsequent to data collection, the preliminary pre-processing step is executed. Via removing the duplicate customer records from the dataset, the gathered data are preprocessed, and then, they are transmuted into a well-readable format.
3.3. Unique attribute identification
Centred on the respective state as well as area code of the clientele, the data are filtered once the gathered data gets pre-processed. From this, the customers’ unique attributes can well be identified. In doing so, additional analysis can well be done effortlessly with less computation expense.
3.4. Customer grouping with state and area
The grouping of customer records is performed subsequent to finding the unique attribute. Generally, the information concerning customers as of disparate states and countries is present in the telecommunication customer records. It is literally an intricate task to analyse worldwide customer records. Thus, in order to lessen these burdens, the customer records as of respective states as well as areas are grouped and put into a cluster. Clustering Large Applications (CLARA) algorithm takes care of this grouping process.
The CLARA is basically an extension to the Partitioning Around Medoids (PAM) clustering technique. To lessen the computation time together with the memory allocation issue, the CLARA is a more appropriate technique for larger datasets. The steps that are present in the CLARA are elucidated as,
Step 1: Initially, the CLARA arbitrarily chooses a smaller subset (,
signifies a total clusters, that is medoids) as of the whole input data
, and also applies the PAM over the chosen subset.
Step 2: The PAM choose medoids arbitrarily as of that subset as well as assigns them as a primary set of medoids
.
Step 3: Next, every data sample as of the complete dataset
,
,
wherein
is a non-selected object as of
is associated with its closest medoid by utilising Euclidean distance and that is rendered by,
(1)
(1)
Step 4: The dissimilarities are summed together and also their mean values are obtained for every pair of the data sample together with its equivalent medoid (explicitly, the minimal Euclidean distance function as a gauge of dissimilarities). The attainted value is fixed as a preliminary Cost Function (CF).
Step 5: The newer subset of data points is yet again arbitrarily picked in the subsequent iteration. For getting a newer set of medoids, the PAM is implemented. The CF is computed for the whole dataset and the newer set of medoids. The CF is computed by the relation.
(2)
(2)
Wherein,
signifies the total data and also
is
sample that be a member of the cluster mentioned by
.
Step 6: This CF is fixed as a newer current CF if it is lower compared to the current CF. As per that, the set of medoids is updated. After that, the subsequent run of PAM occurs.
Step 7: Subsequently, the minimum CF in addition to the equivalent medoids are attained. Therefore, the best clusterisation is attained for a set of medoids. Thus, the formed cluster
can well be illustrated as,
(3)
(3)
3.5. Data preprocessing
After that, on the clustered data, the pre-processing function is implemented. Wherein the unwanted data gets abandoned and also the unstructured data are transformed to the structured format so that the machine can comprehend easily. In the proposed work, two operations are performed by the preprocessing function, say numeralisation and normalisation. The mathematical illustration of pre-processing function is rendered by,
(4)
(4)
Wherein,
signifies the output of preprocessing function,
implies the input clustered data and
signifies the preprocessing functions that is represented by.
(5)
(5)
Wherein, implies the numeralisation process and
implies the normalisation process.
3.5.1. Numeralisation
The string values or characters that are available in the preprocessed data are converted into a numerical format called Numeralisation. Conversely, the clustered data are converted into numerical data. The numeralisation function is formulated as,
(6)
(6)
Wherein,
signifies the outcome of the numeralisation function.
3.5.2. Normalisation
The technique wherein the data are scaled by means of adjusting the data values into a particular range, say betwixt 0–1 or −1–1 utilising the total feature values is called Normalisation. Thus, the performance and training stability of the model is enhanced by the normalisation technique. It is as well employed for more effectual access to data. In the proposed work, Log Scaling is employed for the normalisation of the data. It computes the log of the values as well as compresses an extensive range to a narrow range. The log scale normalisation is stated by,
(7)
(7)
Wherein,
signifies the original value and
implies the normalised value.
3.6. Service usage feature extraction
International_plan , voice_mail_plan
, number_vmail_messages
, total_day_minutes
, total_day_calls
, total_day_charge
, total_eve_minutes
, total_eve_calls
, total_eve_charge
are the most needed and suitable features, which are fetched out as of the pre-processed data. The Feature Extraction (FE) aims to lessen the total features so that the total resources required to process such huge data can well be lessened. The mathematical expression for the
is rendered by,
(8)
(8)
3.7. Service usage feature selection
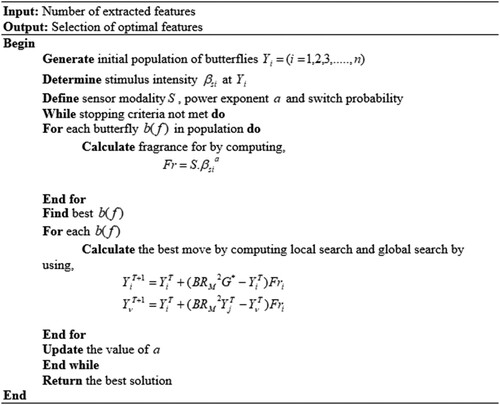
The most needed and useful features are efficiently chosen in the FS phase for the churn prediction and abandonment of unwanted noisy features. This can enhance the model’s memory, computational time, together with accuracy. Thus, the CP’s performance is significantly enhanced by the FS process. For better FS, the BM-BOA is developed. The traditional Butterfly Optimization Algorithm (BOA) encompasses the downside of being trapped into some local optimum solutions due to premature convergence. When solving intricate multi-modal functions with manifold local minimums, it will be an issue. Thus, to trounce this, the Brownian Movement (BM) is amalgamated with traditional BOA for improving the randomisation phase of the BOA. Not like normal arbitrary movement, the BM steps are chosen centred upon the normal Gaussian distribution rather than the dominant tailed distribution. It will be the solution to the BOA issue. The BM-BOA pseudo-code is rendered in . This BM-based BOA for FS is named BM-BOA. The steps for the BM-BOA construction are expounded as follows.
Figure 2. Pseudo-code for BM-BOA algorithm.
3.7.1. Brownian motion-based Butterfly optimisation algorithm
One of the new meta-heuristic optimisation algorithms is the BOA. It mimics the food foraging as well as finding mating partner behaviours of Butter-Flies (BF). Chemoreceptors are scattered on BF’s bodies and they work as sense receptors. These chemoreceptors were utilised by the BF for sensing or smelling the flowers or food’s fragrance. Additionally, an optimal mating partner can be found with the aid of a chemoreceptor. A fragrance is generated by the BF with an intensity level whilst it is changing its places. In the BOA algorithm, the search agents’ (BF) movement is guided by this fragrance. Centred on the fragrance intensity, if the fragrance of any BF is not sensed by a given BF within the search space, then exploitation (Local Search (LS)) is carried out by this BF via moving to a new arbitrarily chosen position. However, if the BF senses the fragrance of the best BF, then it will move towards that BF, which is termed exploration (Global Search (GS)).
The above characteristics of BF are idealised as:
All BF is supposed to emit some fragrance that enables the BF to attract each other.
Every BF will move randomly towards the best BF emitting more fragrance.
The stimulus intensity of a BF is affected or determined by the landscape of the objective function.
Update fragrance
Every BF, in BOA, encompasses a unique fragrance as well as personality. The fragrance is stated as a function of the stimulus intensity. It can well be ascertained utilising the following equation that is rendered by,
(9)
(9)
Wherein,
signifies the value of fragrance that changes in each iteration. This value exhibits how strong the fragrance is felt by other BF. The BF stimulus intensity is formulated as
,
signifies the power exponent that depends on the modality,
implies the sensory modality, and the values of
and
on the utilised BF are in the gamut
.
Movement of Butterflies
In the BF movement phase, the BF’s position moves as many times as the iterations. Here, all BF in the solution room moves to a new position. Next, the fitness value of every BF is estimated and updated. In addition, centred on Equation 6, the BF generates fragrance in their computed position. The GS phase and the LS phase are the two movements of BOA. In the GS phase, BF goes towards other BF encompassing the best solution. The GS phase for BF is exhibited as,
(10)
(10)
Wherein,
signifies the vector solution
for the
BF in the iteration
,
implies an arbitrary number in the gamut
,
implies the best solution on the current iteration, and the
BF fragrance is signified by
. Meanwhile, the LS phase is exhibited in the subsequent equation.
(11)
(11)
Wherein,
and
signify the
and
BF as of the solution room.
implies the random number in the gamut
. The limitation like random replacing of worst individual and lack of exploitation can be occurred because of this random replacement. These limitations might bring about the slow convergence problem. The BMO along with BM methodology is amalgamated to balance this. The BM is formulated as,
(12)
(12)
(13)
(13)
(14)
(14)
(15)
(15)
Wherein, signifies the motion time period in seconds of an agent,
implies the number of sudden motions for the same agent in proportion to time.
The BOA is improved by merging BMO with BM. Therefore, the expression aimed at the updated LS and GS of the BMO is stated as,
(16)
(16)
(17)
(17)
Therefore, due to the updation mechanism of elephant heard optimisation, higher exploitation ability is attained. If the termination norm is satisfied, then the movement of BF ends. The stopping criterion utilised is the maximum number of the attained iteration. Centred upon the fitness values, the algorithm generates the best solution.
Hence, the selected features are mathematically illustrated as,
(18)
(18)
The pseudo-code of BM-BOA is depicted in ,
3.8. Classification
Next, the chosen features are given as input to the Swish – Recurrent Neural Networks (S-RNN) algorithm. The sigmoid Activations Function (AF) is employed by the conventional RNN for classification. Vanishing gradient is the con of the sigmoid function, and it occurs usually in the back-propagation process, which brings about the substantial decelerate of learning as well as the classification rate is lessened. The swish AF is incorporated in the Recurrent Neural Network (RNN) for overcoming such cons. It stands as a relatively simple function. It stands as the multiplication of the input with the sigmoid function. The sigmoid issues are trounced by the swish function. It is particularly appropriate for deeper networks. Thus, to attain better classification outcomes, this function is incorporated in RNN.
Swish – Recurrent neural network
An RNN is basically a kind of neural network. Here, the output as of the preceding step is inputted to the current step. The hidden state is the main and most imperative feature of RNN, and it remembers some information concerning a sequence. Every Hidden Layer (HL) encompasses its own set of weights and biases in conventional neural networks. For an instance, the weights and biases for the 1st HL are,
for the 2nd HL and
for the 3rd HL. These layers are autonomous of one another. Therefore, they don’t memorise the preceding outputs. However, the RNN transmutes the independent into dependent activations by means of rendering the same weights and biases to every layer, therefore lessening the intricacy of augmenting parameters and memorising every previous output via giving every output as input to the next hidden layer. The procedures that are involved in the S-RNN are given as,
Step 1: The S-RNN is implemented on the inputted data that encompasses of a hidden vector sequence
and the output vector sequence
by means of iterating the subsequent sequence as of
. The HL can well be gauged as,
(19)
(19)
Wherein,
terms signifies the weight matrices (e.g.
is the input-hidden weight matrix), the
terms imply bias vectors and
signifies the hidden layer AF, which is computed utilising swish function and that function is stated by,
(20)
(20)
Here, states the trainable parameter concerning the model.
Step 2: Next, the final outcome is rendered from the Output Layer (OL). The sigmoid AF activated OL. Additionally, the OL can well be ascertained by,
(21)
(21)
(22)
(22)
Step 3: The sigmoid AF is gauged utilising the following relation.
(23)
(23)
Step 4: Next, the difference betwixt the actual
and predicted value
is computed to evaluate the loss value. The error value can well be gauged as,
(24)
(24)
The model gives the exact solution if the error value
. If the error value
, then the back-propagation is taken place by means of updating the weight values. Lastly, the CC is efficiently predicted by the classification technique without any misclassification error.
3.9. Churn prediction
CC and non-CC are the “2” form of last outcome as of the S-RNN classifier
Churn customer: The customer who is willing to move on to another telecommunication network.
Non-churn customer: The customer who was ready to sustain on the same telecommunication network.
3.10. Retention process
The network usage record of the specific customer is examined if the outcome is attained as a CC. The equivalent threshold values are fixed centred on their network usage. The customer retention process is performed if the customer’s network usage remains high i.e. the threshold value is higher. The procedure of maintaining the present customers and the prevailing customers to continue on the same network by presenting a few attractive offers and not allowing them deviate to any other telecommunication networks is called the customer retention process. Conversely, the customers get neglected if the network is limitedly utilised by the customer, which means the customer’s network usage is lower than the threshold value.
4. Results and discussion
Here, centred on disparate performance metrics, the last outcome of the proposed work with prevailing techniques was analysed in detail. The performance analysis together with the comparative analysis is performed for proving the work’s effectiveness. MATLAB is taken for the execution of the proposed work. The data are taken from the Customer Churn Prediction, Citation2020 dataset [41].
4.1. Dataset description
The dataset utilised in the proposed work is the CCP, Citation2020 dataset, which comprises 4250 training samples with 19 features as well as 1 Boolean variable “churn” which represents the class of the sample. The features present in the dataset are the state of the customer, number of months the customer has been with the current telecommunication provider, international plan, voice plan, target variable, et cetera. These attributes are used for predicting the churner and non-churner in the proposed work.
4.2. Performance analysis of proposed clustering technique
Centred on clustering time, performance examination of the CLARA clustering algorithm is authenticated. For proving the proposed work’s effectiveness, it is contrasted with disparate prevailing techniques, say, K-means, K-medoid, together with FCM.
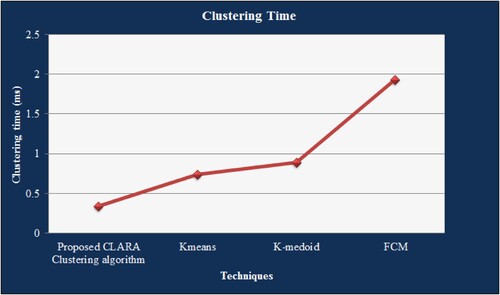
The comparative examination of the clustering time attainted by the CLARA clustering algorithm, K-means, K-medoid, together with FCM is represented in . Efficient clusters are formed by the CLARA clustering algorithm with limited time (0.342312 s) for grouping the data into a cluster. However, the prevailing clustering technique, say, K-means, K-medoid, as well as FCM needs 0.7354, 0, 89345 and 1.934547 s, correspondingly. Therefore, the overall execution time of the work is affected by the augmenting time aimed at the cluster formation. The proposed technique completes the clustering process within a shorter period of time amongst the prevailing clustering techniques. Thus, the complete performance of the proposed work can well be ameliorated.
Figure 3. Comparative analysis of proposed CLARA with respect to clustering time.
4.3. Performance analysis of proposed optimisation technique
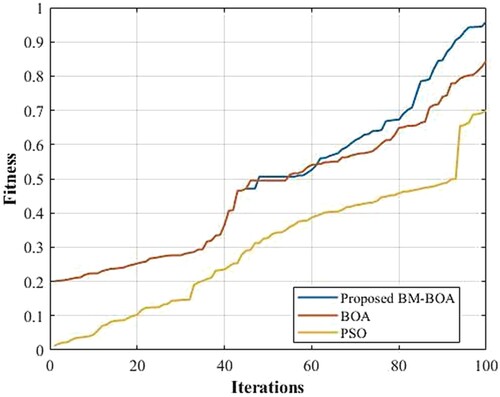
So as to state the efficiency, the proposed BM-BOA’s performance with that of BOA and PSO is evaluated centred upon fitness vs. Iteration.
Grounded on iteration vs. Fitness, the appraisal of the proposed BM-BOA with the prevailing techniques is exhibited in . It was analysed with the BOA together with PSO for elaborating its efficiency. Basically, the iteration versus fitness states that the technique adheres to the best fitness value and lessens the computational time within a minimal iteration. It is evident as of the analysis that the BM-BOA chooses the information-rich features with a minimal number of iteration to choose imperative features. However, numerous iterations are needed for the prevailing optimisation algorithm. The time complexity can be decreased with a better fitness value within a lower iteration. It might also help to attain a good accuracy devoid of additional iteration proceeding process. Thus, the valuable features are efficiently chosen by the proposed optimisation algorithm. Thereby, the computational intricacy of the classification process can well be alleviated.
Figure 4. Comparative analysis of proposed BM-BOA in terms of fitness vs. iteration.
4.4. Performance analysis of proposed classification technique
Concerning disparate performance metrics, say, sensitivity, specificity, precision, recall, accuracy, False-positive rates (FPR), F-Measure, False negative rates (FNR), along with Matthews Correlation Coefficient (MCC), performance analysis of the S-RNN with disparate prevailing techniques, say, RNN, CNN, DNN, together with ANN is validated to state its efficiency.
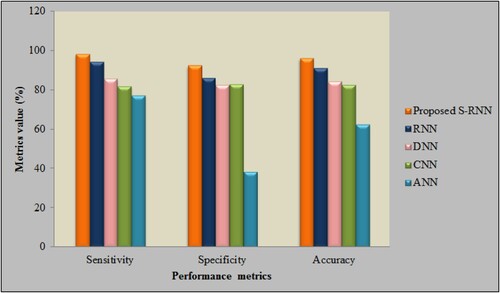
The performance examination of the proposed S-RNN with disparate prevailing techniques, say, RNN, DNN, CNN, as well as ANN concerning sensitivity, specificity, along with accuracy is exhibited in . Higher metrics rates, say, 98.27% sensitivity, 92.31% specificity, together with 95.99% accuracy is attained by the proposed work. However, the prevailing works attain the sensitivity rate that overall ranges betwixt 77.11–94.16%, specificity rate that gamut betwixt 38.335–86.01%, and also accuracy rates that overall gamut betwixt 62.27–91.04%. Thus, better performance metrics rates are attained by the proposed S-RNN. Then, the proposed work predicts the CC more precisely.
Table 1. Performance analysis of proposed S-RNN based on sensitivity, specificity and accuracy.
The comparison examination of the metrics’ value attained by the S-RNN and other prevailing works is depicted in . The metrics value of the model ought to remain high as possible if the design is said to be more robust as well as effectual. High sensitivity, specificity, in addition to accuracy rates are attained by the proposed S-RNN. However, contrasted with the proposed work, the RNN, CNN, DNN, together with ANN attain the metrics’ value that is very low. Thus, the proposed work renders propitious outcomes in a CP system.
Figure 5. Comparative analysis of proposed S-RNN based on sensitivity, specificity and accuracy.
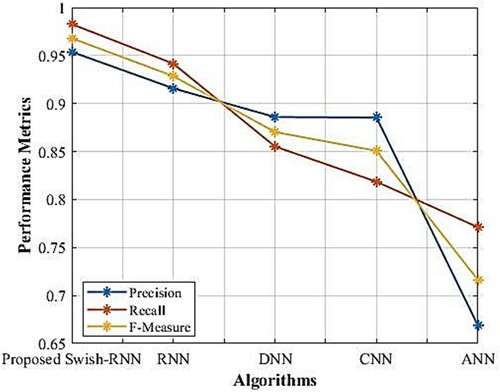
The proposed S-RNN’s performance utilising the performance metrics, say, recall and f-measure are depicted in . As of the data in the tabulation, it is obvious that the S-RNN attains better rates of precision (95.38%), recall (98.27%), together with F-measure (96.80%), while the prevailing works, say, RNN, DNN, CNN, along with ANN attains the precision, recall, along with F-measure at the average of 83.89%, 84.66%, together with 84.14%. The proposed work manages the uncertainties that happen during CP and renders propitious outcomes.
Table 2. Performance analysis of proposed S-RNN based on precision, recall and F-Measure.
The contrast of the performance metrics of the proposed with the prevailing approaches is shown in . For gauging the model’s effectiveness, precision, recall, in addition to F-measure are regarded as vital metrics. Contrasted with the prevailing approaches, a higher percentage of precision, recall, in tandem with F-measure is attained by the proposed work. The proposed system’s performance is found to be superior to the prevailing techniques. It builds precise churn management so that it can well be easy for identifying whether the customer is a churner or not.
Figure 6. Comparative analysis of proposed S-RNN based on precision, recall and F-Measure.
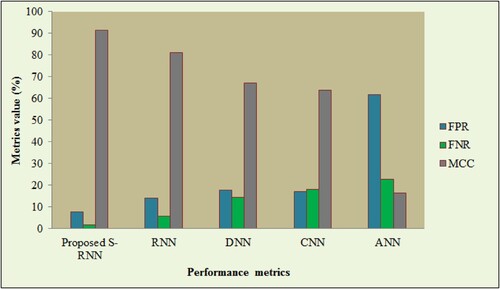
Centred on the FPR, FNR, as well as MCC, the appraisal of the S-RNN is exhibited in . The work’s reliability is revealed by the lower value of FPR and FNR rates. When contrasted with the prevailing works, the lower value of FPR and FNR is attained by the proposed S-RNN. The proposed work attains the 7.69% FPR and 1.73% FNR. However, the prevailing works attain the FPR value that ranges betwixt 13.99–61.67% and the FNR value that ranges betwixt 5.84–22.89%. Additionally, concerning the MCC metric, the proposed work is evaluated. The model’s effectiveness represented the higher value of MCC conversely to the FPR together with FNR rates. The proposed S-RNN attains 91.5% MCC; MCC value between 16.57–80.93% is attained by the prevailing works. Therefore, the RDLNN is an error-prone model as well as delivers the exact outcomes devoid of any misprediction.
Figure 7. Comparative analysis of proposed S-RNN with respect to FPR, FNR and MCC.
5. Conclusion
Swish RNN based customer CP is proposed for the telecommunication industry with a novel FS strategy. Data collection, preliminary preprocessing, filtering of state and area, grouping customers with state and area, FE, FS, classification, CP and retention process are the steps of the proposed approach. Next, the experimentation analysis is employed. In order to corroborate the proposed algorithm’s effectiveness, the performance analysis together with the comparative analysis of the proposed and prevailing techniques is done concerning some performance metrics. Disparate uncertainties can be handled by the developed approach, and it exactly envisages whether the customer will churn or not. The CP dataset, which is a publically available dataset, is employed for the analysis. The highest metrics rate, say, 98.27% sensitivity, 92.31% specificity and 95.99% accuracy are obtained by the proposed S-RNN. An efficient cluster is formed by the proposed CLARA clustering algorithm within 0.342312 s. The information-rich features with minimal iteration are also selected by the proposed BM-BOA. Therefore, the proposed approach identifies the CC as early as possible. The prevailing top-notch methods trounce the proposed approach. It remained to be more reliable as well as robust. In the future, the study can further be extended to explore the changing behaviour patterns of CC by means of applying advanced techniques for predictions as well as trend analysis.
Acknowledgement
We thank the anonymous referees for their useful suggestions.
Author’s contributions
All authors contributed to the study conception and design. Material preparation, data collection and analysis were performed by R. Sudharsan, and Dr. E.N.Ganesh. The first draft of the manuscript was written by R. Sudharsan and all authors commented on previous versions of the manuscript.
All authors read and approved the final manuscript.
Disclosure statement
No potential conflict of interest was reported by the author(s).
Ethical approval
This article does not contain any studies with human participants or animals performed by any of the authors.
Availability of data and materials
Data sharing is not applicable to this article as no datasets were generated or analysed during the current study.
References
- Ahmed, A. A. Q., & Maheswari, D. (2017). Churn prediction on huge telecom data using hybrid firefly based classification. Egyptian Informatics Journal, 18(3), 215–220. https://doi.org/10.1016/j.eij.2017.02.002
- Alboukaey, N., Joukhadar, A., & Ghneim, N. (2020). Dynamic behavior based churn prediction in mobile telecom. Expert Systems with Applications, 162, 1–17. https://doi.org/10.1016/j.eswa.2020.113779
- Amin, A., Al-Obeidat, F., Shah, B., Adnan, A., Loo, J., & Anwar, S. (2017). Customer churn prediction in telecommunication industry using datacertainty. Journal of Business Research, 97, 290–301. https://doi.org/10.1016/j.jbusres.2018.03.003
- Amin, A., Al-Obeidat, F., Shah, B., Al Tae, M., Khan, C., Durrani, H. U. R., & Anwar, S. (2020). Just-in-time customer churn prediction in the telecommunication sector. Journal of Supercomputing, 76(6), 3924–3948. https://doi.org/10.1007/s11227-017-2149-9
- Amin, A., Anwar, S., Adnan, A., Nawaz, M., Alawfi, K., Hussain, A., & Huang, K. (2017). Customer churn prediction in telecommunication sector using rough set approach. Neurocomputing, 237, 242–254. https://doi.org/10.1016/j.neucom.2016.12.009
- Amin, A., Anwar, S., Adnan, A., Nawaz, M., Howard, N., Qadir, J., Hawalah, A., & Hussain, A. (2016). Comparing oversampling techniques to handle the class imbalance problem a customer churn prediction case study. Journal of IEEE Access, 4, 7940–7957. https://doi.org/10.1109/ACCESS.2016.2619719
- Amin, A., Khan, C., Ali, I., & Anwar, S. (2014). Customer churn prediction in telecommunication industry with and without counter-example (1st ed.). Springer. ISBN: 978-3-319-13649-3. https://doi.org/10.1007/978-3-319-13650-9_19
- Amin, A., Rahim, F., Ali, I., Khan, C., & Anwar, S. (2015). A comparison of two oversampling techniques (SMOTE vs MTDF) for handling class imbalance problem a case study of customer churn prediction (1st ed.). Springer. ISBN: 978-3-319-16485-4. https://doi.org/10.1007/978-3-319-16486-1_22
- Amin, A., Rahim, F., Ramzan, M., & Anwar, S. (2015). A prudent based approach for customer churn prediction (1st ed.). Springer. ISBN: 978-3-319-18421-0. https://doi.org/10.1007/978-3-319-18422-7_29
- Amin, A., Shah, B., Abbas, A., Anwar, S., Alfandi, O., & Moreira, F. (2019). Features weight estimation using a genetic algorithm for customer churn prediction in the telecom sector (1st Edition). Springer. ISBN: 978-3-030-16183-5. https://doi.org/10.1007/978-3-030-16184-2
- Amin, A., Shah, B., Anwar, S., Al-Obeidat, F., Khattak, A. M., & Adnan, A. (2017). A prudent based approach for compromised user credentials detection. Cluster Computing, 21(1), 1–19. https://link.springer.com/article/10.1007%2Fs10586-017-0878-4
- Amin, A., Shah, B., Khattak, A. M., Moreira, F. J. L., Ali, G., Rocha, A., & Anwar, S. (2018). Cross-company customer churn prediction in telecommunication a comparison of data transformation methods. International Journal of Information Management, 46, 304–319. https://doi.org/10.1016/j.ijinfomgt.2018.08.015
- Amin, A., Shah, B., Khattak, A. M., Baker, T., Durani, H. u. R., & Anwar, S. (2018, 8–13 July). Just-in-time customer churn prediction with and without data transformation. IEEE Congress on Evolutionary Computation (CEC), Rio de Janeiro, Brazil. https://doi.org/10.1109/CEC.2018.8477954
- Amin, A., Shehzad, S., Khan, C., Ali, I., & Anwar, S. (2015). Churn prediction in telecommunication industry using rough set approach (1st ed.). Springer. ISBN: 978-3-319-10773-8. https://doi.org/10.1007/978-3-319-10774-5_8
- Customer Churn Prediction. (2020). https://www.kaggle.com/competitions/customer-churn-prediction-2020/overview
- Dai, Y., & Wang, T. (2021). Prediction of customer engagement behaviour response to marketing posts based on machine learning. Connection Science, 33(4), 891–910. https://doi.org/10.1080/09540091.2021.1912710
- Dalvi, P. K., Khandge, S. K., Deomore, A., Bankar, A., & Kanade, V. A. (2016, 18–19 March). Analysis of customer churn prediction in telecom industry using decision trees and logistic regression. Symposium on Colossal Data Analysis and Networking, Indore, India. https://doi.org/10.1109/CDAN.2016.7570883
- De Caigny, A., Coussement, K., & De Bock, K. W. (2018). A new hybrid classification algorithm for customer churn predictionbased on logistic regression and decision trees. European Journal of Operational Research, 269(2), 760–772. https://doi.org/10.1016/j.ejor.2018.02.009
- Geervani, D., & Sandeep, T. S. (2019). A detailed analysis customer churn in telecommunication industry data sets, methods and metrics. International Journal of Computer Science and Engineering (IJCSE), 8(6), 1–8.
- Hong, X., Zigang, Z., & Yishi, Z. (2009, 21–22 November). Churn prediction in telecom using a hybrid two-phase feature selection method. 3rd International Symposium on Intelligent Information Technology Application, Nanchang, China. https://doi.org/10.1109/IITA.2009.392
- Hoppner, S., Stripling, E., Baesens, B., Broucke, S., & Verdonck, T. (2020). Profit driven decision trees for churn prediction. European Journal of Operational Research, 284(3), 920–933. https://doi.org/10.1016/j.ejor.2018.11.072
- Huang, B., Buckley, B., & & Kechadi, T. M. (2010). Multi objective feature selection by using NSGA-II for customer churn prediction in telecommunications. Expert Systems with Applications, 37(5), 3638–3646. https://doi.org/10.1016/j.eswa.2009.10.027
- Huang, B., Kechadi, M. T., & Buckley, B. (2012). Customer churn prediction in telecommunications. Expert Systems with Applications, 39(1), 1414–1425. https://doi.org/10.1016/j.eswa.2011.08.024
- Huang, B. Q., Kechadi, T. M., Buckley, B., Kiernan, G., Keogh, E., & Rashid, T. (2010). A new feature set with new window techniques for customer churn prediction in land-line telecommunications. Expert Systems with Applications, 37(5), 3657–3665. https://doi.org/10.1016/j.eswa.2009.10.025
- Huang, Y., & Kechadi, T. (2013). An effective hybrid learning system for telecommunication churn prediction. Expert Systems with Applications, 40(14), 5635–5647. https://doi.org/10.1016/j.eswa.2013.04.020
- Idris, A., & Khan, A. (2016). Churn prediction system for telecom using filter wrapper and ensemble classification. The Computer Journal, 60(3), 410–430. https://doi.org/10.1093/comjnl/bxv123
- Idris, A., Rizwan, M., & Khan, A. (2012). Churn prediction in telecom using random forest and PSO based data balancing in combination with various feature selection strategies. Computers and Electrical Engineering, 38(6), 1808–1819. https://doi.org/10.1016/j.compeleceng.2012.09.001
- Jain, H., Khunteta, A., & Srivastava, S. (2020). Churn prediction in telecommunication using logistic regression and logit boost. Procedia Computer Science, 167, 101–112. https://doi.org/10.1016/j.procs.2020.03.187
- Keramati, A., Jafari-Marandi, R., Aliannejadi, M., Ahmadian, I., Mozzafari, M., & Abbasi, U. (2014). Improved churn prediction in telecommunication industry using datamining techniques. Applied Soft Computing, 24, 994–1012. https://doi.org/10.1016/j.asoc.2014.08.041
- Kumar, G. R., Tirupathaiah, K., & Krishna Reddy, B. (2019). Client churn prediction of banking and fund industry utilizing machine learning techniques. International Journal of Computer Sciences and Engineering, 7(6), 842–846. https://doi.org/10.26438/ijcse/v7i6.842846
- Lu, N., Lin, H., Lu, J., & Zhang, G. (2014). A customer churn prediction model in telecomindustry using boosting. IEEE Transactions on Industrial Informatics, 10(2), 1659–1665. https://doi.org/10.1109/TII.2012.2224355
- Maldonado, S., Lopez, J., & Vairetti, C. (2020). Profit-based churn prediction based on minimax probability machines. European Journal of Operational Research, 284(1), 273–284. https://doi.org/10.1016/j.ejor.2019.12.007
- Meeravali, S., Bhattacharyya, D., Rao, N. T., & Hu, Y.-C. (2021). Performance analysis of an improved forked communication network model. Connection Science, 33(3), 645–673. https://doi.org/10.1080/09540091.2020.1867064
- Mitrovic, S., Baesens, B., Lemahieu, W., & De Weerdt, J. (2018). On the operational efficiency of different feature types for telcochurn prediction. European Journal of Operational Research, 267(3), 1141–1155. https://doi.org/10.1016/j.ejor.2017.12.015
- Mozer, M. C., Wolniewicz, R., Grimes, D. B., Johnson, E., & Kaushansky, H. (2000). Predicting subscriber dissatisfaction and improving retention in the wireless telecommunications industry. IEEE Transactions on Neural Networks, 11(3), 690–696. https://doi.org/10.1109/72.846740
- Sridhar, A., Sharvani, G. S., Manjunatha Reddy, A. H., & Nagaraj, K. (2020). Envisaging prominence of Indian telecom operators using an ensemble link based approach. Indian Journal of Computer Science and Engineering (IJCSE), 11(3), 297–310. https://doi.org/10.21817/indjcse/2020/v11i3/201103359
- Tsai, C. F., & Lu, Y. H. (2009). Customer churn prediction by hybrid neural networks. Expert Systems with Applications, 36(10), 12547–12553. https://doi.org/10.1016/j.eswa.2009.05.032
- Ullah, I., Raza, B., Malik, A. K., Imran, M., Islam, S. U., & Kim, S. W. (2019). A churn prediction model using random forest analysis of machine learning techniques for churn prediction and factor identification in telecom sector. IEEE Access, 7, 60134–60149. https://doi.org/10.1109/ACCESS.2019.2914999
- Vafeiadis, T., Diamantaras, K. I., Sarigiannidis, G., & Chatzisavvas, K. C. (2015). A comparison of machine learning techniques for customerchurn prediction. Simulation Modelling Practice and Theory, 55, 1–9. https://doi.org/10.1016/j.simpat.2015.03.003
- Wu, S., Yau, W.-C., Ong, T.-S., & Chong, S.-C. (2021). Integrated churn prediction and customer segmentation framework for telco business. IEEE Access, 9, 62118–62136. https://doi.org/10.1109/ACCESS.2021.3073776
- Yabas, U., Cankaya, H. C., & Ince, T. (2012, 16–20 July). Customer churn prediction for telecom services. IEEE 36th International Conference on computer Software and Applications, Izmir, Turkey. https://doi.org/10.1109/COMPSAC.2012.54