
 ?Mathematical formulae have been encoded as MathML and are displayed in this HTML version using MathJax in order to improve their display. Uncheck the box to turn MathJax off. This feature requires Javascript. Click on a formula to zoom.
ABSTRACT
Crowd counting and localisation are essential tasks in crowd analysis and are vital to ensure public safety. However, these tasks via UAV bring new obstacles compared with video surveillance (e.g. viewpoint and scale variations, background clutter, and small scales). To overcome the difficulties, this research presents a novel network named PDNet. It employs the multi-task learning approach to combine the point regression and density map regression. PDNet includes a backbone to extract multi-scale features, a Dilated Feature Fusion module (DFF), a Density Map Attention module (DMA), a density map branch and a point branch. Aims of DFF is to address the difficulties of small targets and scale variations by establishing relationships between targets and their surroundings. DMA is created to address the challenges of complicated backgrounds, allowing the PDNet to focus on the target's location. In addition, the density map branch and point branch are designed for density maps regression and point regression, respectively. Experiments on the DroneCrowd dataset demonstrate that our proposed network outperforms state-of-the-art approaches in terms of localisation, L-mAP (53.85%), L-AP@10 (59.14%), L-AP@15 (63.64%), and L-AP@20 (66.21%), and we improved counting performance and significantly reduced inference time. In addition, ablation experiments are conducted to prove the modules' effectiveness.
1. Introduction
Crowd counting and localisation are essential tasks in crowd analysis. They are vital to ensure public safety. In recent years, because UAVs can fly freely and cover a larger area than video surveillance, crowd counting and localisation tasks are realised by drone surveillance (Du et al., Citation2020; Liu et al., Citation2021). Utilizing drones for crowd counting and localisation can provide a more comprehensive security.
In recent years, a lot of crowd counting and localisation research based on video surveillance has been conducted. Some researchers (Liang, Xu, Zhu, et al., Citation2022; C. Liu et al., Citation2019; Sam et al., Citation2017) have proposed using the density map in the field of crowd counting to increase network performance, but just knowing the number of pedestrians in a scene is insufficient for further tasks such as crowd tracking. Several efforts, such as Liang, Xu, Zhu, et al. (Citation2022), have been made to combine crowd counting and crowd localisation by first obtaining a density map of the same size as the image and then using the non-maximum suppression (NMS) approach to acquire locations of the local maximum on the density map. Although these works can achieve better performance in counting, the presence of long-tailed distributions (Xu et al., Citation2022) in the dense regions of the density map can lead to inaccuracies in the localisation task. Some works attempted to improve the density map by proposing techniques like (Liang, Xu, Zhu, et al., Citation2022), but the extent of the NMS's local maximum is artificially determined, lowering the performance of these approaches in localisation.
Some authors have proposed regression-based methods, such as pseudo box-based (Y. Liu et al., Citation2019) and point-based methods (Song et al., Citation2021; Wen et al., Citation2021), to circumvent the issue of long-tailed distributions induced by density maps as intermediate representations. Since annotations of the majority of current crowd counting datasets (Wen et al., Citation2021; Zhang et al., Citation2016) are points, they cannot provide the size of the box information for pseudo-box-based methods, which inevitably leads to poor performance. In contrast, point-based methods remove the intermediate representation (e.g. density map) and directly regress locations of targets, which simplifies the network and achieves better results, such as Song et al. (Citation2021).
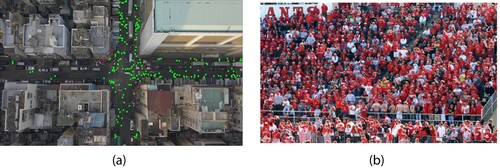
There are different problems with UAV-based and video surveillance-based crowd counting and localisation (view point and scale changes, background clutter, and small scales) as shown in Figure . Consequently, employing the point-based technique directly on aerial images will degrade performance.
Figure 1. (a) was captured by UAV with points annotation and (b) was captured by video surveillance with points annotation.
Based on the above analysis, the density map-based approach can help the network achieve better counting performance, while the point-based method can help the network achieve better localisation performance. Therefore, we propose a point-based and density map-based hybrid multi-task network called PDNet. STNNet (Wen et al., Citation2021) has a similar structure to PDNet. It takes the sum of predicted density maps as the counting result and the predicted points as the localisation result, which means that not all targets have location information. Therefore, STNNet is not reasonable in practice. In contrast, PDNet uses point regression as the primary task and density map regression as the secondary task. And the counting result is the number of predicted points. This mechanism makes PDNet more useful in practice. In addition, we tried to introduce the predicted density maps of the auxiliary task outputs as spatial attention into the network, so we designed the density map attention (DMA) module. It does not need to conduct complex structures but improves the network's ability to discover targets, which is different from other spatial attention techniques. And to overcome problems of small targets and scale variations in aerial images, we designed a new FPN-based (Lin, Dollár, et al., Citation2017) feature fusion method, dilated feature fusion (DFF). Most of the areas in the aerial imagery are buildings, and only small parts of the aerial image contain targets. Establishing relationships between targets and the global context may introduce too much error information and lead to degradation of detection performance (Li et al., Citation2019; Y. Liu et al., Citation2020), so DFF only builds the relationship between the target and their surroundings. We picked EfficientnetV2-S (Tan & Le, Citation2021) instead of VGG16 as the backbone to make PDNet has a higher inference speed.
Experimental results on DroneCrowd show that PDNet outperforms existing methods in all metrics (L-mAP, L-AP@10, L-AP@15, L-AP@20) of localisation; we also improve the accuracy of crowd counting in some scenarios and significantly reduce inference time. To sum up, because PDNet is a method based on UAV, it is more flexible than the method based on traditional video monitoring. And it has better counting and localisation performance and higher speed, which makes it possible to use PDNet in practice. In summary, this paper has three contributions:
We propose a new framework called PDNet, which uses point regression as the primary task and density map regression as the secondary task. Unlike STNNet, PDNet uses the number of targets located as the counting result.
We propose a new method for fusing features called DFF, which can build relationships between targets and their surroundings in multi-scale feature fusion stage. The principle of DFF makes it easier to detect small targets.
Due to the similarities between the density map and spatial attention, we propose a new spatial attention module called DMA. It doesn't require designing complex network structures and can point out target areas like other spatial attentions.
The rest of this paper is organised in the following structure. We present the related works in Section 2. In Section 3, we detail the proposed method. In Section 4, we report experimental results. Section 5 concludes this paper. Code of this paper will be released in https://github.com/cracknum/PDNet.
2. Related work
2.1. Density map-based methods
The most common supervised method in crowd counting is to employ the density map first proposed by Lempitsky and Zisserman (Citation2010), which sums up the prediction density map as the counting result. In recent years, the accuracy of crowd counting methods has been enhanced through network construction and density map innovations. Zhang et al. (Citation2016) employs a multi-branch network structure with different convolutional kernel sizes to address the scale variations of the crowd. Sam et al. (Citation2017) uses a multi-branch network like (Zhang et al., Citation2016), but the difference is that (Sam et al., Citation2017) includes a switch layer to determine which branch to generate the prediction density map. Li et al. (Citation2018) and Wang et al. (Citation2022) use dilated convolutions with different dilation rates to obtain deeper features and larger perceptual fields to adapt scale variations. Cao et al. (Citation2018) employs a multi-branch convolutional module at each stage to extract features at various scales and then uses deconvolutions to generate the predicted density map. Jiang and Jin (Citation2019) and Fan et al. (Citation2020) proposed improvement schemes for generating density maps in the feature extraction and loss supervised stages, respectively.
Because the density map represents the spatial distribution states of targets but does not care about the specific locations of targets, density map-based methods cannot provide accurate localisation information (Jiang et al., Citation2021; Liang, Xu, Zhu, et al., Citation2022; C. Liu et al., Citation2019). This problem is also explained in Bai et al. (Citation2020), Ma et al. (Citation2019) and L. Liu et al. (Citation2020). Therefore, the proposed method considers all targets as a points collection and then regresses them directly, which avoids the inherent drawbacks of density maps as intermediate representations.
2.2. Localization based methods
Due to the inherent inaccuracy of density map-based methods on crowd localisation, some researchers have proposed bounding box-based techniques (Basalamah et al., Citation2019; Y. Liu et al., Citation2019; Sam et al., Citation2021) for detection. Basalamah et al. (Citation2019) randomly annotates heads and then generates a scale map using the sizes of annotations. (Sam et al., Citation2021) uses the distance between the target and the nearest surrounding target to calculate the size of the pseudo bounding box. Y. Liu et al. (Citation2019) used the strategy as same as Sam et al. (Citation2021) to initialise pseudo bounding boxes and proposed an online update method to ensure the precision of pseudo bounding boxes. However, because annotations of the most recent datasets (Wang et al., Citation2021; Zhang et al., Citation2016) are points, these methods are not universal. Point-based regression algorithms (Liang, Xu, Bai, Citation2022; Song et al., Citation2021; Wen et al., Citation2021) have been proposed. These methods remove the intermediate representation and directly regress the location of objects. Song et al. (Citation2021) proposed the P2PNet, which is a pure point-based approach with no intermediate states to regress objects. Liang, Xu, Bai (Citation2022) presents KMO-based Hungarian method, which reconsiders label assignment from the standpoint of contextual instances rather than isolated examples. STNNet, a multi-task framework presented by Wen et al. (Citation2021), employs a density map-based sub-network for counting tasks and a point-based sub-network for localisation.
Not the same as existing methods, the proposed method treats the density map-based sub-network as an auxiliary network to provide information about the spatial distribution of targets for the point-based sub-network and treats the counting result as a by-product of the localisation task.
3. Proposed method
3.1. Network construction
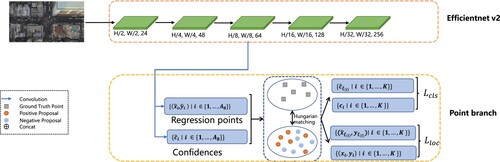
In this section, we detail our proposed model, PDNet, which includes five modules: backbone, DFF (Section 3.2), DMA (Section 3.3), density map branch (Section 3.4), and point branch (Section 3.5). Finally, we will introduce the loss functions of the density map branch and point branch (Section 3.6). The overall framework is shown in Figure .
Figure 2. Proposed Network Construction.
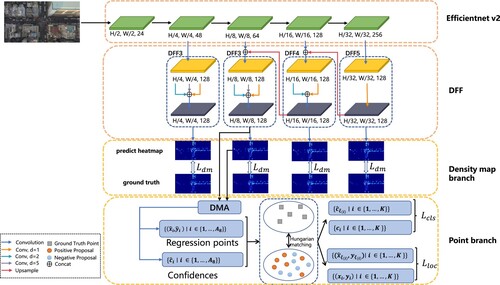
Firstly, We restructured the first 7 stages of EfficientV2-S as our backbone to generate multi-scale features, and the structure comparison between EfficientnetV2-S and our backbone is shown in Table .
Table 1. Stage comparison.
After inputting an image I with width and height
to the backbone for feature extraction, it produces the features
, where s represents downsampling stride. The width and height of
are
and
, respectively. The area of
is
and
, where
denotes the semantic information of the
region in the original image.
3.2. DFF
Aerial images have problems such as broad view and complex background, and using general spatial attention would introduce too much unnecessary correlated information and degrade the model's performance. Therefore, we hope to build an appropriate correlation between an object and its surroundings. On the other hand, the scale of target variations is another factor that affects the model's performance. To introduce relevant correlation information between the object and its surroundings and reduce the impact of scale variations on the network, we designed a feature fusion method based on FPN named DFF. The structure is shown in Figure .
DFF contains three sub-modules: DFF3, DFF4, and DFF5. DFF3 is a multi-branch structure composed of three convolutional layers with different dilation rates (1, 2, 5) and a
convolutional layer. Firstly, DFFx employs the multi-branch structure to extract multi-scale local contextual information, where x = 3, 4, 5. Secondly, DFFx adjusts the number of channels through the
convolutional layer after channel concatenation. Since DFF3, DFF4 and DFF5 are designed to adapt to different receptive fields, DFF4 and DFF5 are very similar in structure to DFF3. The difference is that the multi-branch structure of DFF4 uses two
convolutional layers with different dilation rates (1, 2), while DFF5 employs a convolutional layer with a dilation rate of 1 to replace the multi-branch structure.
Unlike Wang et al. (Citation2022) and Li et al. (Citation2019), they use parallel convolutional layers with different dilation rates to extract the multi-scale information of the features output from the last layer or Y. Liu et al. (Citation2020) uses the same set of dilated convolutional layers on the different sizes of features. We employ DFF3, DFF4, and DFF5 in different stages of FPN to adapt to the receptive field change.
3.3. DMA
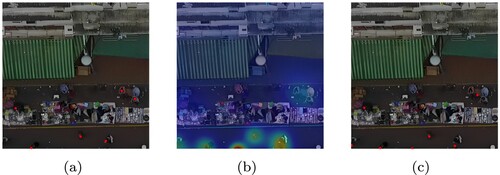
Density maps can illustrate crowd distribution and smooth point annotations. However, directly employing the heatmap to supervise the localisation task can not provide accurate positioning information. In Figure , (a) is the visualisation of the annotated points in the image, (b) is the visualisation of the density map converted from these annotated points using the density map generation method proposed by Zhang et al. (Citation2016), and (c) is the visualisation of the points after using the non-maximum suppression (NMS) on the generated density map. A comparison of (a) and (c) represents that some of the annotated points in (a) have disappeared. Therefore, only using the density map to supervise the localisation task cannot achieve better performance.
Figure 3. (a) is the visualisation of ground truth points, (b) is the visualisation of the density map generated from the points, (c) is the visualisation of the result after NMS on the density map.
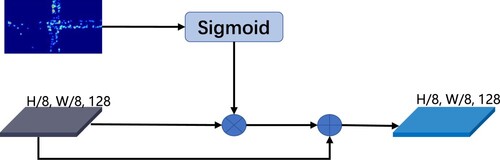
We need to rethink the meaning of the density map. CitationZhang et al. believe that the density map describes the spatial distribution of the crowd in a given image. And spatial attention mechanism in computer vision can be summarised as which parts we want the model to focus on. Therefore, the density map and spatial attention are similar. With this intuitive idea, we designed a plain module DMA, which uses a sigmoid function to map the predicted density map obtained from the density map branch to a range between 0 and 1 and then multiply the 8× feature map from DFF with it to highlight regions. Finally, add the above result and the 8× features element-wise to enrich the features. The structure of DMA is shown in Figure .
Figure 4. DMA module.
3.4. Density map branch
We employ the adaptive density map generation method proposed by Zhang et al. (Citation2016) to convert annotated points in an image to a ground truth density map. For each target in the image,
represents the average distance from
to nearest neighbours,
, thus the average distance from
to nearest neighbours is
. And the generation formula of each point is as follows:
(1)
(1) where
is the delta function,
is the two-dimension Gaussian function,
is the weighted average distance from
to nearest neighbours,
. The ground truth density map is represented as
, where
is the value of the ground truth density map.
To reduce the network performance degradation caused by the sharp reduction of the number of channels, the density map branch (DMB) is composed of four consecutive 3x3 convolutional layers. It can adjust the number of channels of features to generate density maps according to , where c is the number of channels of the features.
3.5. Point branch
We set up a reference point in the centre of the patch represented by
, thus, the size of reference points is
. All of the reference points could be represented as
.
For , we generate a prediction point
, so we have
prediction points. The set of prediction points is
. Each ground truth point is represented as
, and there are K ground truth points in total, so the set of ground truth points is
.
The Point branch contains a regression branch and a classification branch. Firstly, in the regression branch, we obtain the boosted feature map from DMA and then generate the offset
of a point. The offsets of all points are
. Then multiply
with coefficient α, and add it with the reference points R to obtain the coordinates of the proposed points, so the coordinates of
are
(2)
(2)
(3)
(3) Meanwhile, in classification branch, using the boosted feature map
to generate the confidences of proposed points
.
3.5.1. Match strategy
We use the match strategy proposed in P2PNet. After obtaining and
, we use the Hungarian matching algorithm to obtain 1v1 matching results. The calculation method of the matching matrix is as shown in formula (Equation4
(4)
(4) ). Finally, we get the optimal matching results
, positive proposals
and negative proposals
.
(4)
(4) where
is the distance matrix between predict points and ground truth points,
is the confidence value of individual,
.
3.6. Loss functions
3.6.1. DMB loss
Most of the existing estimation methods use the Euclidean loss function, which is defined as follows:
(5)
(5) where
is the predicted density map of the ith sample, N is the number of samples,
denotes the Euclidean distance.
In the density map estimation models, the better effect of density map generation, the higher performance can be achieved. Therefore, structural similarity (SSIM) (Wang et al., Citation2004) is used in this branch to measure the similarity between the predicted density map and the ground truth density map on the multi-scale. SSIM is defined as follows:
(6)
(6) where
and
are the local mean and standard deviations of predict density map
and ground truth density map
, respectively. And
is the local covariance of
and
.
and
are constant.
Thus, the loss of density map branch is defined follows:
(7)
(7) where
and
are the results of density map branch generated;
and
are the 4-fold down sampling, 8-fold down sampling, 16-fold down sampling and 32-fold down sampling of the ground truth density map.
3.6.2. Point loss
In this part, we will detail losses of regression and classification branches.
3.6.2.1 Regression branch loss function
We use MSE loss to measure the loss between ith predicted points set and ground truth points set
. It is defined as follows:
(8)
(8)
3.6.2.2 Classification branch loss function
The reference points system will introduce a large number of negative samples, which includes many hard samples. In order to overcome this disadvantage, we introduce the focal loss (Lin, Goyal, et al., Citation2017), which can be defined as follows:
(9)
(9) where
is the confidence of
of ith sample,
.
Therefore, the integrated total loss is as follows:
(10)
(10) where
4. Experiments
4.1. Evaluation metrics
4.1.1. Crowd localisation
We use the evaluation metrics proposed by Wen et al. (Citation2021), including L-mAP, L-AP@10, L-AP@15 and L-AP@20 to compare the localisation performance, where 'L' means localisation and the numbers represent the distance between the ground truth point and the prediction. Most of the calculation processes of these indicators are consistent with the AP of general object detection. But these indicators use the Euclidean distance as the criteria instead of the IoU. To fairly compare the performance of all models, we use the toolkit proposed by CitationZhu et al.
4.1.2. Crowd counting
We use the Mean Absolute Error (MAE) and Mean Squared Error (MSE) as evaluation metrics to compare the performance of PDNet and others on counting. These two metrics are defined as:
(11)
(11)
(12)
(12) where
is the number of
,
is the number of
.
4.2. Experiment setting
Our backbone uses pre-trained EfficientnetV2-S on ImageNet, and other convolutional layers use the default initialisation method of PyTorch. Inspired by ConvNeXt (Liu et al., Citation2022), we used AdamW (Loshchilov & Hutter, Citation2019) optimiser in model training and warm-up CosineLR-Scheduler (Loshchilov & Hutter, Citation2017) as the learning rate scheduler. In the preprocessing stage, we first use the adaptive method to generate a density map, and then the image and density map are cropped with the same uniform sampling distribution. After that, we obtained four 256*256 size patches of the image and four same size patches of the density map. In the test phase, we use 0.5 as the confidence threshold to filter prediction points. All of the experiments adapt PyTorch 1.10.0 framework and a single NVIDIA 3080ti GPU.
4.3. Dataset
DroneCrowd is a large crowd analysis dataset based on UAVs and can be used in crowd counting, localisation and tracking studies. It contains 112 video clips of 70 different scenes in 4 cities in China, totalling 33,600 frames. And it includes different target sizes (small, large), diversity of backgrounds (cloudy, sunny, night) and target density changes (crowded, sparse). Since the temporal information in the DroneCrowd dataset is not required for this study, we take one of every ten consecutive samples from the original training set. Finally, we get 2,460 images as the training set. In addition, we use the original testing set and validation set for performance evaluation. The statistical information of DroneCrowd is shown in Table .
Table 2. Statistics of each attribute in DroneCrowd.
4.4. Accuracy
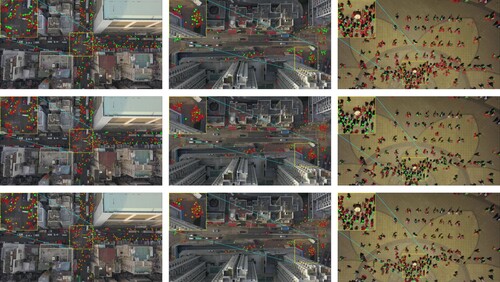
To demonstrate the accuracy of our method, we evaluated the counting and localisation performance on DroneCrowd and compared them with other state-of-the-art methods. For the model without localisation capability, we extract the peaks of its predicted density map as localisation points. And the visualisation of the localisation performances of P2PNet, STNNet, and PDNet is shown in Figure .
Figure 5. The visualisation of localisation results of P2PNet, STNNet and PDNet in cloudy, sparse and night scenes. The first row shows the visualisation of localisation results of STNNet. The second row shows the visualisation of localisation results of P2PNet. The last row shows the visualisation of localisation results of PDNet. The green dots represent ground truth points. The red circles represent predicted points.
4.4.1. crowd localisation comparison
As shown in Table , our method achieved 53.85% L-mAP, which is 13.4% higher than the second best STNNet, indicating that PDNet can produce more accurate localisation information. MCNN, CAN, CSRNet and DM-Count are density map-based methods, so their localisation results do not show better performance on localisation. Although P2PNet is slightly worse than STNNet and PDNet, it is also better than MCNN, CAN, CSRNet, and DM-count, which indicates that the point-based method is better than the density map-based method on localisation. The gap between L-AP@10 and L-AP@15 of P2PNet is relatively large, reaching 20.66%, which indicates that P2PNet cannot identify the features of small objects and handle the scale changes well. On the contrary, the difference between L-AP@10 and L-AP@15 of PDNet is only 4.28%, which also shows that PDNet is better than pure point-based methods in localisation, which also represents on STNNet.
Table 3. localisation performance compare.
4.4.2. Crowd counting comparison
As presented in Table , CSRNet, CAN, DM-count, and STNNet achieved the best counting results on some scenes, indicating that the density map-based method has better counting capability. Meanwhile, PDNet also achieved the best counting results in some scenarios. It represents the feasibility of studying the hybrid framework. The counting performance improvement of the hybrid framework is an important part of our future research.
Table 4. Crowd counting performance compare.
4.4.3. Discussion
Although PDNet achieved state-of-the-art counting performance in some scenarios, we find that PDNet is not competitive with STNNet in the night scene. As shown in Figure , due to obstacles such as the existence of shadows of targets and poor light at night, PDNet is unable to locate the target well. STNNet's counting result is obtained by summing the density map, which gives STNNet a better counting performance due to the density map's characteristics and the tracking self-network providing information on the pedestrian's trajectory.
4.5. Computation complexity
The goals of PDNet are to provide sufficient localisation and counting performance and higher inference speed. As shown in Tables and , the inference speed of MCNN is the fastest, reaching 28.98 fps, but it did not achieve better performance compared with several better models on localisation and counting performance, such as CAN, DM-Count, and STNNet. The reason is that the structure of MCNN is relatively simple, so the speed is relatively fast. Although STNNet achieves better counting and localisation performance and achieves the best results in some scenarios, its complex structure and three sub-networks lead to slow inference speed, so it's not practical. DM-Count also has a relatively high speed in counting with high counting accuracy, but its localisation accuracy is not good. PDNet not only has relatively high counting and localisation accuracy but has a high inference speed of 17.7 FPS. Therefore, PDNet is more practical.
4.6. Ablation experiment
To validate the effectiveness of modules proposed in PDNet, we conduct ablation experiments on DroneCrowd. In addition, we use the part of PDNet after removing the DFF, DMA and DMB as the base model named BM. And we use the 8× feature map to generate the prediction points and confidence. Figure is the structure of BM.
Figure 6. The base model architecture for ablation experiment.
4.6.1. Backbone selection
To get a network that has not only high counting and localisation performance but also high speed, we performed experiments using different backbones on BM, such as VGG16 (Simonyan & Zisserman, Citation2015), Resnet50 (He et al., Citation2016), Densenet161 (Huang et al., Citation2017) and EfficientnetV2-S (Tan & Le, Citation2021). For a fair comparison, because some models cannot get 32× features, such as VGG16, we copy its last downsampling layer and convolutional module as a 32× feature extraction module. As shown in Table , VGG16 and Densenet161 have achieved the best counting and localisation performance, but their inference speeds are far behind EfficientnetV2-S and the sizes of their parameters are much larger than EfficientnetV2-S. Although the inference speed of Resnet50 and EfficientnetV2-S are very close, the counting and localisation performances of Resnet50 are lower than that of EfficientnetV2-S. To sum up, the EfficientnetV2-S is the most suitable compared with others in our network.
Table 5. ablation experiment of backbones on BM.
4.6.2. Crowd counting
As shown in Table , we constructed four ablation experiments on crowd counting to demonstrate the effectiveness of our modules. After adding the DFF to BM, counting performance has improved in some scenes compared with BM, such as small and night scenes. That is because DFF established the association between the target and its surroundings and alleviated the flaw that can't extract available features. In the third experiment, we added DMB and DFF to BM. Compared with the results of the second experiment, the counting performance of the third experiment improved in all scenarios. It demonstrates that a multi-task learning approach through combining point regression and density map regression can improve the model's performance. We added DFF, DMB, and DMA to BM in the last experiment. The experimental result of the last one shows counting performance in overall, small, cloudy, crowded, and sparse scenarios achieved the best.
Table 6. ablation experiment of crowd counting.
4.6.3. Crowd localisation
As shown in Table , when we add the DFF, DMB and DMA modules to the base model BM one by one, the localisation performance is gradually improving in all metrics. It demonstrates the effectiveness of the our proposed modules.
Table 7. ablation experiment of crowd localisation.
5. Conclusion
In this paper, we propose a novel practical method for crowd counting and localisation based on the UAV called PDNet. It's a point and density map hybrid multi-task network. To introduce appropriate contextual information at different stages and motivated by the similarities of the density map and spatial attention mechanism, we designed DFF and DMA, respectively. Experimental results on a large UAV crowd analysis dataset, DroneCrowd, demonstrate that PDNet outperforms the state-of-the-art methods in terms of localisation metrics (L-mAP, L-AP@10, L-AP@15, L-AP@20) and improves the performance of counting. The inference speed of PDNet is also faster than most state-of-the-art methods.
Although PDNet has achieved the best results in localisation, there is still a gap in counting with STNNet in some scenarios, especially in the night scenario. We argue that is due to the tracking sub-network of STNNet, but the tracking sub-network of STNNet causes the inference speed becomes very slow. In future work, we hope to find a practical structure that not only provides the model with information about the trajectory of the target but also has a high inference speed.
Data availability
The dataset can be found in https://github.com/VisDrone/DroneCrowd.
Disclosure statement
No potential conflict of interest was reported by the author(s).
Additional information
Funding
References
- Bai, S., He, Z., Qiao, Y., Hu, H., Wu, W., & Yan, J. (2020). Adaptive dilated network with self-correction supervision for counting. In 2020 IEEE/CVF Conference on Computer Vision and Pattern Recognition, CVPR 2020 (pp. 4593–4602). Computer Vision Foundation/IEEE. https://doi.org/10.1109/CVPR42600.2020.00465
- Basalamah, S., Khan, S. D., & Ullah, H. (2019). Scale driven convolutional neural network model for people counting and localization in crowd scenes. IEEE Access, 7, 71576–71584. https://doi.org/10.1109/ACCESS.2019.2918650
- Cao, X., Wang, Z., Zhao, Y., & Su, F. (2018). Scale aggregation network for accurate and efficient crowd counting. In V. Ferrari, M. Hebert, C. Sminchisescu, & Y. Weiss (Eds.), Computer Vision – ECCV 2018 – 15th European Conference, Proceedings, Part V (Vol. 11209, pp. 757–773). Springer. https://doi.org/10.1007/978-3-030-01228-1_45
- Deb, D., & Ventura, J. (2018). An aggregated multicolumn dilated convolution network for perspective-free counting. In 2018 IEEE Conference on Computer Vision and Pattern Recognition Workshops, CVPR Workshops 2018, (pp. 195–204). Computer Vision Foundation/IEEE Computer Society. https://doi.org/10.1109/CVPRW.2018.00057
- Du, D., Wen, L., Zhu, P., Fan, H., Hu, Q., Ling, H., Shah, M., Pan, J., Al-Ali, A., Mohamed, A., Imene, B., Dong, B., Zhang, B., Nesma, B. H., Xu, C., Duan, C., Castiello, C., Mencar, C., Liang, D., … Zhao, Z. (2020). VisDrone-CC2020: The vision meets drone crowd counting challenge results. In A. Bartoli, & A. Fusiello (Eds.), Computer Vision – ECCV 2020 Workshops – Proceedings, Part IV (Vol. 12538, pp. 675–691). Springer. https://doi.org/10.1007/978-3-030-66823-5_41.
- Fan, Z., Zhu, Y., Song, Y., & Liu, Z. (2020). Generating high quality crowd density map based on perceptual loss. Applied Intelligence, 50(4), 1073–1085. https://doi.org/10.1007/s10489-019-01573-7
- He, K., Zhang, X., Ren, S., & Sun, J. (2016). Deep residual learning for image recognition. In 2016 IEEE Conference on Computer Vision and Pattern Recognition, CVPR 2016 (pp. 770–778). IEEE Computer Society. https://doi.org/10.1109/CVPR.2016.90
- Huang, G., Liu, Z., van der Maaten, L., & Weinberger, K. Q. (2017). Densely connected convolutional networks. In 2017 IEEE Conference on Computer Vision and Pattern Recognition, CVPR 2017 (pp. 2261–2269). IEEE Computer Society. https://doi.org/10.1109/CVPR.2017.243
- Huang, S., Li, X., Cheng, Z., Zhang, Z., & Hauptmann, A. G. (2020). Stacked pooling for boosting scale invariance of crowd counting. In 2020 IEEE International Conference on Acoustics, Speech and Signal Processing, ICASSP 2020 (pp. 2578–2582). IEEE. https://doi.org/10.1109/ICASSP40776.2020.9053070
- Jiang, H., & Jin, W. (2019). Effective use of convolutional neural networks and diverse deep supervision for better crowd counting. Applied Intelligence, 49(7), 2415–2433. https://doi.org/10.1007/s10489-018-1394-9
- Jiang, M., Lin, J., & Wang, Z. J. (2021). A smartly simple way for joint crowd counting and localization. Neurocomputing, 459, 35–43. https://doi.org/10.1016/j.neucom.2021.06.055
- Laradji, I. H., Rostamzadeh, N., Pinheiro, P. O., Vázquez, D., & Schmidt, M. (2018). Where are the blobs: Counting by localization with point supervision. In V. Ferrari, M. Hebert, C. Sminchisescu, & Y. Weiss (Eds.), Computer Vision – ECCV 2018 – 15th European Conference, Proceedings, Part II (Vol. 11206, pp. 560–576). Springer. https://doi.org/10.1007/978-3-030-01216-8_34
- Lempitsky, V. S., & Zisserman, A. (2010). Learning to count objects in images. In J.D. Lafferty, C.K.I. Williams, J. Shawe-Taylor, R.S. Zemel, & A. Culotta (Eds.), Advances in Neural Information Processing Systems 23: 24th Annual Conference on Neural Information Processing Systems 2010 (pp. 1324–1332). Curran Associates.
- Li, Y., Chen, Y., Wang, N., & Zhang, Z. (2019). Scale-aware trident networks for object detection. In 2019 IEEE/CVF International Conference on Computer Vision, ICCV 2019 (pp. 6053–6062). IEEE. https://doi.org/10.1109/ICCV.2019.00615
- Li, Y., Zhang, X., & Chen, D. (2018). CSRNet: Dilated convolutional neural networks for understanding the highly congested scenes. In 2018 IEEE Conference on Computer Vision and Pattern Recognition, CVPR 2018 (pp. 1091–1100). Computer Vision Foundation/IEEE Computer Society. https://doi.org/10.1109/CVPR.2018.00120
- Liang, D., Xu, W., & Bai, X. (2022). An end-to-end transformer model for crowd localization. CoRR. https://arxiv.org/abs/2202.13065.
- Liang, D., Xu, W., Zhu, Y., & Zhou, Y. (2022). Focal inverse distance transform maps for crowd localization. IEEE Transactions on Multimedia, 1–13. https://doi.org/10.1109/TMM.2022.3203870
- Lin, T., Dollár, P., Girshick, R. B., He, K., Hariharan, B., & Belongie, S. J. (2017). Feature pyramid networks for object detection. In 2017 IEEE Conference on Computer Vision and Pattern Recognition, CVPR 2017 (pp. 936–944). IEEE Computer Society. https://doi.org/10.1109/CVPR.2017.106
- Lin, T., Goyal, P., Girshick, R. B., He, K., & Dollár, P. (2017). Focal loss for dense object detection. In IEEE International Conference on Computer Vision, ICCV 2017 (pp. 2999–3007). IEEE Computer Society. https://doi.org/10.1109/ICCV.2017.324
- Liu, C., Weng, X., & Mu, Y. (2019). Recurrent attentive zooming for joint crowd counting and precise localization. In IEEE Conference on Computer Vision and Pattern Recognition, CVPR 2019 (pp. 1217–1226). Computer Vision Foundation/IEEE. https://doi.org/10.1109/CVPR.2019.00131
- Liu, L., Lu, H., Xiong, H., Xian, K., Cao, Z., & Shen, C. (2020). Counting objects by blockwise classification. IEEE Transactions on Circuits and Systems for Video Technology, 30(10), 3513–3527. https://doi.org/10.1109/TCSVT.2019.2942970
- Liu, W., Salzmann, M., & Fua, P. (2019). Context-aware crowd counting. In IEEE Conference on Computer Vision and Pattern Recognition, CVPR 2019 (pp. 5099–5108). Computer Vision Foundation/IEEE. https://doi.org/10.1109/CVPR.2019.00524
- Liu, Y., Shi, M., Zhao, Q., & Wang, X. (2019). Point in, box out: Beyond counting persons in crowds. In IEEE Conference on Computer Vision and Pattern Recognition, CVPR 2019 (pp. 6469–6478). Computer Vision Foundation/IEEE. https://doi.org/10.1109/CVPR.2019.00663
- Liu, Y., Yang, F., & Hu, P. (2020). Small-object detection in UAV-captured images via multi-branch parallel feature pyramid networks. IEEE Access, 8, 145740–145750. https://doi.org/10.1109/ACCESS.2020.3014910
- Liu, Z., He, Z., Wang, L., Wang, W., Yuan, Y., Zhang, D., Zhang, J., Zhu, P., L. V. Gool, Han, J., Hoi, S., Hu, Q., Liu, M., Pan, J., Yin, B., Zhang, B., Liu, C., Ding, D., Liang, D., … Cao, Z. (2021). VisDrone-CC2021: The vision meets drone crowd counting challenge results. In 2021 IEEE/CVF International Conference on Computer Vision Workshops (ICCVW) (pp. 2830–2838). IEEE. https://doi.org/10.1109/ICCVW54120.2021.00317.
- Liu, Z., Mao, H., Wu, C. Y., Feichtenhofer, C., Darrell, T., & Xie, S. (2022). A convnet for the 2020s. In Proceedings of the IEEE/CVF Conference on Computer Vision and Pattern Recognition (pp. 11976–11986). IEEE. https://doi.org/10.1109/CVPR52688.2022.01167
- Loshchilov, I., & Hutter, F. (2017). SGDR: Stochastic gradient descent with warm restarts. OpenReview.net. https://openreview.net/forum?id=Skq89Scxx.
- Loshchilov, I., & Hutter, F. (2019). Decoupled weight decay regularization. OpenReview.net. https://openreview.net/forum?id=Bkg6RiCqY7.
- Ma, Z., Wei, X., Hong, X., & Gong, Y. (2019). Bayesian loss for crowd count estimation with point supervision. In 2019 IEEE/CVF International Conference on Computer Vision, ICCV 2019 (pp. 6141–6150). IEEE. https://doi.org/10.1109/ICCV.2019.00624.
- Sam, D. B., Peri, S. V., Sundararaman, M. N., Kamath, A., & Babu, R. V. (2021). Locate, size, and count: Accurately resolving people in dense crowds via detection. IEEE Transactions on Pattern Analysis and Machine Intelligence, 43(8), 2739–2751. https://doi.org/10.1109/TPAMI.2020.2974830
- Sam, D. B., Surya, S., & Babu, R. V. (2017). Switching convolutional neural network for crowd counting. In 2017 IEEE Conference on Computer Vision and Pattern Recognition, CVPR 2017 (pp. 4031–4039). IEEE Computer Society. https://doi.org/10.1109/CVPR.2017.429
- Shen, Z., Xu, Y., Ni, B., Wang, M., Hu, J., & Yang, X. (2018). Crowd counting via adversarial cross-scale consistency pursuit. In 2018 IEEE Conference on Computer Vision and Pattern Recognition, CVPR 2018 (pp. 5245–5254). Computer Vision Foundation/IEEE Computer Society. https://doi.org/10.1109/CVPR.2018.00550
- Simonyan, K., & Zisserman, A. (2015). Very deep convolutional networks for large-scale image recognition. In Y. Bengio, & Y. LeCun (Eds.), 3rd International Conference on Learning Representations, ICLR 2015, Conference Track Proceedings. OpenReview.net. http://arxiv.org/abs/1409.1556
- Sindagi, V. A., & Patel, V. M. (2017). CNN-Based cascaded multi-task learning of high-level prior and density estimation for crowd counting. In 14th IEEE International Conference on Advanced Video and Signal Based Surveillance, AVSS 2017 (pp. 1–6). IEEE Computer Society. https://doi.org/10.1109/AVSS.2017.8078491
- Song, Q., Wang, C., Jiang, Z., Wang, Y., Tai, Y., Wang, C., Li, J., Huang, F., & Wu, Y. (2021). Rethinking counting and localization in crowds: A purely point-based framework. In 2021 IEEE/CVF International Conference on Computer Vision, ICCV 2021 (pp. 3345–3354). IEEE. https://doi.org/10.1109/ICCV48922.2021.00335
- Tan, M., & Le, Q. V. (2021). EfficientNetV2: Smaller models and faster training. In M. Meila, & T. Zhang (Eds.), Proceedings of the 38th International Conference on Machine Learning, ICML 2021, Virtual Event (Vol. 139, pp. 10096–10106). PMLR. http://proceedings.mlr.press/v139/tan21a.html.
- Wang, B., Liu, H., Samaras, D., & Nguyen, M. H. (2020). Distribution matching for crowd counting. In H. Larochelle, M. Ranzato, R. Hadsell, M. Balcan, & H. Lin (Eds.), Advances in Neural Information Processing Systems 33: Annual Conference on Neural Information Processing Systems 2020, NEURIPS 2020. Virtual. https://proceedings.neurips.cc/paper/2020/hash/118bd558033a1016fcc82560c65cca5f-Abstract.html
- Wang, Q., Gao, J., Lin, W., & Li, X. (2021). NWPU-crowd: A large-scale benchmark for crowd counting and localization. IEEE Transactions on Pattern Analysis and Machine Intelligence, 43(6), 2141–2149. https://doi.org/10.1109/TPAMI.2020.3013269
- Wang, W., Liu, Q., & Wang, W. (2022). Pyramid-dilated deep convolutional neural network for crowd counting. Applied Intelligence, 52(2), 1825–1837. https://doi.org/10.1007/s10489-021-02537-6
- Wang, Z., Bovik, A. C., Sheikh, H. R., & Simoncelli, E. P. (2004). Image quality assessment: From error visibility to structural similarity. IEEE Transactions on Image Processing, 13(4), 600–612. https://doi.org/10.1109/TIP.2003.819861
- Wen, L., Du, D., Zhu, P., Hu, Q., Wang, Q., Bo, L., & Lyu, S. (2021). Detection, tracking, and counting meets drones in crowds: A benchmark. In IEEE Conference on Computer Vision and Pattern Recognition, CVPR 2021, Virtual (pp. 7812–7821). Computer Vision Foundation/IEEE.
- Xu, C., Liang, D., Xu, Y., Bai, S., Zhan, W., Bai, X., & Tomizuka, M. (2022). AutoScale: Learning to scale for crowd counting. International Journal of Computer Vision, 130(2), 405–434. https://doi.org/10.1007/s11263-021-01542-z
- Zeng, L., Xu, X., Cai, B., Qiu, S., & Zhang, T. (2017). Multi-scale convolutional neural networks for crowd counting. In 2017 IEEE International Conference on Image Processing, ICIP 2017 (pp. 465–469). IEEE. https://doi.org/10.1109/ICIP.2017.8296324
- Zhang, Y., Zhou, D., Chen, S., Gao, S., & Ma, Y. (2016). Single-image crowd counting via multi-column convolutional neural network. In 2016 IEEE Conference on Computer Vision and Pattern Recognition, CVPR 2016 (pp. 589–597). IEEE Computer Society. https://doi.org/10.1109/CVPR.2016.70
- Zhu, P., Wen, L., Bian, X., Ling, H., & Hu, Q. (2018). Vision meets drones: A challenge. CoRR. http://arxiv.org/abs/1804.07437.
- Zou, Z., Su, X., Qu, X., & Zhou, P. (2018). DA-Net: Learning the fine-grained density distribution with deformation aggregation network. IEEE Access, 6, 60745–60756. https://doi.org/10.1109/ACCESS.2018.2875495