
 ?Mathematical formulae have been encoded as MathML and are displayed in this HTML version using MathJax in order to improve their display. Uncheck the box to turn MathJax off. This feature requires Javascript. Click on a formula to zoom.
Abstract
Most of the recent research has focused on the Internet of Things (IoT) and its applications. The open interface and network connectivity of the interconnected systems under the IoT network make them vulnerable to hackers. A model has been proposed to identify and classify IoT routing attacks. To generate IoT routing datasets, the Cooja simulator is used at first. The IoT routing dataset is then augmented into larger volumes using ADASYN, which is also used to solve the class imbalance problems. A deep learning hybrid model based on a Long-Short-Term Memory (LSTM) network and adaptive Mayfly Optimization Algorithm (LAMOA) was presented for the classification of IoT attacks. The adaptive MOA adjusts the weights in the various layers of the LSTM network and the Fully Connected Layer with SoftMax Classification. As part of the validation process, the proposed model was also compared with benchmark datasets NSL-KDD, BoT-IoT, and IoT-23. Using benchmark datasets, LAMOA achieved 99.94% accuracy for multiclassifications, 99.92% accuracy for binary classifications, and 98.42% accuracy for real-time datasets. Compared to other models, our proposed model significantly improves the accuracy of each attack's classification by 5–10%.
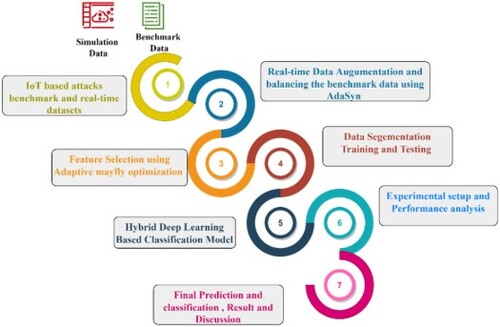
GRAPHICAL ABSTRACT
1. Introduction
IoT is the cornerstone for next-generation technologies. IoT application like Smart villages provide real-time data analysis and automating selection in agriculture, healthcare and education, transportation, environmental, and power, many wireless sensor devices use wireless internet, so they may not resist all assaults (Aljuhani et al., Citation2022). The IoT connects physical objects with individual identities and functions through the internet. Sensing, actuating, exchanging information, analysing and processing data are activities. The communication path should be safeguarded since the IoT collects critical data. Intruders potentially misuse network communications. A routing protocol is used by the nodes in the network to talk to each other. There are two types of routing in the IoT systems: proactive (using a dynamic path selection process) and reactive (sending nodes trigger the route discovery). RPL is an IPv6 routing protocol that is utilised in Internet of Things environments (Xin et al., Citation2022), RPL is considered to be part of the proactive group that actively searches for the route path. Using the RPL routing protocol in IoT led to sinkhole, Sybil, selective forwarding, black hole, hello flood, wormhole, rank, and version number attacks. The IoT connects physical objects with individual identities and functions through the internet. Sensing, actuating, exchanging information, analysing and processing data are activities. The communication path should be safeguarded since the IoT collects critical data. Intruders potentially misuse network communications. A routing protocol is used by the nodes in the network to talk to each other. There are two types of routing in the IoT systems: proactive (using a dynamic path selection process) and reactive (sending nodes trigger the route discovery). RPL is a routing protocol for IPv6 that is used in Internet of Things environments (Krishnaveni & Prabakaran, Citation2021), Low Power and Lossy Networks (RPL) are considered to be part of the proactive group that actively searches for the route path. Sinkhole, Sybil, selective forwarding, black hole, hello flood, wormhole, rank, and version number attacks happened when IoT devices used the RPL routing protocol.
DL algorithms have led to the development of long-short term memory networks (LSTMs) from recurrent neural networks (RNNs) as a model that can learn patterns in long sections. LSTMs can do this because they evolved from RNNs. It is possible to use LSTM networks to learn features and patterns in network data so that they can be used to classify them as either normal or attacked (Wu et al., Citation2022; Wang & Zhang Citation2022). LSTM is a DL (Deep Learning) algorithm, which means that it doesn't have to do as much work with features as classical machine learning because it works with raw data. That's also obvious from this: The LSTM network is hard to break into because attackers can't use feature learning algorithms to improve their own methods of breaking into it. The Internet of Things has a bunch of unstructured datasets, and LSTM is good at training on them. Most DL algorithms work with numerical datasets (IoT). Historical data could be used to look for attacks over time, because a single deep packet will not be enough to find patterns. People can feed the data packets to DL algorithms that can remember them for a long time. Unlike traditional machine learning, LSTM networks can be used to recognise attacks that happen over a long period of time, no matter how big the window.
The class imbalance problem is widespread, and various solutions have been recommended in recent years. This issue's solutions fall into three categories: Data, algorithms, and hybrid approaches Data level-methods, also called pre-processing strategies, reduce the majority-minority class imbalance. Upgrade traditional learning methodologies or create new ones that address imbalanced data. Hybrid methods combine data and algorithm levels. The SMOTE is a popular oversampling method. KNN algorithm for synthesising minority class observations (Wang et al., Citation2022b), to balance the data, more minority class findings are added. SMOTE arbitrarily creates synthetic observational data from minority class observations. The class boundaries between the majority and minority classes after applying SMOTE may not represent the minority class's underlying distribution. (Wang et al., Citation2022a) proposed ADASYN sampling as a solution. More synthetic observations are produced for harder-to-learn minority observations by the ADASYN algorithm (Sreeja, Citation2019).
In the year 2020, the Mayfly algorithm has been proposed as a newly designed swarm intelligence bioinspired algorithm. The Mayfly optimisation algorithm is inspired by the flight behaviour and the mating process of mayflies in real life. This algorithm is a modification of the particle swarm optimisation algorithm (Zervoudakis & Tsafarakis, Citation2020). We can use this algorithm to solve both continuous and discrete problems’ single-objective and multi-objective optimisation problems, as this algorithm is inspired by the flight behaviour and mating behaviour of mayflies.
1.1. Research motivation
The IoT-based data flow across the networks becomes the routine operation in any smart applications. Continuous monitoring and timely alerts are made through the IoT-based sensors and actuators. The sensing and transmitting the IoT data across the public networks open the number of security challenges. The open interfaces with unsecured network channels tamper the data flowing across the public networks. The high-level security framework needs to be established to protect the IoT data and its application domain. The vast range of IoT-based applications including smart network monitoring, Smart city environment, intelligent transportation, ecommerce applications, secure cloud platforms highly demand for the secure IoT framework instead regular security mechanism. The proposed LAMOA model classifies all-possible combinations of RPL-based attacks, which are identified as a major security threat for any IoT infrastructure. The model classifies the attacks using advanced mayfly optimisation techniques to enhance the IoT security framework. The implementation of LAMOA model with advanced DL-based optimisation motivates the digital infrastructure to utilise the framework in an effective manner. The IT operations rely on the digital data processing and its operations expanded to the next level of services without any severe security glitches. The proposed model possibly has a greater impact on the establishment of IoT-based applications and its services to the next level. The threat free IoT infrastructure with DL-based security classification improve the market of IoT-based solutions in the IT industry.
1.2. Industrial significant of the proposed model
IoT technology has greatly improved the industrial sector in terms of real-time remote monitoring and control, reducing latency, smart manufacturing, supply chain management, and asset tracking. The way in which industrial IoT devices are made, such as their low cost and security standards, open the space for the attackers to maliciously exploits the IoT infrastructure which reduces the security, privacy, and trust on this platform. As a special ingredient, the hybrid approach LAMOA is proposed to be able to predict and classify different types of attacks on IIoT solutions. The field of connecting IIoT with hyper-tuned LSTM with adaptive mayfly optimisation, which is called “intelligent” IIoT, has put in a significant amount of work on attack classifications. The proposed model enhanced the security in terms of attack classification at the IoT infrastructure level.
1.3. Background of the proposed model
In this section, an initial review of the Long Short-Term Memory, the Mayfly optimisation technique, ADASYN oversampling techniques, and the proposed deep learning models LAMOA are discussed. Similar related works are also discussed. In the field of academic research, RPL Routing threats are resource-intensive. Although IoT RPL routing assaults are successful, there is little research on calculating energy expenditure when identifying rogue nodes. This work will add to the literature with the methodologies presented and the successful attack prevention system suggested. Energy consumption computation while identifying malicious nodes has not been extensively studied. This study's techniques and suggested assault prevention strategy are innovative. the energy consumption computation of resources used during the detection of malicious nodes has been the focus of relatively few investigations. As a result, the approaches that are suggested and the successful attack prevention system that is advocated in this study will add something new to the existing collection of studies.
1.3.1. RNN
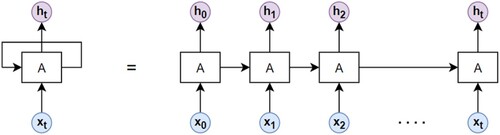
Recurrent Neural network (RNN) primarily used to process of time series data. This Neural Network includes a feedback loop that sends output of processed information back as an input at the next time step in the sequence (Hu et al., Citation2022). An RNN's ability to remember the outcomes of its previous computations and apply that knowledge to new problems is its primary point of differentiation from other types of neural networks. As a result, RNN models are well-suited for the task of modelling context dependencies in inputs of arbitrary length in order to generate an appropriate composition of the input. Which is the perfect fit for Natural Language processing applications as we are feeding a sequence of words into the RNN, the stage gets updated for each word being input. Since the state is changed sequentially, it also contains information about the words’ sequence as well as the words themselves. The final state of the RNN contains semantic and sequential information about the sentence's words, which really is great for understanding sentences since it operates like our brain. RNN have problem with vanishing gradient and Exploding gradient particularly avoiding these two issues go for LSTM Network.
1.3.2. LSTM
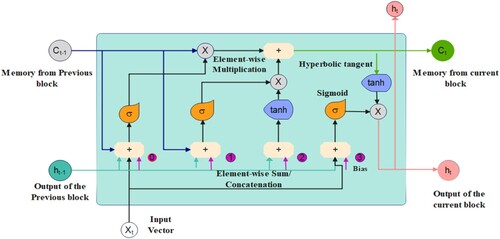
RNN is known as the long short-term memory or LSTM networks, Figure shown, LSTM also have this chain like a structure instead of having a single neural network layer, which contains gates that can allow or block information from passing by gates consists of a sigmoid neural net layer along with a pointwise multiplication operation. Sigmoid output ranges from 0 means don’t allow any data to flow to 1 means allow everything to flow. The subsequent tanh layer generates a vector of candidate values to be added to the state. In the subsequent phase, we will combine these two to generate a state update. It is time to update the previous cell state, Ct-1, to the new state, Ct. The previous phase has already determined what action to take; all that remains is to execute it. We multiply the previous state by root, ignoring the items that we opted to disregard earlier. Then we add it*Ct. This is the new candidate values, scaled according to the degree to which we decided to update each state value. Finally, we must determine what we will output. This result will be a filtered version of our current cell state. First, a sigmoid layer determines which aspects of the cell state will be output. Then, the cell state is multiplied by the sigmoid gate's output and tanh (to push the values between −1 and 1) so that only the desired portions are output. The first stage consists of deciding if the information gained from the previous timestamp should be maintained or if it is redundant and should thus be discarded. In the second step, the cell analyses the data that is provided to it in an effort to learn new knowledge. In the final phase, known as the third section, the cell passes the information that has been updated since the present timestamp to the subsequent timestamp. The name “gate” refers to each of these three components of an LSTM cell. The initial component is known as the Forget gate, the second component is called the Input gate, and the third and final component is called the Output gate (He et al., Citation2021).
Figure 1. Traditional RNN Model.
1.3.3. Mayfly optimisation
The Mayfly optimisation algorithm is modified by the particle swarm optimisation algorithm, and it also combines the advantages of evolutionary algorithms and swarm intelligence algorithms, forming a powerful hybrid algorithmic structure that can be used to solve both continuous and discrete problems. This algorithm was inspired by the flight and mating habits of mayflies. MOA benchmarked against seven high-quality meta-heuristic optimisation algorithms on 25 test functions (unimodal, multimodal, fixed dimensional), multi-objective optimum, The suggested method combines the benefits of swarm intelligence with evolutionary computation. To assess the proposed algorithm's efficiency, 38 benchmark functions, including 13 CEC2017 test functions, are used and compared to seven well-known metaheuristic optimisation approaches. The MA's efficiency is also evaluated using multi-objective optimisation and a discrete flow-shop scheduling issue. and a discrete traditional flow-shop scheduling issue. These functions test the method's use and exploration. The MA approach outperforms well-known metaheuristic optimisation algorithms in local and global searching. Early iterations usually provide the best overall result. MA's discrete and multi-objective optimisation results are good. Mayfly optimisation fits real-world challenges. Adaptive mayfly optimisation was utilised to optimise the deep learning model's hyperparameters.
Table
In step 1, we have the population initialisation, which will initialise the population for the male and female may flies in the problem space, so first initialise the population and velocity of the male mayflies in the problem space. Here you can see that step 4 for the male mayfly's position in the population is denoted with x (i). x is used to represent the position, and i is the total number of agents, or you can say the mayflies. Here i is one to population size, which means the position for the first mayfly is the same as for the second and so on. After that, in step 2, we will initialise the population for the female mayflies, and here is used to denote the position for the female mayflies in the problem space. You can see the velocity. After that, in step 3, we will calculate the fitness value for each mayfly, and every position represents the solution to the problem, so you can see Here First, we will initialise the population of the female and male mayflies randomly in the problem space, and then, using a cost function, or you can say, the objective function, we will calculate the fitness values and the performance. After that, we will select the best mayfly among all (i.e. step 4). When we calculate the fitness value for each mayfly, we will consider the minimum value among all of them as the global best mayfly. After that, in step 5, we will check the stopping criteria. If the math is correct, we will display the best solution that you obtained in the previous iteration. If the stopping criteria are not met, we will repeat the loop. After that, in step 6, we will update the position and velocity for both male and female mayflies. We can change the position by adding the velocity to the current position. As we know that the male mayflies gather in the swamp, we can change the position of the male mayfly by adding some velocity to the current position. So, you can see here, this is the grunt position, and you can see the velocity added. This is the new position that we obtained for the male mayfly. Here, x is the male mayfly. i is the male mayfly population. So, we use the velocity to represent the number. So, for velocity, step 7, we will use this mathematical model to calculate velocity; because they perform nuptial dances to attract female mayflies, it is assumed that they cannot develop great speed and move constantly, and as you can see, velocity for male mayflies can be computed using this Equation (Equation7(7)
(7) ). And this corresponds to p's best and g's best. And after that, as you can see here, we can update the pbest position using this. If the fitness value that we obtained for the new position is better than the old one, we will consider the new one. the neutral density coefficient, and here is the normally distributed random value. After that, step 8 we will update the velocity and position for the female mayfly. As we know, the female mayflies do not gather in the swarm, so they fly to where the male mayfly is in order to breed. We can change their position by adding some velocity to the initial position, so in the current position at some velocity. Now you can see this formula. We can calculate the velocity for the female mayfly if the fitness value of the female mayfly is greater than the male mayfly, then we will use this Equation (Equation8
(8)
(8) ). As you can see in the previous tab, step 9, we updated the position and velocity of the male and female mayflies before ranking them based on their fitness value.
We have the mutation phase, in which the mayfly is mated, and we will select the parents, one from a male and one from a female, in which the best from invested female breeds with the best male, and the second-best female breeds with the second-best male, and so on, as the first best female is attracted to the first best male. After the crossover, step 10, we will opt into offspring. As you can see here, l is the random value, and both male and female represent the male partner. After that, in step 11, we will evaluate the offspring and then we will create a merged population and keep the best male and female mayfly. step 12: If the current iteration is equal to the maximum number of iterations, then stop and display the best solution. step 13: Otherwise, repeat from step six.
1.3.5. Oversampling technique
Adaptive synthetic oversampling that is based on the samples of the minority class When compared to other data expansion algorithms, it is distinguished by the fact that it generates more instances in a feature space that has a lower density and fewer instances in a special space that has a lower density. This is in contrast to other data expansion algorithms, which generate more instances in a feature space that has a higher density. Because of this feature's advantage of adaptively shifting decision boundaries to difficult-to-learn samples, AdaSyn is more suitable than some other data augmentation techniques to manage internet traffic with extreme data imbalance (Bagui & Li, Citation2021). It is the nature of unbalanced learning that a classifier's decisions are influenced by the extreme minority-majority ratio. According to many evaluation metrics, classifiers have a low detection rate of minority classes. This is not to say that classifiers cannot learn from unbalanced datasets
Choose N and β, which denote the number of nearest neighbours and the desired level of class balance after generating the synthetic data, respectively. then
Step 1: Let
denote the number of observations of the majority class and let
Step 2: Let
A denote the set of all
Step 3: Calculate the Euclidean distance between
Step 4: Let
Step 5: Define
Step 6: Normalize
Step 7: Calculate
Step 8: Randomly sample
Step 9: Let
Step 10: Stop
1.4. Contribution of the research work
The article's main focus is to build a secure IoT-based infrastructure that can predict and classify different types of attacks in various situations (Stellios et al., Citation2022). In this case, a new deep learning framework called LAMOA has been used. Furthermore, a lot of tests have been done on the proposed learning algorithm with different benchmark tests and real-time Cooja data. Our suggested technique can identify most IoT threats and discriminate between benign and malicious traffic data. The experimental outcomes reveal that our proposed layered deep learning method outperforms current classification algorithms in real-time problems. Furthermore, the paper discusses how to get information and make features that make it easier to predict and classify threats.
In order to solve the problems of effective attack classification and exploding gradients in the LSTM neural network, we implemented the Adaptive Mayfly algorithm. This algorithm allowed us to determine the hyperparameter optimal value of the initial input weights, recurrent weights, and bias of the LSTM model, as well as the input weights and biases of the feed-forward connected layer in the RNN model, which led to a high level of accuracy in the attack classification.
A hybrid model was developed using the improved LSTM technique combined with metaheuristic algorithms such as GA and PSO, Mayfly.
To increase the size of the IoT RPL routing dataset, we used the data augmentation (ADASYN) technique.
Through LAMOA, we identify the energy impacts of IoT RPL routing attacks to reduce power consumption.
The hybrid LAMOA global optimisation was combined with training the LSTM with Adam optimiser locally to improve attack classifications.
To collect real-time data, we use the Contiki-OS Cooja Simulator for designing the IoT infrastructure.
We compare the multiclass and binary class classification performance with benchmark datasets, namely BoT-IoT, NSL-KDD, and IoT-23.
The suggested plan was evaluated and contrasted with a number of other methods that were already in use. In addition, the statistically significant correlation analysis for attack classification was carried out on all simulation dataset and three separate benchmark datasets.
This article is followed by Section 2, which summarises the related works of the IoT network classification models’ recent research papers and discusses the background part, where detailed, given the traditional techniques of the proposed model. Section 3 discussed the methodology of my proposed work algorithms for Cooja simulation setup and data collections, ADASYN oversampling techniques, LSTM, adaptive mayfly optimisation method, and overall flow diagram. Section 4 discussed the results and discussion of my pre-processing and features and simulation attacks based on the power consumption of all performance metrics and gave the detailed three benchmark datasets results with comparative analysis with existing models. Finally, Section 5, which brought this paper to a conclusion.
2. Literature survey
This paper develops an anomaly-based IoT intrusion detection methodology. First, a CNN creates a multiclass classification model (Ullah & Mahmoud, Citation2021). CNN in 1D, 2D, and 3D implement the suggested paradigm. BoT-IoT, Network Infrastructure Breach, MQTT-IoT-IDS2020, and IoT-23 network security datasets were used to test the proposed CNN model. Using a CNN multiclass pre-trained models, domain adaptation implements binary and multiclass classification. Since the model must study anomaly detection utilising several deep learning approaches, such FFN and LSTM, BI-LSTM, and compare the results to a CNN model (Ullah et al., Citation2021). A model for anomaly-based attack detection in Internet of Things systems is proposed and implemented in this research. The model makes use of a CNN and GRU to identify and categories binary and multiclass Internet of Things network data. The developed framework is verified by utilising the BoT-IoT dataset (Kumar, Tripathi, & Gupta, Citation2021d) the IoT Network Intrusion dataset, the MQTT-IoT-IDS2020 dataset, and the IoT-23 dataset. owing to the fact that they have to concentrate on real-time cyberattacks applying a number of different deep learning models and generative adversarial networks, and then compare the findings to the model that is currently being used. Xiu Kan et al. (Citation2021) proposed a unique APSO-CNN system detects multi-type attacks performed by zombie hosts infected by zombie viruses. Dynamic hyper-parameters of each keras layer structure are used as particle location parameters, and CNN's initial training period cross-entropy loss function value is used as APSO fitness. By adjusting the particle swarm's velocity and direction, optimal scheduling searches for a smaller fitness value. The inertia weight factor is adaptively altered with fitness value to avoid PSO local parameter problems and achieve CNN structure parameters. In addition, picking a high variety of attributes may cut down on the amount of time needed to train the model, and those responsible for the off-line model need to find a way to cut down the amount of time spent looking for the optimal solution.
Iterative Genetic Algorithm generates optimal individuals. DBN can analyse complex, high-dimensional data effectively and classify it well (Zhang et al., Citation2019). In this paper, the adaptive genetic algorithm is integrated with deep belief networks. GA runs numerous iterations to generate an ideal network topology, which DBN uses to identify attacks. So, when employing deep learning techniques for malware detection, the challenge of how to find a suitable neural network structure is solved, improving classification accuracy, generalisation, and overall network complexity. The model classification accuracy is 99.45%. Models and methods were simulated and evaluated using the NSL-KDD dataset. However, they do not utilise the optimisation to improve the other parameters of the deep network, hence reducing the amount of time spent training and enhancing the accuracy of detection.
Bovenzi et al. (Citation2020) propose H2ID, a hierarchical Network Intrusion Detection method with two stages. H2ID uses a new lightweight solution is based on a Multi-modal Deep AutoEncoder (M2-DAE) to find anomalies and soft-output classifiers to sort attacks. We test our idea by looking at the recently released Bot-IoT dataset and making connections between four relevant types of attacks (DDoS, DoS, Scan, and Theft) and unknown attacks. Results indicate improvements of the proposed M2-DAE for simple intrusion detection system (up to 40% false-positive rate when measured with several baseline methods that had the same true positive rate) and also for H2ID as a whole when tried to compare to the finest misuse sensor strategy (up to +5% F1 score). As a result, only denial-of-service and distributed denial-of-service attacks are considered. There is a further need to explore the implementation of a particular use case with various attacks (Nascita et al., Citation2021). Deep Learning (DL) approaches have recently developed as an alternative to ML techniques focused on arduous, time-consuming model is characterised. However, DL models’ black-box nature limits their practical and trustworthy deployment in important circumstances where serviceability of outcomes is essential. XAI approaches have lately gained popularity to overcome these restrictions. We study trustworthiness and interpretability using XAI-based algorithms to comprehend, evaluate, and enhance multimodal DL traffic classifiers. Alkahtani and Aldhyani (Citation2021) developed a comprehensive framework for identifying IoT intrusions. They generated a novel dataset called IoTID20 dataset was used to develop the proposed solution. In this architecture, three different learning algorithms were used to classify the attack: a CNN, an LSTM, and a CNN-LSTM hybrid model. To improve the suggested system, key network dataset features were selected using particle swarm optimisation (PSO). Learning based algorithms analysed variables. CNN achieved 96.60% accuracy, LSTM 98.62% accuracy, and CNN-LSTM 98.80% accuracy. As a result, they do not make an effort to discover new methods that might increase the detection of scan and TCP flood assaults (Mohamand et al., Citation2022).
This work employed machine learning to anticipate DDoS attack types. Random Forest and XGBoost were utilised. To access the research's DDoS prediction system. Python was used as a simulator for the UNWS-np-15 dataset from GitHub. We created a confusion matrix after applying machine learning models to evaluate model performance. In first classification, Random Forest's Precision (PR) and Recall (RE) are 89%. This model's AC is 89%, which is excellent. In the second categorisation, both Precision (PR) and Recall (RE) are 90% for XGBoost. Our model's AC is 90%. By comparing our work to prior studies, they increased fault detection accuracy by 85% and 79%. However, it’s crucial to develop a user-friendly, faster alternative to deep learning computations that produces better outcomes in less time (Dasgupta & Saha, Citation2022). This research suggests a hybrid Mayfly apriori-intrusion detection technique for big data applications. Mayfly-optimised Apriori is employed to identify intrusions in the suggested mechanism. In the suggested approach, network information is analysed to build an apriori rule based on the most frequently occurring items. Rare items or transactions are considered intrusions. The recommended mechanism's efficacy is compared to AI, Random Forest, K-Nearest Neighbour, and SVM. The proposed mechanism has improved accuracy, precision, and recall to 97%. However, they also need to compare the proposed model with other optimisation techniques.
Iterative Genetic Algorithm generates optimal individuals (Alferaidi et al., Citation2022). DBN can analyse complex, high-dimensional data effectively and classify it well. In this paper, the adaptive genetic algorithm is integrated with deep belief networks. GA runs numerous iterations to generate an ideal network topology, which DBN uses to identify attacks. So, when employing deep learning techniques for malware detection, the challenge of how to find a suitable neural network structure is solved, improving classification accuracy, generalisation, and overall network complexity. The model classification accuracy is 99.45%. Models and methods were simulated and evaluated using the NSL-KDD dataset. However, they do not utilise the optimisation to improve the other parameters of the deep network, hence reducing the amount of time spent training and enhancing the accuracy of detection (Cai et al., Citation2022). Author proposed a hybrid parallel deep learning model (HPM) for finding intrusions that work well and is based on margin learning is proposed. First, HPM builds two CNN architectures in parallel and combines the spatial features that come from full convolution. Second, two parallel LSTMs are used to separate the temporal information of the combined features. After global convolution and global pooling, the extracted spatial–temporal features are then fed into the CosMargin classifier to find the classification. Also, this paper suggests a better method for extracting traffic features, which not only cuts down on redundant information but also speeds up the speed at which the network converges. In the experiment, our HPM was able to spot each malicious class 99% of the time. However, the model has a very high accuracy rate for classifying, all of its performance is based on two assumptions: a huge number of datasets that have been classified and known attacks only (Wang et al., Citation2022b; Kumar, Tripathi, & Gupta, Citation2021e). This article suggests a network abnormality detection approach that combines principal component analysis and single-stage headless face detector algorithms. PCSS uses the PCA algorithm in the pre-processing of data to get rid of redundant data that could cause problems. At the same time, PCSS also combines feature fusion and SSH to enhance the features that are extracted from data that isn't clear, which speeds up and improves the accuracy of detection. In this paper, simulation tests are done with the IDS2017 and IDS2012 data sets. it can't fulfil the demands of detecting new network traffic that isn't normal and doesn't scale well. It might even be called a training data set by mistake. Considering how important traffic flows detection is in the real world, it is important to design a network model that can automatically discover new kinds of attacks in the network environment. However, the PCSS framework will be enhanced to make it more useful and important in terms of defending against different kinds of cyberattacks.
(Churcher et al., Citation2021 (Islam et al., Citation2022). For predicting DDOS attacks, we have used more than one way to classify things. Authors have made the architecture of generic models a little more complicated so that they can work well. Authors have also used the support vector machine (SVM), the K-nearest neighbour algorithm, and the random forest algorithm. For detecting (DDoS) attacks, the SVM is 99.5% accurate, while KNN and RF are 97.5% and 98.74% accurate, respectively. However, this model only works with offline datasets, so author want to work with real-time datasets, we need to start moving this work to real-time fraud detection applications that are focused on such supervised learning models (Samy et al., Citation2020). This research offers a distributed, resilient, high-detection-rate method to identify IoT cyberattacks using DL. Due to fog nodes’ decentralised nature, high computing capability, and proximity to edge devices, the proposed framework includes a threat detector. Six DL models are compared to find the best. All DL models are assessed using five datasets with distinct attacks. The LSM significantly achieves the other five DL models, according to experiments. The suggested framework is successful in response time and high detection, detecting different forms of cyberattacks with 99.97% high detection and 99.96% detection accuracy in classification model and 99.65% detection rate in multi-class classification. But it may be hard to label the data collected in the edge layer so that the LSTM model can be trained in the cloud. The author should use a decentralised computer network like Apache Spark and various datasets to evaluate the proposed attacks with unsupervised DL models and reinforcement learning.
The author presents a new algorithm to detect DDoS attacks based on changes in traffic and two machine learning models for identifying and classifying DDoS attacks (Jia et al., Citation2020). To show how well the two machine learning models work, we use the DDoS simulators BoNeSi and Slow HTTP Test to make a large data set and combine it with the CICDoS2019 data set to examine the precision of detection and classification in addition to the models’ performance. Our findings indicate that the proposed long-term poor memory has an identifying accuracy of up to 98.9%, which is much better than the other four well-known learning mentioned models in the most related research. The proposed convolutional neural networks are good at classifying things up to 99.9% of the time (Otoum et al., Citation2022). Propose a DL-IDS to detect security concerns in IoT contexts. Many IDSs exist, however they lack optimal feature learning and data set management, which affects attack detection performance. Our suggested module integrates spider monkey optimisation (SMO) and stacked-deep polynomials network (SDPN) to perform effective tools identification; SMO picks the ideal features in the data sets and SDPN classifications the data as normal or anomalies. DL-IDS detects DoS, U2R, probing, and R2L attacks. The suggested DL-IDS provides superior accuracy, precision, recall, and F-score. However, need to analyses DL-IDS with Naive Bayes, decision tree, and random forest using KDD-99 and UNSW-NB 15.
Author work uses the Bot-IoT dataset to develop a new Intrusion Detection System based on Machine Learning and Deep Learning models (Almaraz-Rivera et al., Citation2022). It does this by addressing the Bot-IoT dataset's problem of class imbalance. To figure out how the timestamps of the records affect the predictions, we used three different feature sets for binary and multiclass classifications. This helped us avoid feature dependencies, which were made by the Argus flow data generation system, while getting an average accuracy of >99%. Then, we did a lot of testing, which included measuring how well the models worked over time. The Decision Tree and Multi-layer Feed – forward neural models have been the best at finding DDoS and DoS attacks over IoT networks. However, the model needs to work with advanced method for the classification (Salman et al., Citation2022). Author suggests a framework that will help identify IoT devices and find malicious activity. This framework pulls features from each network flow to find the source, the type of traffic it creates, and network attacks. It does this by pushing intelligence to the edges of the network. Several machine learning algorithms are put up against random forest to see which one works best: Up to 94.5% accuracy for figuring out what kind of device it is, up to 93.5% accuracy for figuring out what kind of traffic it is, and up to 97% accuracy for finding strange traffic. However, the model needs to work with advanced method for the classification.
LSTM and GAT were used to come up with a new inductive model for classifying text (Wang & Li, Citation2022). Each text has its own structural graph, which changes the problem of putting texts into groups into a problem of putting graphs into groups. Our model takes into account the word order and syntax of the text and can build edges without being limited by the distance between words. At the same time, the graph attention network reduces the effect of noisy data and gives more weight to important words. Experiments with multiple datasets show that our model works. It can learn inductive representations of words from a small number of labelled documents and uses a lot less memory than other models. However, need to look on graph-aware text classification algorithms that don't rely on training data or leverage what little specific information needs they have to their advantage (Kumar, Tripathi, & Gupta, Citation2021a). Proposed a new intrusion detection framework called P2IDF for software-defined Internet of Things-Fog network activity that is based on protecting privacy. First, to protect privacy, an SAE method has been used, which changes real data into a coded form to stop inferential attacks. Then, an ANN-based intrusion prevention system was tested to see how well it could spot attacks and normal vectors in the ToN-IoT dataset before and after the transformation. They plan to Build a platform prototype that checks security and privacy in real-time, SDIoT-Fog in future (Mirsky et al., Citation2018). While in train mode, Kitsune believes that all approaching traffic is of a beneficial nature. As a result, an opponent that has already existed could be able to avoid being discovered by Kitsune. Nevertheless, while Kitsune is operating in the execute mode, it will identify fresh assaults and new dangers as they come into play. However, when installing Kitsune on a network that could already be hacked, a user should be conscious of this danger anyway.
Table provides an overview of my related research work using machine and deep learning models, datasets, classification, models, data imbalanced techniques, and accuracy, finally given the limitations of each paper.
Table 1. Summary of related research using machine and deep learning models to classify IoT attacks.
3. Methodology
3.1. IoT-based simulation infrastructure
This part talks about the proposed model, which is made up of units for collecting data, extracting features, classifying data, and proposing learning models. A high-level overview of the LAMOA-based intrusion detection and mitigation systems is presented in Figure . To simulate Internet of Things networks in real time, the first layer of the framework makes use of media access control (MAC) identifiers. A data collection unit is located at the second level, and it is responsible for gathering network packets under both normal and attack scenarios. The third layer uses adaptive synthetic-based pre-processing using the feature extracted data from the AMOA and the proposed deep learning technique for threat prediction were trained using the pre-processed data in order to provide accurate predictions. The LAMOA networks were finally utilised to make the final prediction of malicious nodes as one of five serious assaults. The system uses this information to identify a malicious or benign node. The suggested architecture uses message forwarding in order to warn all network nodes of the impending attack.
Figure 2. General LSTM Structure.
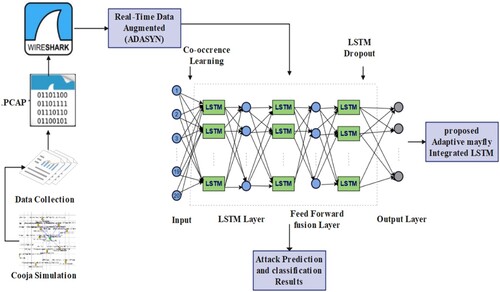
This work proposes a strategy for detecting and identifying attacks in resource-constrained IoT environments. Figure shows the model's general architecture. The suggested model includes network simulation, data balancing, data pre-processing, and attack detection and classification. Cooja simulates the network, malicious and normal nodes alike. Each node's is calculated. The routers’ message packets are intercepted and analysed. All simulated data is stored in a.csv file. The specified features (ID number, and processing times) are stored in a csv data entitled “RPLattack.log”. ADASYN-LAMOA Deep learning methods examine the normalised data set to increase performance.
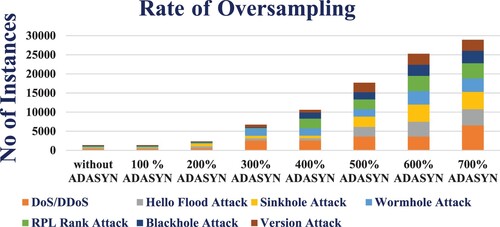
3.2. ADASYN oversampling techniques
The minority class is represented by (i) instances, and k-means is the number of the closest neighbours. Each epoch is being oversampled at a variable pace in seven studies. The resulting dataset will be multiplied by four for each experiment. The version attack is the minority group compared with all other classes: DDoS/DoS, wormhole, blackhole attack, RPL Rank exploitation, flooding, sinkhole. The number of versions attacked expanded from 120 to 708 after the first experiment was done, utilising 100% oversampling. In the first experiment, the blackhole and wormhole classes were found to be lower than the rest. As a result, results from the second experiment have been applied to those from the first experiment. Blackholes, hello flooding, sinkholes, DDoS, and DoS have been oversampled by a factor of 200% in this experiment. The number of incidents of DDoS and DoS increased by 400–5780. The number of HF and blackhole events grew from 172 to 1580 and 148 to 1250, respectively, in the second experiment. The last experiment's findings showed that the RPL Rank class had fallen to the lowest rung of the social ladder. Because of this, the third experiment should be carried out at a sample rate of 300%. In 180 to 1875 instances, the RPL Rank attack class was added. The third test proved that the number of occurrences in the RPL Rank and DDoS classes grew far more than the other classes’ numbers had done. As a result, the remaining experiments must be completed as soon as possible. The number of wormhole and version attacks increased dramatically in the fourth experiment with 400% oversampling. Then there were 250 sinkhole and 165 wormhole attacks, totalling 2580 and 1758 instances. In this experiment, DDoS were found to be in the minority when compared to the other classes. Oversampling by 500% was the final test, and the results are in. An extensive investigation has revealed that the most common types in the RPL, wormhole, and DDoS/DoS classes are larger instances. In addition, the frequency of all attacks increased by 600% and 700%. In total, 36,626 instances were formed from 6893 during the studies. Thus, the routing dataset has grown. The results of the experiments are shown in Figure .
Figure 3. Cooja simulation based AMILSTM Framework.
3.3. Attack classification model using LAMOA
The deep learning architecture is characterised by (Shekhar, Citation2021) Its important features are shown in the Figure and the hyper-parameter Table detailed below.
Figure 4. IoT Attack Classification using Realtime Datasets.
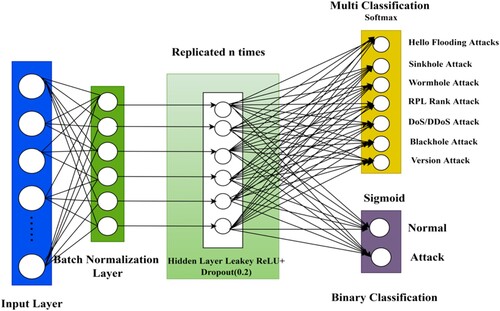
Table 2. Hyper-parameter for LAMOA model.
Input Layer: The beginning of entrance into the networks, which includes as many nodes as there are features to examine.
Batch Normalisation Layer: effective for improving neural network training, as it speeds up training and allows complex learning rates and saturation of probable nonlinear effects to be adopted. useful for neural network training. Because the network's gradient propagation is always the same, this usually leads to better accuracy when validating and testing.
Number of Hidden Layers: The hidden layers have varying numbers of artificial activation functions that output the weight value of their inputs after being activated with a Leaky ReLU activation function. We did a series of tests to see how the overall performance changed with different numbers of hidden layers.
Dropout Layer: Following on from the preceding layer, we viewed this layer as an integral part of the whole. In fact, in the above-mentioned trials, the pair hidden layer dropout layer was reproduced multiple times. In order to avoid overfitting, the dropout layer employs a regularisation approach called the Gaussian dropout, which randomly disables some neurons in a layer. Each node in the connected hidden layer has a 0.2% chance of having the same probability.
Output layer: This layer is in charge of figuring out the final classification, and it has the same number of nodes as the total number of classes. In Figure , we present two distinct output levels because the binary classifier issue and the multi-classification issue are represented by those layers in their respective ways. Nevertheless, when we were running our tests, we only evaluated for every problem one of the two output layers that were presented at a time. This was a dense layer that used a SoftMax function for the layers.
Figure 5. Mayfly solution representation.
3.4. Computational complexity AMOA
In most cases, the time required to complete an algorithm is proportional to the number of individual operations that it performs, including such addition, simple arithmetic operations. It is assumed that the number of mayflies in the AMOA algorithm is N, that the number of genetic offspring mayflies is M, and that the total of adaptive mayflies is k. The time complexity of the algorithm is evaluated in accordance with the following the method The time required to initialise all of the different parameters only requires one execution, which brings the total number of executions to one It is necessary for the mayfly population to carry out N processes so that the initial positions and velocities of the male and female mayflies can be randomly determined the time complexity of
It is necessary to update both the speed and position of the male and female mayflies, as well as the number of executions, which must be N times for each
The current mayfly fitness value is used to sort the number of executions, which results in the following
. In accordance with the Gaussian mutation method, the offspring of the mutation are produced at random and then carried out
times
Continue the procedure of separating the males and females of the mayflies, and use the superior solution to replace the one you were using before. The total number of executions are
The balance between global search and local search is done N times, so the time complexity is N,
Within the predetermined search radius in a given region, k adaptive mayflies are located, and k total executions are carried out
The number of executions is k times as large as the search range, which is there to ensure that the elite mayfly doesn't go looking in unexplored areas
N times the number of executions is required to determine if the maximum number of iterations has been achieved
. The adaptive mayfly's position is factored into the process, and there is only one execution
. When all of that is done, the AMOA algorithm's computation time after NC rounds is
(5)
(5)
3.5. Adaptive LAMOA
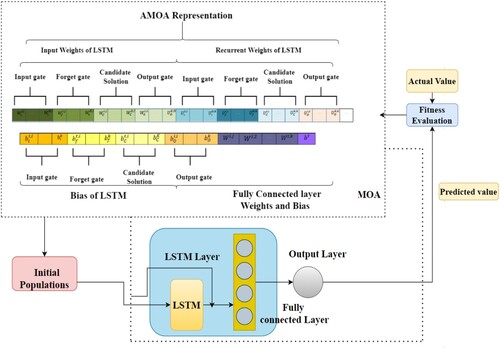
In this work, we want to employ the Adaptive Mayfly optimisation algorithm to find the best biases and weights for LSTM. There are many hyper-parameters to think about when making an LSTM, and there are numerous ways to make an RNN. In this research, we looked at a LSTM with one input layer with a batch normalisation and variable number of hidden states with dropout layer, one output layer all was linked to the input layers. AMOA is used to change the initial biases and weights of a forget gate, input gate, candidate solution vector, and output gate of LSTM, in addition to the bias and weights between both the completely connected layer and also the output layer. Figure shows the main structure of the proposed adaptive Mayfly-based hybrid LSTM model. AMOA is made up of so many steps, as shown in Figure . These steps are encoding, initialisation, calculate the fitness function, Find the and
evaluation, and update.
Figure 6. LAMOA Iterative LSTM network parameter evaluation.
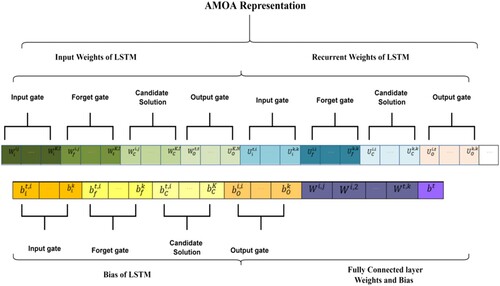
In processes based on swarm intelligence, showing possible solutions represents the most important step. In this work, possible solutions are presented by encoding the LSTM weights and biases as swarm mayfly. Input weights (), recurrent weights (
), and bias are the three types of weights that can be changed in an LSTM network are input activation state weight
= [
],
= [
] and B = [
]. The matrices are made up of the weights of the input gates, the weights of the forget gates, the weights of the cell candidates, and the weights of the output gates. The variables of are shown by the weight training matrix “W” and the bias “b”. Figure shows how each “spring” in the MOA represents a “potential solution” for the LSTM parameters that need to be optimised.
Figure 7. Overall Flow of activities on proposed LAMOA Model.
The initial value for a particle's velocity, denoted by the notation , is zero. Mayfly's execution depends on setting a variety of parameters, including the overall population of the swarm (S), the total number of iterations (maxGen), the individual coefficient (
), the social ratio (
), and the inertia coefficient (
). To contrast the adaptive MAO suggested here with conventional MOA, we will employ the inertia factor x, which varies linearly from
to
with time.
(6)
(6) where
is the iteration number at the moment and
is the maximum number of iterations that can be performed.
3.5.1. Evaluation
The effectiveness of each population solution is determined by computing the cost function, or mean squared error between the real and predicted values (see Figure )
Since we have samples of data where
is the desired value that should be achieved with the help of feature
as input. Fitness's opportunity cost function is described below:
(7)
(7) where
represents the total of observations,
is indeed the input weight,
is the recurrent weight,
is the bias, and
and
are the weights and biases assigned to LSTM and Feed forwarding FCLSC, respectively, and
is the predicted value of input
from LSTM's output layer. AMOA iteration t's output.
3.5.2. Update
Each mayfly fitness is used to determine its “Position best”, and the “global best”, is the best position occupied by any mayflies within the swarm. Pbest and Gbest are both optimised with each iteration, and the location and velocity of mayflies are adjusted accordingly.
Let the velocity and position of the mayfly at epoch
be denoted by the notations
and
, respectively. The equations then cause changes to take place in the velocity
and the location
of the ith mayfly at the epoch
. Equations (10) and (11) in their respective positions.
(8)
(8)
(9)
(9)
We employ the velocity of the adaptive mayfly that is considered to be both the personal best and the global best in order to preserve the exploitation and exploratory features of Adaptive mayfly.
The formula for the adaptive inertia coefficient is as follows:
(10)
(10) where
represents the adaptive inertia parameter,
represents the velocity of the global best (
),
represents the velocity of the personal best (
), and
and
represent the maximum and minimum values of the inertia coefficient, respectively. The search process of the mayfly is seen in Figure . This technique utilises the adaptive inertia coefficient
, which is provided by Equation (Equation10
(10)
(10) ), in place of x to compute the position and velocity of mayflies using Equations (8) and (9), respectively.
Figure 8. Real-Time Data augmented Using ADASYN.
The process of modifying a mayfly ,
, position, and velocity continues until either the number of iterations approaches the maximum number of iterations (
) or the tolerance reaches a value that has been previously determined. The final
is the optimal solution, which is made up of tuned weights and bias of LSTM and a completely controlled Feedforward Layer. In the end, the weights and bias that were generated by the Adaptive MOA-LSTM are given as the initial values of the LSTM and the Feed forward FCLSC, that are then trained further through the Adam optimiser.
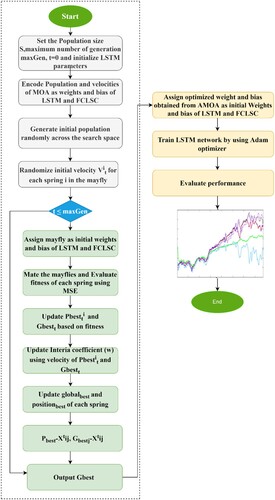
As we talked about in the previous section, LSTM networks use the simple Mayfly algorithms to find the best weights. In this case, adaptive mayfly is used as the main term to optimise the weights of LSTM networks. This is because there are many different ways to best search for and find the best male and female mayflies among all of them. The picture shows how the LAMOA learning methods work in their entirety. First, the LSTM cells are given a random number of weights and biases. The Fitness value is a way to measure how well the model works. For every iteration, step 6 in the flowchart Figure is used to out the input bias and weights. The LSTM network then figures out the fitness function by using these weights. If the fitness value is the same as the threshold, the iteration stops or keeps going until the threshold is reached again.
LAMOA comes up with a new way to fake threats in networks once the many-layered attacks have been determined. The proposed framework suggests using a different path for QoS-aware data transfer, with the route where a suspicious attack has happened being blocked. This information has been saved as separate prevention and mitigation databases that can stop attacks on networks. Here is a full list of the flowcharts that make up the LAMOA and how they work.
3.6. Proposed threat analysis model
IoT devices can be attacked in many different ways depending on how they work. Most of the time, the nodes are set up in the easy-going area. This makes it easier for attackers to get into the network. Aside from these, it is easy to add bad nodes to the network to infect it. The best way to avoid routing attacks is to know what happens when an attack is launched on a network and how it affects its performance. IoT simulations that are accurate and use a lot of data are a better way to design a safe and active sensor network. In this study, we use Cooja, which is a simulation tool of Contiki O.S. and is well-known among researchers in the field of sensing networks. The main reason we use Cooja is to figure out how we might be able to use it to measure the effects of attacks and develop better security measures (Sahay et al., Citation2018). In this study, we look at how malicious insiders on IoT-based RPL-based sensor nodes affect them.
During the experiment, the values were taken from the mote. were saved in data collection (DC) called “DC1”, “DC2”, “DC3”, “DC4”, “DC5”, “DC6”, and “DC7” based on the seven various scenarios. In each case, there are a different number of normal and attack motes/nodes overall. In the simulation, people join the community by sending a “Hello” message to their nearest neighbours with their identification number and signal power. Then, almost every node changes its routing tables and sends its own messages. In a DDoS/DoS, Hello Flood, Sinkhole, Version, wormhole, RPL Rank, or Blackhole attack, malicious nodes often send out “Hello” messages by sending out DIS packets that make them look like neighbours. This makes them the most accessible node for other nodes. So, they force their neighbours to use their time and money to deal with useless data packets (Simoglou et al., Citation2021).
A node's level or rank raises the average number of DIO, DIS, and DAO messages it sends out per day. The higher the number of hops between the root and any other node, the longer it takes for a message to go through the system. First-rank malicious nodes, for instance, send out 40 bytes of data every packet, which works out to 320 bytes for a 40-byte packet. In fact, the bandwidth is 10 KByte = 10,240 bits per second. SkyMote's h is supposed to be 320/10,240 = 0.031 s, which corresponds to a 40-byte transmission.
Based on the mentioned range of, this is established by the use of statistical methods. The output shows whether the node is good or bad. So, when the under algorithm is used to find the attacking nodes, their packets will be dropped from the network (Pecori et al., Citation2020). Both the drop process and the quarantine process have been described in the literature, but the drop procedure has been used more often. In this study, different combinations of features are also used to find the best way to find all seven types of attacks. Using power analyses as well as the LAMOA DL method, research on detecting seven attacks will benefit from the new approach, which is one of the most common types of threats in IoT. This is how the computational complexity of the proposed method was calculated and shown section 4.3.
Table
4. Results and discussion
4.1. Network design setup and features
WSN system is part of the IoT ecosystem because it can be used in many different ways and places. Real-life simulations can be used to test this system. Contiki-Cooja is an excellent RPL and WSN simulator. It's free and good for study, so it was recommended. The time duration and speed are shown in the simulation control window, along with buttons to start, pause, reinstall, and stop the modelling. Table shows how the Cooja simulator's parameters have indeed been set up for each of the seven dataset scenarios (1, 2, and 3 … 7).
Table 3. IoT infrastrcture parameter.
Every sensor's output is simulated to a.csv file, which will then be used for the deep learning methods. In the model that was suggested, the simulation was set up and ran for 10 h in each case. During the simulation, the “Mote output” window shows the outputs for each sky mote sensor node according to the timeline. It also shows the DODAG message details, such as when the message was sent or received, and the node identification (ID) information. Raw packet capture (.pcap) files are made by the Cooja simulation (Thomson et al., Citation2016). Such files can become.csv files. Python-using the proposed system is self-sufficient, saving node reserves.
4.2. Pre-processing and feature extraction
The IoT routing dataset, which includes both normal and attack nodes, is produced after the simulation starts. More than 6893 instances and 46 features are included in the resulting routing dataset shown in Tables and .
Table 4. Total number of features in the Cooja simulation.
Table 5. Simulation dataset collection during realtime.
4.3. Power consumption
The sum of power generation and power consumption is the power consumption rate. The motes used it to exchange packets of data (Haque et al., Citation2020).
(11)
(11) where Rt clock speed is second, Runtime is the interval,
is power, and
is voltage. The following formula can be used to calculate the total energy usage
.
(12)
(12)
represents the power usage of the CPU,
represents the collected power usage of the LPM,
represents the stored power usage of communication, and
represents the accumulated power usage of listening in iteration
The rest of the parameters in (Equations 6 and 7) are described in Table , and their values are obtained from the datasheet that comes with the
Sky mote (Hkiri et al., Citation2022). In addition, Cooja simulation gives
and sent values. Because the current proposal had a success rate of 99.96%, further features did not need to be included in this source of energy Internet of Things scenario.
Table 6. Power consumption parameters for the confined mote.
4.4. Performance and metrics
The proposed methodology and the RNN-based GA-LSTM, PSO-LSTM, and LAMOA models were tested for accuracy, precision, recall, and F1 score. The equation derived for these measurements is given in the following equations.
The True Positive (TP) is the number of attacks that were correctly identified as cyberattacks.
The True Negative (TN) is the number of normal samples for which it can be accurately predicted that they are safe.
The number of normal samples that were incorrectly identified as being under assault is referred to as a “false positive (FP)”.
FN stands for “false negative”, which is the number of malicious samples that were wrongly labelled as harmless.
(13)
(13)
(14)
(14)
(15)
(15)
(16)
(16)
(17)
(17)
(18)
(18)
Where is the first characteristic,
is a second characteristic, and
is the size of the sample. Both inter and logical loss occur simultaneously. Predicted output and intended result are compared to see if there is a difference. In a classification when the prediction input is a probability, it measures performance of the model. It must be minor. As the projected chance deviates from of the actual number, the loss in logistical efficiency increases.
(19)
(19) where
is the number of classifiers,
is the expected probability of class
, and
indicates if the label accurate.
4.5. Real-time dataset classification performance evaluations
The Cooja simulator was used to get the results of the experiment Table . In section four, you can read about the Cooja simulator. IoT routing datasets are being analysed to determine the impact of each mote on with and without attack power usage shown in Figures .
Figure 9. Normal power consumption scenario.
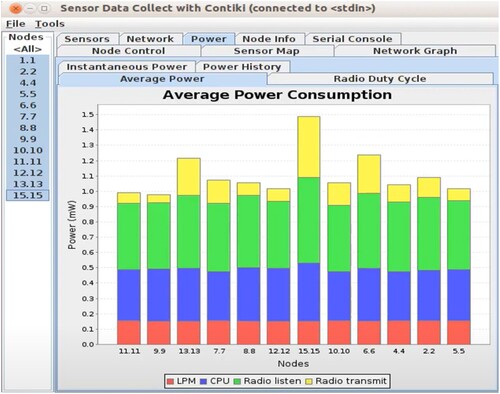
Figure 10. Attack power consumption scenario.
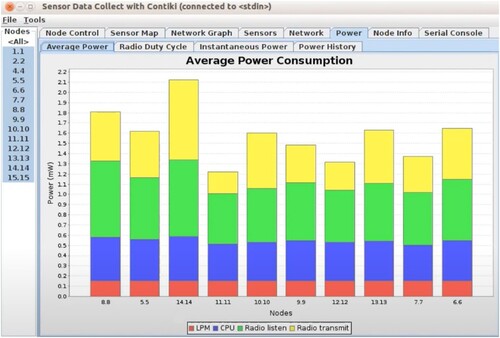
Figure 11. Power consumption each normal motes during simulation.
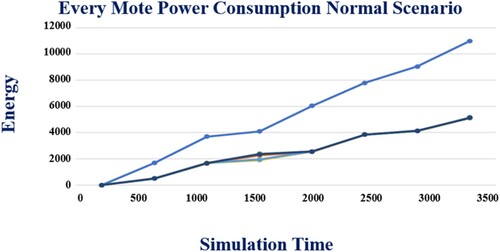
Figure 12. Power consumption attack motes during simulation.
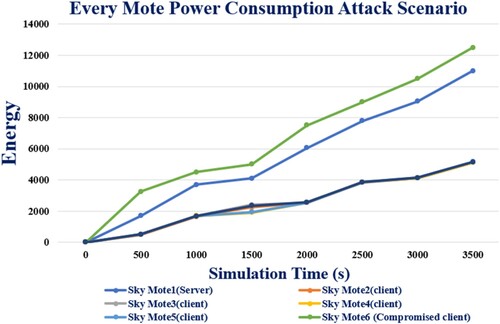
Table 7. Generating Cooja simulation dataset.
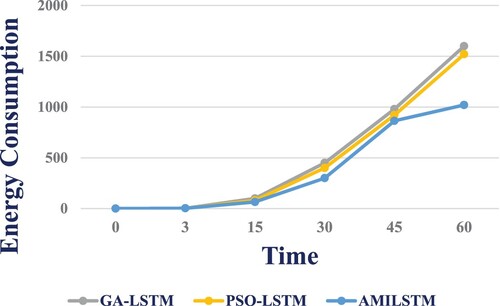
GA-LSTM, PSO-LSTM, and LAMOA all consume less energy than the standard RPL with attacks (Figure ). In comparison to the standard RPL with attacks, our new model LAMOA was found to use up to 60% less energy on average, a significant reduction.
Figure 13. Power consumption using proposed models.
To train and evaluate the model, we use two different approaches. In this experiment, we used 80% of the data for training and 20% for testing. To get the best possible results in the first scenario, sample points are used as an activating function to fine-tune the values of the hyper-parameters through the evaluate phase, making use of the optimised adaptive mayfly technique. In the tuning process, epochs with a learning rate and a performance batch size of were found to be optimal (Thavamani & Sinthuja, Citation2022). Using a different set of testing data, Figures and illustrates the accuracy and error rate of detection in training. For each dataset, both accuracy and loss and AUC performance are calculated Table .
Figure 14. Proposed model accuracy using real-time dataset.
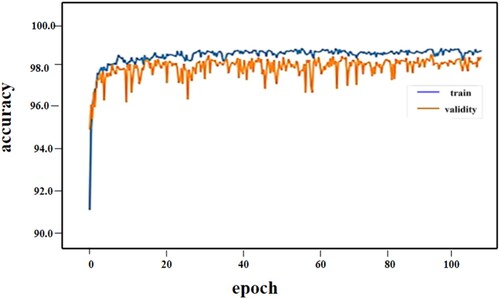
Figure 15. Proposed model loss using real-time dataset.
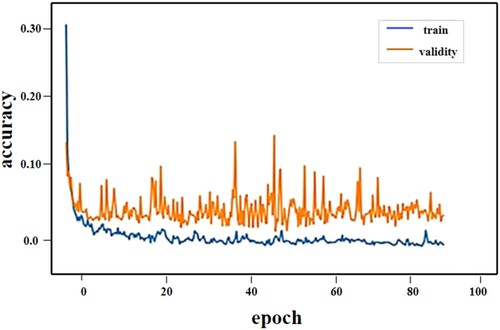
Table 8. Realtime-loss and accuracy evaluation using proposed model.
4.6. Benchmark dataset comparative analysis with proposed classification
Using the proposed anomaly-based models, tests were done on both multiclass and binary classifying using three benchmark datasets. Our proposed models were trained and deployed using python language on a pc with a 2.4 GHz xeon processor, 32 GB of RAM, and an NVIDIA GeForce 1060 6GB CPU since they need high-speed hardware to show efficiency. The system was examined on Windows 11 using Python 3.8 and Keras 2.5.0. An evaluation of a neural network is made up of three steps: training, validation, and testing. If a dataset is not spread out evenly, the classification technique favours the majority class. Class weights and AdaSyn were utilised in order to address the problem of unevenly distributed classes within the datasets. Because the number of class instances was a factor in determining class weights, a class that has a relatively low number of instances will have a greater load. Every single RNN classifier was trained for iterations with a batch size of 1 using an adaptive mayfly optimiser. The most essential thing about a neural network is, without a doubt, its loss functions. In this particular research study, a minimal classified cross-entropy loss error rate was implemented. There were three ways to stop models from being too good. First, the GA-LSTM, PSO-LSTM, and LAMOA layers were using the kernel, bias, and activity regularises bias. The l1-l2 penalty methods are used to regularise the kernel, the bias, and the activity. The second layer was the activity regularisation layer, and the third layer was the dropout layer. Lastly, in the event that the validation loss did not decrease while the model was being refined, an early termination strategy was implemented. Additionally, the risk of overfitting, which occurs when a model is trained for an extended period of time, is decreased when the early pausing technique is utilised. These strategies get rid of the chance that the model will be too good.
This paper classified three benchmark datasets as multiclass and binary. Table displays GA-LSTM, PSO-LSTM, and LAMOA multiclass classifications have used NSLKDD, BoT-IoT, and IoT-23. Table shows the GA-LSTM, PSO-LSTM, and LAMOA models’ NSLKDD results (a). The NSLKDD dataset's accuracy was % for GA-LSTM, 99.82% for PSO-LSTM, and 99.78% for LAMOA. It had the highest detection rate of the three NSLKDD models. FPR averaged 0.12% and FNR 0.18% for LAMOA.
Table 9. NSL-KDD, IoT-23, BoT-IoT datasets balancing using ADASYN and multiclassification classification using proposed models.
Table 10. Benchmark datasets binary classification using novel LAMOA model.
The NSLKDD dataset was less correct than the BoT-IoT dataset. Table (b) shows how well the BoT-IoT dataset was used by the GA-LSTM, PSO-LSTM, and LAMOA models. Normal, DoS, Scan, and Theft were all able to be tracked at a rate of at least 99.50% in the BoT-IoT dataset. For the LAMOA model, the FPR was 0.03% and the FNR was 0.09%. A lot of mistakes are made in the scans and theft classifications.
GA-LSTM, PSO-LSTM, and LAMOA models were used on the ten classes in Table (c) IoT-23 dataset. The proposed methods were right between 99.71% and 99.83% of the time. The FPR for the LAMOA model was 0.03%, and the FNR was 0.11%. The IoT-23 dataset has a recall rate of 99.89% and an average accuracy of 99.85%.
4.7. Performance analysis
Class weights were employed to balance datasets during training. ADASYN resolved class inequalities. NSLKDD, BoT-IoT, and IoT-23 use ADASYN. The table shows that NSLKDD Prob, U2L, and R2L malware detection have increased. Randomly selecting 1 million instances from BoT-DoS IoT's and Scan classes, borderline ADASYN was used to balance the remaining classes. Borderline ADASYN was used to balance the IoT-23 dataset's. Table shows that IoT-23 improves minority class detection (d).
We enhance the binary classification approach to classify IoT-23 normal and malicious classes. IoT-23 was separated into 18 subgroups, each containing normal and abnormal data. GA-LSTM, LAMOA, and PSO-LSTM were evaluated for each subgroup. Figure shows the accuracy, precision, recall, and F1 score of the GA-LSTM, LAMOA, and PSO-LSTM models on the IoT-23 normal and attack classes. LAMOA, PSO-LSTM and GA-LSTM A single hidden layer RNN was used to look at both the good and bad IoT-23 data.
Figure 16. Binary classification using GA-LSTM, LAMOA, PSO-LSTM using IoT-23 dataset.
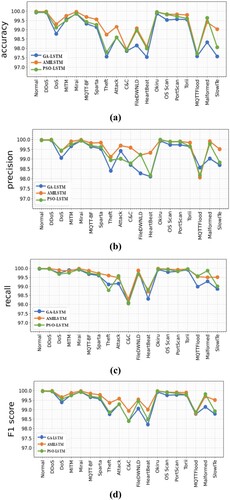
Table summarises the LAMOA binary classification evaluation results. The BoT-IoT dataset was accurate and reliable. The LAMOA model detected 99.96% of BoT-IoT, had a 0.2% FPR, and a 0.1% FNR. BoT-IoT has a 99.81% detection accuracy, greater than other models.
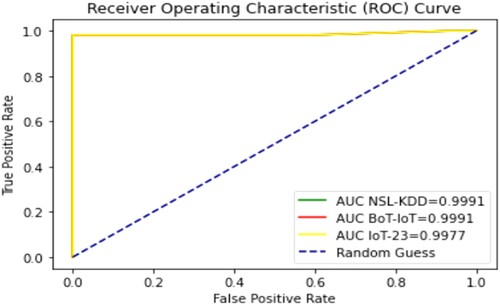
NSLKDD, BoT-IoT, and IoT-23 were properly identified using one deep layer of recurrent neuronal activity. Performance measurements for binary classification were also assessed ROC AUC (ROC AUC). ROC curves were plotted for the three-benchmark dataset training and verification sets. displays the ROC curve for NSLKDD, BoT-IoT, and IoT-23 LAMOA binary classifier models used. The ROC curve for the testing data is shown in Figures and .
Figure 17. AMILSTM for the Training data with benchmark datasets.
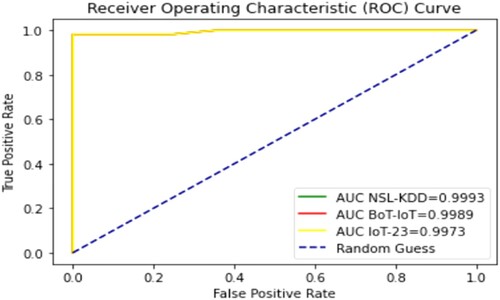
Figure 18. AMILSTM for the Testing data with benchmark datasets.
This demonstrates how well the proposed methods compare to other learning models that can be used to predict the different types of attacks. On this test, the proposed deep learning models LAMOA, GA-LSTM, and PSO-LSTM outperform other learning approaches significantly. We also tested the frameworks using the benchmarks and evaluated them by comparing them to the other learning models. Tables and show how the models compare when different ways of measuring performance are used.
Table 11. Comparative analysis of binary classification using DL models.
Table 12. Comparative analysis of multi-classification using DL models.
5. Conclusion
The method that was involved in developing the proposed framework, which is based on real-time traffic routing to provide an Internet of Things environment with both normal and attacked nodes, many steps have been taken to make the proposed system work. To start, an IoT routing dataset related to energy consumption was generated using the Cooja simulator in the proposed framework. This dataset included both normal and attack motes. Deep learning LSTM with metaheuristics High-performance measurements and a powerful model were created using adaptive mayfly integration, which was the basis for the model that was proposed. So, ADASYN was used to make the IoT routing dataset bigger so that a strong model could be built. The IoT routing dataset was made using three ways to extract features: weight by adaptive mayfly, weight by tree significance, and LSTM is used to get rid of characteristics that are irrelevant and redundant features. The IoT routing dataset was enhanced using these techniques in order to get rid of noise and overfitting in the learning model, as well as to determine which characteristics are the most significant for developing a robust model. In addition to this, they suggested a two-hybrid metaheuristic GA-LSTM and PSO-LSTM model in order to evaluate it in contrast to the adaptive mayfly model. The LAMOA outperforms the two models. The final three models for binary classification produced using deep learning have been made using GA-LSTM, PSO-LSTM, and LAMOA. Three sets of benchmark datasets (NSL-KDD, Bot-IoT, and IoT-23) have been used to test the frameworks that were recommended. When compared to previous work done with deep learning, the multiclass and binary classification models that were proposed performed much better in terms of accuracy, precision, recall, and F1 score. Future work plan to implement with the field of AI and machine learning known as explainable AI is a recent one that is only beginning to emerge. It is of the greatest priority to build network trust in relation to the decisions that are made by AI models. Continuous monitoring and accurate data classification operations enhanced the quality of any vulnerability analysis system. The XAI-based advanced models provide better understanding about the dataset and future pattern prediction and classification. Thus, the proposed LSTM-based mayfly optimisation-based algorithm utilises the unique characteristic of XAI tool to classify routing-based network threats under the real-time monitoring. The model can be extended further to analyse and classify blockchain-based network transactions and its security threats. The model also supports the analysis of security attack dataset which captured through mobile devices. The current research model considers only the stand-alone device-based attack and its classification, The future work may be extended with dynamic mobile data-based attacks on the IoT infrastructure.
Abbreviations
| LSTM | = | Long Short-Term Memory |
| AMOA | = | Adaptive mayfly optimisation algorithm |
| PSO | = | Particle Swarm Optimisation |
| GA | = | Genetic Algorithm |
| RPL | = | Routing Protocol for Low-Power and Lossy Network |
| LAMOA | = | LSTM Adaptive mayfly optimisation algorithm |
| ADASYN | = | Adaptive Synthetic |
| APSO | = | Adjusting Particle Swarm optimisation |
| CNN | = | Convolution Neural Network |
| IIoT | = | Industrial of Internet of Things |
| IoT | = | Internet of Things |
| DL | = | Deep Learning |
| IDS | = | Intrusion Detection System |
| SMOTE | = | Synthetic Minority Over-Sampling Technique |
| KNN | = | k-nearest neighbour |
| DDoS | = | Distributed Denial of Services |
Disclosure statement
No potential conflict of interest was reported by the author(s).
References
- Albulayhi, K., Abu Al-Haija, Q., Alsuhibany, S. A., Jillepalli, A. A., Ashrafuzzaman, M., & Sheldon, F. T. (2022). IoT intrusion detection using machine learning with a novel high performing feature selection method. Applied Sciences, 12(10), 5015.
- Alferaidi, A., Yadav, K., Alharbi, Y., Razmjooy, N., Viriyasitavat, W., Gulati, K., Kautish, S., & Dhiman, G. (2022). Distributed deep CNN-LSTM model for intrusion detection method in IoT-based vehicles. Mathematical Problems in Engineering, 2022. https://doi.org/10.1155/2022/3424819
- Aljuhani, A., Kumar, P., Kumar, R., Jolfaei, A., & Islam, A. N. (2022). Fog intelligence for secure smart villages: Architecture, and future challenges. IEEE Consumer Electronics Magazine. https://doi.org/10.1109/MCE.2022.3193268
- Alkahtani, H., & Aldhyani, T. H. (2021). Botnet attack detection by using CNN-LSTM model for internet of things applications. Security and Communication Networks, 2021, Article 3806459. https://doi.org/10.1155/2021/3806459
- Almaraz-Rivera, J. G., Perez-Diaz, J. A., & Cantoral-Ceballos, J. A. (2022). Transport and application layer DDoS attacks detection to IoT devices by using machine learning and deep learning models. Sensors, 22(9), 3367. https://doi.org/10.3390/s22093367
- Aversano, L., Bernardi, M. L., Cimitile, M., & Pecori, R. (2021, December). Anomaly detection of actual IoT traffic flows through deep learning. In 2021 20th IEEE International Conference on Machine Learning and Applications (ICMLA) (pp. 1736–1741). IEEE.
- Bagui, S., & Li, K. (2021). Resampling imbalanced data for network intrusion detection datasets. Journal of Big Data, 8(1), 1–41. https://doi.org/10.1186/s40537-020-00390-x
- Bovenzi, G., Aceto, G., Ciuonzo, D., Persico, V., & Pescapé, A. (2020, December). A hierarchical hybrid intrusion detection approach in IoT scenarios. In GLOBECOM 2020-2020 IEEE Global Communications Conference (pp. 1–7). IEEE.
- Cai, S., Han, D., Yin, X., Li, D., & Chang, C. C. (2022). A hybrid parallel deep learning model for efficient intrusion detection based on metric learning. Connection Science, 34(1), 551–577. https://doi.org/10.1080/09540091.2021.2024509
- Cakir, S., Toklu, S., & Yalcin, N. (2020). RPL attack detection and prevention in the internet of things networks using a GRU based deep learning. IEEE Access, 8, 183678–183689. https://doi.org/10.1109/ACCESS.2020.3029191
- Churcher, A., Ullah, R., Ahmad, J., Ur Rehman, S., Masood, F., Gogate, M., Alqahtani, F., Nour, B., & Buchanan, W. J. (2021). An experimental analysis of attack classification using machine learning in IoT networks. Sensors, 21(2), 446. https://doi.org/10.3390/s21020446
- Dasgupta, S., & Saha, B. (2022). HMA-ID mechanism: A hybrid mayfly optimisation based apriori approach for intrusion detection in big data application. Telecommunication Systems, 80(1), 77–89. https://doi.org/10.1007/s11235-022-00882-6
- Haque, K. F., Abdelgawad, A., Yanambaka, V. P., & Yelamarthi, K. (2020, June). An energy-efficient and reliable RPL for IoT. In 2020 IEEE 6th World Forum on Internet of Things (WF-IoT) (pp. 1–2). IEEE.
- Hassan, M. M., Gumaei, A., Alsanad, A., Alrubaian, M., & Fortino, G. (2020). A hybrid deep learning model for efficient intrusion detection in big data environment. Information Sciences, 513, 386–396. https://doi.org/10.1016/j.ins.2019.10.069
- He, D., Zhang, D., Li, Y., Liang, W., & Hsieh, M. Y. (2021). An efficient and DoS-resilient name lookup for NDN interest forwarding. Connection Science, 33(3), 735–752. https://doi.org/10.1080/09540091.2021.1875988
- Hkiri, A., Karmani, M., & Machhout, M. (2022, March). The routing protocol for low power and lossy networks (RPL) under attack: Simulation and analysis. In 2022 5th International Conference on Advanced Systems and Emergent Technologies (IC_ASET) (pp. 143–148). IEEE.
- Hu, N., Zhang, D., Xie, K., Liang, W., & Hsieh, M. Y. (2022). Graph learning-based spatial-temporal graph convolutional neural networks for traffic forecasting. Connection Science, 34(1), 429–448. https://doi.org/10.1080/09540091.2021.2006607
- Huan, H., Guo, Z., Cai, T., & He, Z. (2022). A text classification method based on a convolutional and bidirectional long short-term memory model. Connection Science, 34(1), 2108–2124. https://doi.org/10.1080/09540091.2022.2098926
- Ikram, S. T., Priya, V., Anbarasu, B., Cheng, X., Ghalib, M. R., & Shankar, A. (2022). Prediction of IIoT traffic using a modified whale optimization approach integrated with random forest classifier. The Journal of Supercomputing, 78(8), 10725–10756.
- Imrana, Y., Xiang, Y., Ali, L., & Abdul-Rauf, Z. (2021). A bidirectional LSTM deep learning approach for intrusion detection. Expert Systems with Applications, 185, Article 115524. https://doi.org/10.1016/j.eswa.2021.115524
- Islam, U., Muhammad, A., Mansoor, R., Hossain, M. S., Ahmad, I., Eldin, E. T., Khan, J. A., Rehman, A. U., & Shafiq, M. (2022). Detection of distributed denial of service (DDoS) attacks in IOT based monitoring system of banking sector using machine learning models. Sustainability, 14(14), 8374. https://doi.org/10.3390/su14148374
- Ji, J., Zhao, C., Wang, Y., Zhao, T., & Zhang, X. (2021). A fault diagnosis method of rolling mill bearing at Low frequency and overload condition based on integration of EEMD and GA-DBN. Mathematical Problems in Engineering. https://doi.org/10.1155/2021/2502476
- Jia, Y., Zhong, F., Alrawais, A., Gong, B., & Cheng, X. (2020). Flowguard: An intelligent edge defense mechanism against IoT DDoS attacks. IEEE Internet of Things Journal, 7(10), 9552–9562. https://doi.org/10.1109/JIOT.2020.2993782
- Kan, X., Fan, Y., Fang, Z., Cao, L., Xiong, N. N., Yang, D., & Li, X. (2021). A novel IoT network intrusion detection approach based on adaptive particle swarm optimization convolutional neural network. Information Sciences, 568, 147–162. https://doi.org/10.1016/j.ins.2021.03.060
- Khan, M. A., Khan Khattk, M. A., Latif, S., Shah, A. A., Ur Rehman, M., Boulila, W., ... Ahmad, J. (2022). Voting classifierbased intrusion detection for iot networks. In Advances on Smart and Soft Computing (pp. 313–328). Springer.
- Kim, J., Shim, M., Hong, S., Shin, Y., & Choi, E. (2020). Intelligent detection of IoT botnets using machine learning and deep learning. Applied Sciences, 10(19), 7009. https://doi.org/10.3390/app10197009
- Krishnaveni, S., & Prabakaran, S. (2021). Ensemble approach for network threat detection and classification on cloud computing. Concurrency and Computation: Practice and Experience, 33(3), e5272. https://doi.org/10.1002/cpe.5272
- Kumar, P., Gupta, G. P., & Tripathi, R. (2021a). Design of anomaly-based intrusion detection system using fog computing for IoT network. Automatic Control and Computer Sciences, 55(2), 137–147. https://doi.org/10.3103/S0146411621020085
- Kumar, P., Gupta, G. P., & Tripathi, R. (2021b). A distributed ensemble design-based intrusion detection system using fog computing to protect the internet of things networks. Journal of Ambient Intelligence and Humanized Computing, 12(10), 9555–9572. https://doi.org/10.1007/s12652-020-02696-3
- Kumar, P., Gupta, G. P., & Tripathi, R. (2021c). Toward design of an intelligent cyber-attack detection system using hybrid feature reduced approach for IoT networks. Arabian Journal for Science and Engineering, 46(4), 3749–3778. https://doi.org/10.1007/s13369-020-05181-3
- Kumar, P., Gupta, G. P., & Tripathi, R. (2021d). TP2SF: A trustworthy privacy-preserving secured framework for sustainable smart cities by leveraging blockchain and machine learning. Journal of Systems Architecture, 115, Article 101954. https://doi.org/10.1016/j.sysarc.2020.101954
- Kumar, P., Tripathi, R., & Gupta, P. (2021e, January). P2IDF: A privacy-preserving based intrusion detection framework for software defined Internet of Things-fog (SDIoT-Fog). In Adjunct Proceedings of the 2021 International Conference on Distributed Computing and Networking (pp. 37–42).
- Liu, P., Xie, M., Bian, J., Li, H., & Song, L. (2020). A hybrid PSO–SVM model based on safety risk prediction for the design process in metro station construction. International Journal of Environmental Research and Public Health, 17(5), 1714. https://doi.org/10.3390/ijerph17051714
- Masum, M., Faruk, M. J. H., Shahriar, H., Qian, K., Lo, D., & Adnan, M. I. (2022, January). Ransomware classification and detection with machine learning algorithms. In 2022 IEEE 12th Annual Computing and Communication Workshop and Conference (CCWC) (pp. 316–0322). IEEE.
- Mirsky, Y., Doitshman, T., Elovici, Y., & Shabtai, A. (2018). Kitsune: an ensemble of autoencoders for online network intrusion detection. arXiv preprint arXiv:1802.09089.
- Mohmand, M. I., Hussain, H., Khan, A. A., Ullah, U., Zakarya, M., Ahmed, A., Raza, M., Rahman, I. U., & Haleem, M. (2022). A machine learning-based classification and prediction technique for DDoS attacks. IEEE Access, 10, 21443–21454. https://doi.org/10.1109/ACCESS.2022.3152577
- Moizuddin, M. D., & Jose, M. V. (2022). A bio-inspired hybrid deep learning model for network intrusion detection. Knowledge-Based Systems, 238, 107894.
- Nascita, A., Montieri, A., Aceto, G., Ciuonzo, D., Persico, V., & Pescapé, A. (2021). XAI meets mobile traffic classification: Understanding and improving multimodal deep learning architectures. IEEE Transactions on Network and Service Management, 18(4), 4225–4246. https://doi.org/10.1109/TNSM.2021.3098157
- Otoum, Y., Liu, D., & Nayak, A. (2022). DL-IDS: A deep learning-based intrusion detection framework for securing IoT. Transactions on Emerging Telecommunications Technologies, 33(3), e3803. https://doi.org/10.1002/ett.3803
- Pecori, R., Tayebi, A., Vannucci, A., & Veltri, L. (2020). IoT attack detection with deep learning analysis. In 2020 International Joint Conference on Neural Networks (IJCNN). IEEE.
- Sahay, R., Geethakumari, G., & Modugu, K. (2018, February). Attack graph-based vulnerability assessment of rank property in RPL-6LOWPAN in IoT. In 2018 IEEE 4th World Forum on Internet of Things (WF-IoT) (pp. 308–313). IEEE.
- Salman, O., Elhajj, I. H., Chehab, A., & Kayssi, A. (2022). A machine learning based framework for IoT device identification and abnormal traffic detection. Transactions on Emerging Telecommunications Technologies, 33(3), e3743. https://doi.org/10.1002/ett.3743
- Samy, A., Yu, H., & Zhang, H. (2020). Fog-based attack detection framework for internet of things using deep learning. IEEE Access, 8, 74571–74585. https://doi.org/10.1109/ACCESS.2020.2988854
- Shekhar, S. (2021). LSTM for text classification in Python. https://www.analyticsvidhya.com/blog/2021/06/lstm-for-text-classification/
- Shhadat, I., Hayajneh, A., & Al-Sharif, Z. A. (2020). The use of machine learning techniques to advance the detection and classification of unknown malware. Procedia Computer Science, 170, 917–922. https://doi.org/10.1016/j.procs.2020.03.110
- Simoglou, G., Violettas, G., Petridou, S., & Mamatas, L. (2021). Intrusion detection systems for RPL security: A comparative analysis. Computers & Security, 104, Article 102219. https://doi.org/10.1016/j.cose.2021.102219
- Sreeja, N. K. (2019). A weighted pattern matching approach for classification of imbalanced data with a fireworks-based algorithm for feature selection. Connection Science, 31(2), 143–168. https://doi.org/10.1080/09540091.2018.1512558
- Stellios, I., Mokos, K., & Kotzanikolaou, P. (2022). Assessing smart light enabled cyber-physical attack paths on urban infrastructures and services. Connection Science, 34(1), 1401–1429. https://doi.org/10.1080/09540091.2022.2072470
- Tang, M., Chen, W., & Yang, W. (2022). Anomaly detection of industrial state quantity time-series data based on correlation and long short-term memory. Connection Science, 34(1), 2048–2065. https://doi.org/10.1080/09540091.2022.2092594
- Thavamani, S., & Sinthuja, U. (2022, January). LSTM based deep learning technique to forecast Internet of Things attacks in MQTT protocol. In 2022 IEEE Fourth International Conference on Advances in Electronics, Computers and Communications (ICAECC) (pp. 1–4). IEEE.
- Thomson, C., Romdhani, I., Al-Dubai, A., Qasem, M., Ghaleb, B., & Wadhaj, I. (2016). Cooja simulator manual.
- Ullah, I., & Mahmoud, Q. H. (2021). Design and development of a deep learning-based model for anomaly detection in IoT networks. IEEE Access, 9, 103906–103926. https://doi.org/10.1109/ACCESS.2021.3094024
- Ullah, I., & Mahmoud, Q. H. (2022, January). An anomaly detection model for IoT networks based on flow and flag features using a feed-forward neural network. In 2022 IEEE 19th Annual Consumer Communications and Networking Conference (CCNC) (pp. 363–368). IEEE.
- Ullah, I., Ullah, A., & Sajjad, M. (2021). Towards a hybrid deep learning model for anomalous activities detection in internet of things networks. IoT, 2(3), 428–448. https://doi.org/10.3390/iot2030022
- Wang, B., & Zhang, S. (2022). A new locally adaptive K-nearest centroid neighbor classification based on the average distance. Connection Science, 34(1), 2084–2107. https://doi.org/10.1080/09540091.2022.2088695
- Wang, H., & Li, F. (2022). A text classification method based on LSTM and graph attention network. Connection Science, 34(1), 2466–2480. https://doi.org/10.1080/09540091.2022.2128047
- Wang, Y., Niu, M., Liu, K., Shen, M., & Qin, B. (2022a). A novel data augmentation method based on coralGAN for prediction of part surface roughness. IEEE Transactions on Neural Networks and Learning Systems.
- Wang, Z., Han, D., Li, M., Liu, H., & Cui, M. (2022b). The abnormal traffic detection scheme based on PCA and SSH. Connection Science, 34(1), 1201–1220. https://doi.org/10.1080/09540091.2022.2051434
- Wu, S., Liu, Y., Zou, Z., & Weng, T. H. (2022). S_I_LSTM: Stock price prediction based on multiple data sources and sentiment analysis. Connection Science, 34(1), 44–62. https://doi.org/10.1080/09540091.2021.1940101
- Xin, L., Ziang, L., Yingli, Z., Wenqiang, Z., Dong, L., & Qingguo, Z. (2022). TCN enhanced novel malicious traffic detection for IoT devices. Connection Science, 34(1), 1322–1341. https://doi.org/10.1080/09540091.2022.2067124
- Yin, C., Zhu, Y., Fei, J., & He, X. (2017). A deep learning approach for intrusion detection using recurrent neural networks. IEEE Access, 5, 21954–21961. https://doi.org/10.1109/ACCESS.2017.2762418
- Zervoudakis, K., & Tsafarakis, S. (2020). A mayfly optimization algorithm. Computers & Industrial Engineering, 145, Article 106559. https://doi.org/10.1016/j.cie.2020.106559
- Zhang, Y., Li, P., & Wang, X. (2019). Intrusion detection for IoT based on improved genetic algorithm and deep belief network. IEEE Access, 7, 31711–31722. https://doi.org/10.1109/ACCESS.2019.2903723