
 ?Mathematical formulae have been encoded as MathML and are displayed in this HTML version using MathJax in order to improve their display. Uncheck the box to turn MathJax off. This feature requires Javascript. Click on a formula to zoom.
Abstract
Anomaly detection in the scope of network security aims to identify network instances for the unexpected and unique, with various security operations employing such techniques to facilitate effective threat detection. However, many systems have been designed based on the absolute mapping of attacks to one of three anomaly types (i.e. point, collective, or contextual), a strategy not supported by the recent findings of hybrid anomaly classifications. Given the growing usage of network anomaly detection and the implications of hybrid anomalies, we propose several heterogeneous anomaly types and provide an unsupervised approach for the automated mapping of network threats. Initial findings on publicly available intrusion datasets support the existence of four unique heterogeneous anomaly types, providing unique insight regarding the next generation of network anomaly detection systems.
1. Introduction
The continued growth of network communication has led to a security crisis in recent years. With growing device diversity and security often being an afterthought, digital defence is a continuously expanding endeavour. By 2023, an estimated two-thirds of the world's population will be internet-connected, resulting in a near 60% increase in network-capable devices from 2018 (Cisco, Citation2020). In line with this, by 2025, it is estimated that cybercrime will cost upwards of US$10.5 trillion in damages per year, a 250% increase compared to the US$3 trillion estimates of 2015 (Morgan, Citation2020).
Anomaly detection broadly refers to approaches that identify instances, data points, or events that fall outside the scope of the previously observed (Ahmed et al., Citation2016; Ariyaluran Habeeb et al., Citation2018; Bhuyan et al., Citation2013; Chen et al., Citation2020; Moustafa et al., Citation2019; Zhou & Guo, Citation2018; Zoppi et al., Citation2020). Heavily leveraged by various Intrusion Detection Systems (IDS), Network Anomaly Detection Systems (NADS) have seen wide adoption, offering improved system robustness and unsupervised operation. (Bovenzi et al., Citation2020; Dahiya & Srivastava, Citation2018; Fernandes et al., Citation2019; Guarino et al., Citation2022; Kiani et al., Citation2020; Mirsky et al., Citation2018; Zoppi et al., Citation2020). Similarly, due to their focus on abnormality, NADS are also able to discover previously undocumented attacks (Bovenzi et al., Citation2020; Mirsky et al., Citation2018; Zhou & Guo, Citation2018; Zoppi et al., Citation2021, Citation2020), a unique characteristic that has received specific attention from industry to tackle the growing challenges of zero-day vulnerabilities (Ahmed, Citation2019; Bovenzi et al., Citation2020; Fernandes et al., Citation2019; Zhou & Guo, Citation2018; Zoppi et al., Citation2021).
Given this, NADS have noted difficulties identifying obfuscated threats (i.e. malware, backdoors) (Zoppi et al., Citation2021). A shortcoming highlighted by the discovery of Heartbleed, a critical vulnerability initially missed by numerous high-level security firms (Chen et al., Citation2021; Lee et al., Citation2014). In response, researchers have attempted to map network threats to specific anomaly definitions based on their underlying qualities (Ahmed, Citation2019; Fernandes et al., Citation2019; Kendall, Citation1999), improving attack understanding and guiding NADS development.
Primary works (Ahmed et al., Citation2016; Kendall, Citation1999) initially focused on mapping entire attack vectors to a respective anomaly type based on their fundamental characteristics. While undoubtedly useful, these original mappings have grown outdated due to the growth of attack variation, with only recent mapping endeavours focusing on the classification of individual attack types (i.e. heartbleed) (Zoppi et al., Citation2020).
Further adding complexity is the proposition of anomaly hybridisation, whereby a threat can simultaneously express qualities of two or more distinct anomaly types (Araya et al., Citation2016; Jiang et al., Citation2014). Initial research by Jiang et al. (Citation2014) proposed a system capable of the real-time detection of contextual collective anomalies from data streams, with the term contextual collective used to explain an identified cross-over of qualities. While these findings spurred the development of several approaches (Araya et al., Citation2016; Dou et al., Citation2019; Hu et al., Citation2021), their implementations are often outside the scope of network security.
Additionally, Zoppi et al. (Citation2020) found that both Denial of Service (DoS) and Distributed Denial of Service (DDoS) attacks can present both point/collective and collective/contextual qualities. The authors utilised a semi-supervised approach to map the anomaly characteristics of attacks from several network intrusion datasets. Further, the research demonstrated that models trained on one attack could detect differing attacks, assuming they shared identical anomaly classifications. Given this, the mapping procedure utilised human interpretation to identify contextual associations, an inherent shortcoming given the known difficulties of contextual detection.
Further, research by Kiani et al. (Citation2020) also identified that anomaly types often showcase thin class boundaries, with enough segregation within to prompt additional classification categories. Ultimately, this led the authors to suggest the existence of two unique anomaly types: collective normal and collective point. However, as with Jiang et al. (Citation2014), the datasets utilised were outside the scope of network security.
Given the recent findings of anomaly hybrids (Jiang et al., Citation2014; Kiani et al., Citation2020; Zoppi et al., Citation2020) and the attack variety challenges currently facing NADS development (Araya et al., Citation2016; Bovenzi et al., Citation2020; Dou et al., Citation2019; Guarino et al., Citation2022; Jiang et al., Citation2014; Mirsky et al., Citation2018), a clear area of exploratory research into the heterogeneous anomaly potentials of network attacks emerge. Similarly, the development of an unsupervised approach for the automated mapping of threats aims to expedite anomaly research and reduce interpretation bias. Facilitating the next generation of NADS in overcoming the volume and security issues facing the 21st century (Bovenzi et al., Citation2020; Dahiya & Srivastava, Citation2018; Guarino et al., Citation2022; Mirsky et al., Citation2018).
1.1. Contribution
The primary contributions of this paper include the establishment of several unique heterogeneous anomalies, simultaneously explaining the hybridised potentials of Zoppi et al. (Citation2020), the thin class boundaries of Kiani et al. (Citation2020), and the previously documented contextual collective type of Jiang et al. (Citation2014). The paper also provides a methodology adapted from Zoppi et al. (Citation2020) to classify network threats in an unsupervised and automated manner. Further, this method is applied to several networking intrusion datasets, demonstrating the existence of all theorised heterogeneous anomaly types. Finally, the paper details the implications of these discoveries, highlighting their impact on future NADS development and, more broadly, how these findings alter the current network anomaly landscape.
1.2. Structure
The paper is structured as follows: Section 2 gives an overview of the pre-existing anomaly types, providing essential context to the topic. Section 3 then lays the foundations for our hypothesised heterogeneous anomaly types, detailing their theoretical underpinnings. Section 4 then describes an unsupervised approach for mapping attacks to anomaly types, the datasets utilised, and the overall experimental procedure. Section 5 presents the experimental results and associated mappings, with Section 6 providing relevant discussion on our results and their implications. Finally, Section 7 concludes the paper and highlights the direction of future work.
2. Traditional anomalies
Fundamentally, three distinct categories have been used to classify network anomalies: point, collective, and contextual (Ahmed et al., Citation2016; Ariyaluran Habeeb et al., Citation2018; Bhuyan et al., Citation2013; Chandola et al., Citation2009; Chen et al., Citation2020; Zhou & Guo, Citation2018; Zoppi et al., Citation2020), the details of which are presented throughout this section. While the various definitions of anomalies are critical to multiple fields, it is essential to remember that anomaly detection is the isolation of “uniqueness” amongst a proverbial “sea of variables” (Ariyaluran Habeeb et al., Citation2018; Chen et al., Citation2020).
2.1. Point anomalies
Point anomalies are classical data outliers (Ariyaluran Habeeb et al., Citation2018; Bhuyan et al., Citation2013; Chatterjee & Ahmed, Citation2022; Fernandes et al., Citation2019; Moustafa et al., Citation2019; Zoppi et al., Citation2020) and deemed instances that explicitly fall outside the expected scope of normality (Ariyaluran Habeeb et al., Citation2018; Bhuyan et al., Citation2013; Chatterjee & Ahmed, Citation2022; Zoppi et al., Citation2020). Characterised by distinct separation, they are often the simplest to detect (Zhou & Guo, Citation2018). However, they rely on monitoring suitable data features during their occurrence.
Table shows an example of a point anomaly, whereby instance eight falls outside the scope of normality, specifically regarding the “Duration” feature. In this case, instance eight would associate strongly with a point anomaly classification due to outright deviation from the global norm.
Table 1. Example of a point anomaly in the context of network traffic data.
Based on this definition, a User to Root (U2R) attack would be an example of a point anomaly, whereby a malicious user would gain increased access to a system via an exploit (Ahmed et al., Citation2016). Such an attack is usually characterised by a singular instance that garners access to a system, often presenting itself as a clear outlier compared to the surrounding data.
2.2. Collective anomalies
Collective anomalies refer to a cluster of associated instances that, when viewed collectively, appear anomalous compared to available data (Ariyaluran Habeeb et al., Citation2018; Chatterjee & Ahmed, Citation2022; Fernandes et al., Citation2019; Moustafa et al., Citation2019). However, on an individual level, they often appear normal, only standing out when viewed holistically (Bhuyan et al., Citation2013; Chatterjee & Ahmed, Citation2022; Zoppi et al., Citation2020). Given this, collective anomalies are often identifiable from their repetitive nature, as demonstrated by DoS, DDoS, and brute force attacks (Ariyaluran Habeeb et al., Citation2018; Zoppi et al., Citation2020).
Table demonstrates an example of a collective anomaly. Individually instances six through eight do not constitute apparent individual anomalies. However, these instances collectively fall outside the scope of normality regarding the “Port” feature, presenting abnormal successive repetition. It is important to note that this example does not contain point-identifying features, as shown in Table , with each type of classification (i.e. point, collective, contextual) being explicitly distinct.
Table 2. Example of a collective anomaly in the context of network traffic data.
An example of a collective anomaly would be repeated attempts to access a system using approximated credentials maliciously (i.e. brute force). Given the properties of Table , the continuous repetition of instances attempting access to port 22 may indicate a Secure Shell (SSH) brute force attack. However, only when viewed collectively do they highlight an anomaly, as individually, they appear to be standard login attempts.
2.3. Contextual anomalies
Contextual anomalies are instances deemed abnormal when viewed within the specific context of various meta-features (Ahmed et al., Citation2016; Chatterjee & Ahmed, Citation2022; Moustafa et al., Citation2019; Zoppi et al., Citation2020). However, the most associated context is time (Bhuyan et al., Citation2013). Given this, contextual anomalies can also be identified during associated trend changes (Zoppi et al., Citation2020), whereby they express a rapid alteration from and return to normality. Due to this, contextual anomalies can be detected by comparison to a previously established local baseline (Zoppi et al., Citation2021).
As demonstrated in Table , instance eight falls outside contextual normality when compared to the established baseline. Specifically due to an abnormal occurrence of the Port feature (i.e. 700), with an immediate return to normality. While the instance could be given a point anomaly classification, this would rely on the Port feature not being used benignly during data collection.
Table 3s. Example of a contextual anomaly in the context of network traffic data.
A real-world example of a contextual anomaly is the unique port communications carried out by malware to exfiltrate information. While generally obfuscated, these interactions stand out when viewed within the context of normality. As per the example shown in Table , the abnormal occurrence of port 700 could be a malicious communication link, given the context of being outside business hours (i.e. 10:19 PM).
3. Heterogeneous anomalies
Due to the growing prevalence of zero-day attacks and the current demands on automated security systems, an improved network anomaly classification schema is a critical research objective. Further, the traditional anomaly classifications are no longer suited to tackle the growing threat diversity of recent years, as highlighted by the discovery of hybrid anomalies in various domains (Jiang et al., Citation2014; Kiani et al., Citation2020; Zoppi et al., Citation2020). Therefore, a more diverse classification approach would enable the improved development of targeted detection approaches by distilling the core representational characteristics of threats. For example, given that a specific attack demonstrated both point and collective properties, said attack could be detected more precisely without the computational overhead of contextual analysis.
Additionally, given the established and reviewed nature of the traditional anomaly types, additional core variants are unlikely to exist. However, based on previous works (Jiang et al., Citation2014; Kiani et al., Citation2020; Zoppi et al., Citation2020), we hypothesise that network attacks may regularly fall under two or more anomaly types simultaneously. Figure highlights the hypothesised heterogeneous anomaly landscape in the form of a Venn diagram. We also name these unique heterogeneous variants serriform, unitextual, polytextual, and polyform for simplicity and provide examples in the same format as the previous section. These heterogeneous (i.e. hybridised) variants make up the complete domain of potential crossover, presenting a diverse range of unexplored and potentially missed anomaly classifications.
Figure 1. Venn diagram of hypothesised heterogeneous anomalies.
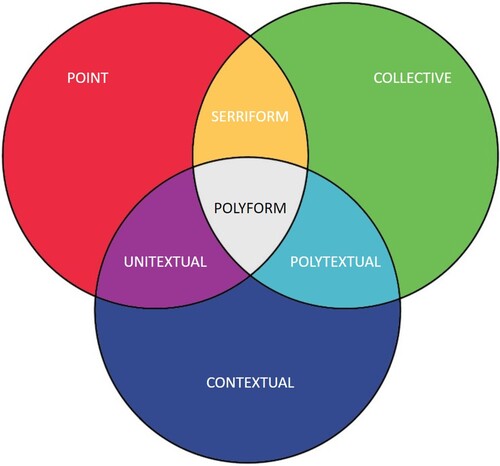
3.1. Serriform anomalies
A serriform anomaly are instances that demonstrate the qualities of both point and collective types simultaneously. Given these pre-existing classes, a concise definition of a serriform anomaly would be instances that stand out due to feature separation (i.e. point) and successive repetition (i.e. collective). Table demonstrates an example of a serriform anomaly, whereby instances six through eight constitute apparent point anomalies regarding the Duration feature. However, they also present abnormal successive repetition compared to previous instances. Further, they showcase a minimal distance between each other, a highly collective property (Zoppi et al., Citation2020).
Table 4. Example of a serriform anomaly in the context of network traffic data.
3.2. Unitextual anomalies
A unitextual anomaly is the hybridisation of both point and contextual properties, resulting in an instance that stands out due to global feature distinction (i.e. point) and when viewed within contextual normality (i.e. contextual). While the definitions of point and contextual anomalies are mutually exclusive, the existence of unitextual anomalies is based on the broad feature sets utilised by modern NADS. Whereby, some features will demonstrate a shift within the contextual short term (i.e. contextual), with others showcasing outright deviation (i.e. point).
An example of a unitextual anomaly is shown in Table , whereby instance eight simultaneously falls outside the global and contextual scope of normality (i.e. point and contextual), specifically regarding the abnormal occurrences of the Duration and Port features, respectively.
Table 5. Example of a unitextual anomaly in the context of network traffic data.
3.3. Polytextual anomalies
Polytextual anomalies result from the mixture of both collective and contextual anomaly characteristics. Such an anomaly can be considered instances that stand out due to successive instance repetition (i.e. collective) and when outside contextual normality (i.e. contextual). As shown in Table , instances seven through nine present abnormal successive repetition that simultaneously falls outside the contextual scope of normality due to the abnormal occurrence of 22 for the Port feature compared to the baseline.
Table 6. Example of a polytextual anomaly in the context of network traffic data.
3.4. Polyform anomalies
Finally, a polyform classification represents the mixture of all three types of point, collective and contextual anomalies. Such a hybrid would be defined by instances that stand out due to feature distinction (i.e. point), successive instance repetition (i.e. collective), and simultaneously appear outside the context of normality (i.e. contextual). Table presents an example of a polyform anomaly, whereby instances seven through nine fall outside the global scope of normality, specifically regarding the Duration feature. Additionally, the instances present abnormal successive repetition while simultaneously falling outside the contextual scope of normality of the previous baseline.
Table 7. Example of a polyform anomaly in the context of network traffic data.
4. Methodology
4.1. Datasets
Dataset selection was focused on allowing the analysis of various feature sets and various attack types. Based on these requirements, selected datasets included: UNSW-NB15, CIC-IDS2017, and three of the four NDSec-1 datasets (i.e. BYOD, Botnet, Wateringhole). The characteristics of which are highlighted in Table .
Table 8. Characteristics of the utilised datasets.
4.1.1. UNSW-NB15
UNSW-NB15 (Dahiya & Srivastava, Citation2018; Moustafa et al., Citation2017; Moustafa & Slay, Citation2015, Citation2016; Moustafa et al., Citation2017; Sarhan et al., Citation2020), is an emulated dataset consisting of real network traffic and synthetic attacks. The full dataset contains 2,540,044 captured network instances, with 47 unique features per instance. The dataset is fully labelled with each instance deemed normal or a specified attack type and was created due to the need for datasets to accurately represent modern attack vectors within network traffic environments. The dataset contains several unique attacks, including DoS, DDoS, reconnaissance, and exploits.
4.1.2. NDSec-1
NDSec-1 (Beer & Bühler, Citation2017; Beer et al., Citation2017) is a collection of datasets containing various synthetic attacks and real network traffic provided via a campus network. The collection consists of four unique data subsets: a bring-you-own-device (i.e. BYOD) variant, a Botnet-orientated dataset, a Wateringhole variation, and an “other” subset. However, as the “other” dataset contained little to no attack instances for mapping, only the BYOD, Botnet, and Wateringhole subsets were used. Each dataset contains 19 unique network features and varying attack types, including DoS, malware, web attacks, and spoofing.
4.1.3. CIC-IDS2017
The Canadian Institute for Cybersecurity developed CIC-IDS2017 (Sharafaldin et al., Citation2018) due to a lack of attack diversity, reliability, and traffic variety of existing datasets. The dataset contains 2,830,743 unique instances, with 78 features collected over five days. CIC-IDS2017 is an emulated dataset with naturally generated normal data and manually executed attacks. This fully labelled dataset contains numerous threats, including several DoS types, DDoS, botnet, brute force, and cross-site scripting (XSS).
4.2. Pre-processing
Due to the minimal representation of some attacks, the implications of missing data, and the presence of non-numerical data features, dataset pre-processing was conducted to improve overall analysis accuracy:
Attack types with less than ten total instances for a respective dataset were removed from the analysis to ensure that attacks with low sample populations did not limit anomaly characteristic identification. Removing Malware from NDSec-1 BYOD, Exploit from NDSec-1 Wateringhole, and Exploit, Miscellaneous, Web Attacks from NDSec-1 Botnet.
All individual feature values that presented null or infinite values were subsequently set to zero. This alteration was selected to preserve the type integrity of numerical feature types, preventing them from being unnecessarily encoded.
Features presenting non-numerical values were converted to numerical representations via casting to unique integers, ensuring all features could be analysed.
4.3. Association and mapping
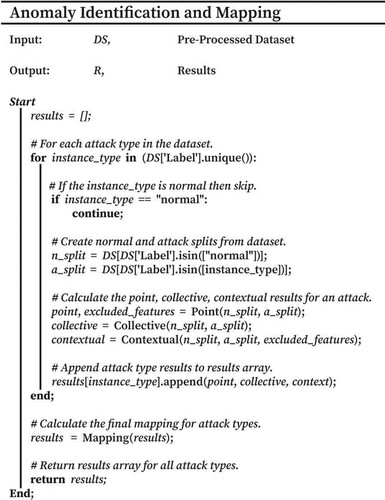
In order to map various attack types to respective anomaly classifications, an adapted version of the approach by Zoppi et al. (Citation2020) was utilised. Overall, this method enabled the anomaly characteristics of various attack types to be quantified and mapped. The pseudocode of which is shown in Figure . Further, all available features of each respective dataset were analysed in full to document all potential anomalous properties. The following section details the procedures used and how mapping was undertaken.
Figure 2. Pseudocode overall process of identification and mapping.
4.3.1. Point anomaly identification
Point anomaly identification was based on the principles of outright feature separation from the global normal and achieved using the pseudocode demonstrated in Figure . Firstly, global normality was established for each feature by calculating the mean and standard deviation of all non-attack instances. These feature means were then compared to the feature values of each attack instance, with those falling outside the normal feature mean by two or more standard deviations being tallied. This process was repeated for each attack instance, deriving the proportion of attacks demonstrating outright deviation for said feature. If more than 50% of the total attack instances demonstrated separation (i.e. the majority), the attack type was considered to display point anomaly characteristics for said feature.
Figure 3. Pseudocode demonstrating the identification of point anomalies.
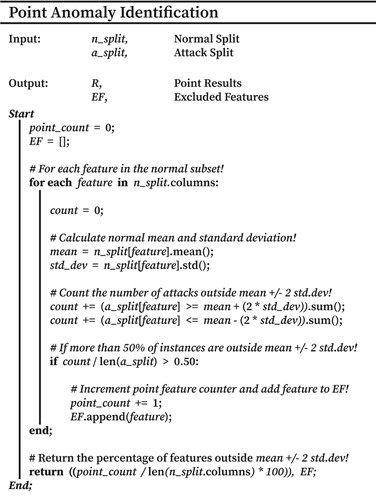
Once conducted on all available dataset features, the total number of features demonstrating point characteristics was divided by the number of features analysed. This calculation resulted in the percentage of features showcasing point anomaly characteristics for a particular attack type and, therefore, its association with a point anomaly. Further, to prevent cross-contamination, features presenting point anomaly characteristics were added to an exclusion set, preventing their review during contextual analysis.
4.3.2. Collective anomaly identification
Collective anomaly identification relied on reviewing the nearby surrounding instances of an attack for subsequent abnormal repetition (i.e. clustering), a hallmark of collectively associated anomalies (Zoppi et al., Citation2020).
As shown in Figure , firstly, each instance of an attack type had its prior and post 100 instances reviewed for identical attack repetition. The size of this review window was selected to maintain sensible collective identification capabilities, whereby too small of a window would reduce overall collective identification, and too large would artificially inflate the repetition count. Further, this window size ensured a suitable repetition time frame, allowing for the inclusion of normal instances in-between attack instances (Zoppi et al., Citation2020), as expected in a high volume, real-world networking scenarios.
Figure 4. Pseudocode demonstrating the identification of collective anomalies.
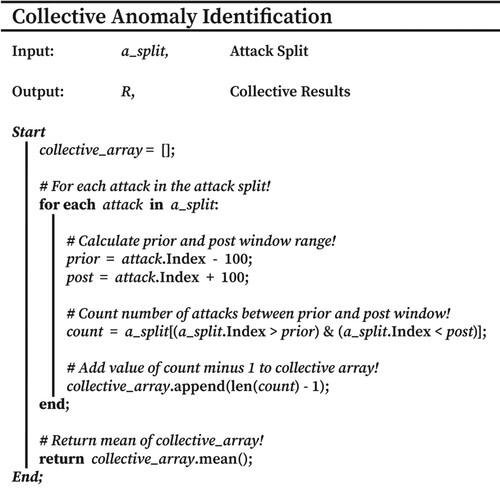
Each identical attack within this prior and post review window was then totalled, the value recorded, and the process repeated for each separate instance of an attack type. Once achieved, the mean number of repetitions was used to quantify an attacks association to that of a collective anomaly.
4.3.3. Contextual anomaly identification
Contextual anomaly identification was focused on the principle of deviation from the local normal and was arguably the hardest to identify. Research by Zoppi et al. (Citation2020) utilised the manual (i.e. visual) comparison of the 30 prior and five post non-attack instances to determine contextual association. However, this approach could be considered biased and prone to inaccuracy. To mitigate this, we use a fully automated approach, as shown in Figure , which removes the human interpretation bias of contextual analysis.
Figure 5. Pseudocode demonstrating the identification of contextual anomalies.
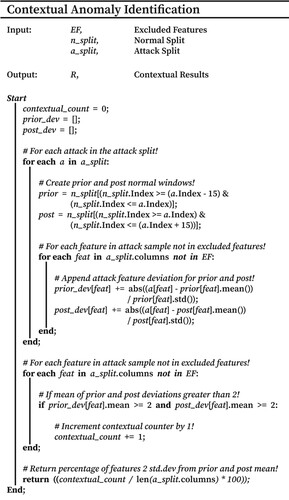
Firstly, each instance of an associated attack type had its closest 15 non-attack instances sampled both prior and post, establishing two windows of local normality (i.e. baselines). Identical prior and post window sizes were selected to prevent bias towards either window, reducing the chance of misidentification. Similarly, a window size of 15 allows the reliable establishment of local normal while maintaining computational time frames, a significant challenge for higher volume datasets.
Secondly, each feature not present in the excluded feature set (i.e. point-associated) was reviewed. During this, the mean and standard deviation of each feature's prior and post windows was compared to the associated feature values of an attack using Equation (Equation1(1)
(1) ). Whereby the feature value of an attack (x) was subtracted by the mean of the prior or post window (
) and then divided by the window's standard deviation (
). Finally, the absolute value was recorded and the process repeated for each attack instance.
(1)
(1) Once all attack instances had their prior and post deviation values calculated, each feature not contained within the excluded feature set (i.e. point-associated) was looped through again. Where for each feature, if its prior and post deviation results were both greater than or equal to two, the attack type was considered to showcase contextual deviation for said feature. Again, a minimum deviation of two was selected to maintain comparability to the deviation requirements of point anomaly identification, preventing association bias.
This process was repeated for all features, with the total number of features deemed contextual being tallied. This value was then divided by the number of features analysed, deriving the percentage of features presenting contextual qualities and, therefore, an attack type's association level to that of a contextual anomaly.
4.4. Anomaly type mapping
The final mapping of anomaly types used a threshold-based approach, whereby attack types demonstrating point, collective, or contextual results falling above a predefined threshold were mapped respectively. In the event of an attack type falling above multiple anomaly thresholds simultaneously, the attack was subsequently mapped to one of theorised heterogeneous anomaly types of Section 3. This procedure enabled attacks to be mapped explicitly to the traditional anomaly types and, if suitable, their mapping to one of the heterogeneous types, enabling the review of hybrid anomaly existence.
To enable fair point and contextual association and mapping, a dataset's respective thresholds were established by calculating the 90% mean of the anomaly association results produced or by using a static value of 12.50% (i.e. 1/8th of features), whichever was greater. For example, if attacks of a respective dataset demonstrated a mean point anomaly association of 20%, attacks falling above 18% (i.e. 90% of the mean) would be deemed to showcase point anomaly characteristics. In contrast, if the mean point associations were 10%, only attacks falling above 12.50% would be deemed to showcase point association. Similarly, this approach was also used for contextual identification.
This approach was selected to enable classification that accounted for the differing feature qualities of the datasets. Further, by only using 90% of the mean value, minor differences in the analysis could be accounted for while effectively highlighting attack-type qualities. Finally, a minimum threshold value of 12.50% was used to ensure that attack types were not misidentified due to minimal anomaly representation.
Similarly, collective anomaly classification assumed that excessive and sustained repetition was grounds for collective classification. A static threshold value of 20 was used to achieve this, whereby attack types presenting a collective result greater than this were deemed collective anomalies. This value was established by reviewing previously mapped attacks, whereby threshold values below 20 over-represented attacks as collective anomalies and values over 20 excluded well-established attacks (e.g. DoS).
Finally, if an attack type fell above no identifiable thresholds, it was subsequently mapped to that of a contextual anomaly by default. This procedure was selected due to the obfuscated nature of contextual anomalies, making them inherently difficult to detect. Further, given the vast number of available network features, there is a potential that the ideal feature set for detection is not utilised, preventing comprehensive contextual classification.
5. Experimental results
5.1. UNSW-NB15
The results of point, collective, and contextual analysis for the UNSW-NB15 dataset are presented in Table . Similarly, the table also presents the minimum thresholds for positive anomaly classification.
Table 9. Analysis results for the UNSW-NB15 dataset.
As highlighted in Figure (a), only the Fuzzer (12.766), Generic (12.766), and Worm (14.894) attack types fell above the 12.50% threshold for point classification. All other attacks fell significantly below the threshold, demonstrating relatively concise ranges of point anomaly association (4.255 – 6.383).
Figure 6. Anomaly association results for the UNSW-NB15 dataset. (a) Point (b) Collective (c) Contextual.
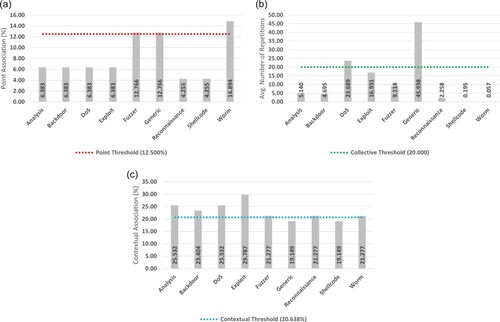
Collective analysis, as per Figure (b), demonstrates that both the DoS and Generic attack types fell above the minimum threshold of 20 repeats for positive classification. In contrast, a wide degree of variation between non-classified attack types is noted (0.057 – 16.931), highlighting the varying natures of attacks within the dataset.
Contextual analysis, as shown in Figure (c), demonstrated several attacks falling above the minimum threshold of 20.638%. These attacks included Analysis (25.532), Backdoor (23.404), DoS (25.532), Exploit (29.787), Fuzzer (21.277), Reconnaissance (21.277), and Worm (21.277). In general, all attacks of the UNSW-NB15 dataset showcased a relatively high contextual association, with the range of non-classified attack types being very stable (19.149).
Only the Shellcode attack did not fall above any thresholds for positive classification. Based on the procedure detailed in Section 4.4, this attack type was mapped as a contextual anomaly by default. Given the obfuscated nature of the attack and the proximity in which its contextual results fall regarding the threshold, this default mapping makes intuitive sense.
Based on these results, the final mapping of attack types is presented in Table . Most notable is the wide variety of heterogeneous classifications, with several attacks falling under the theorised types of Section 3. More specifically, the DoS attack type was deemed polytextual, both the Fuzzer and Worm attack types were deemed unitextual, and the Generic attack type was deemed a serriform anomaly. All other attack types were mapped to a purely contextual anomaly classification.
Table 10. Heterogeneous mapping for the UNSW-NB15 dataset.
5.2. NDSec-1 BYOD
The results of point, collective, and contextual analysis for the NDSec-1 BYOD dataset are presented in Table . Further, the table again presents the minimum thresholds for positive anomaly classification.
Table 11. Analysis results for the NDSec-1 BYOD dataset.
As shown in Figure (a), only the Misc (15.789) attack type fell above the 12.50% threshold for positive point classification. All other attack types fell significantly below this threshold, presenting a relatively concise range of values (0.000 – 5.263).
Figure 7. Anomaly association results for the NDSec-1 BYOD dataset. (a) Point (b) Collective (c) Contextual.
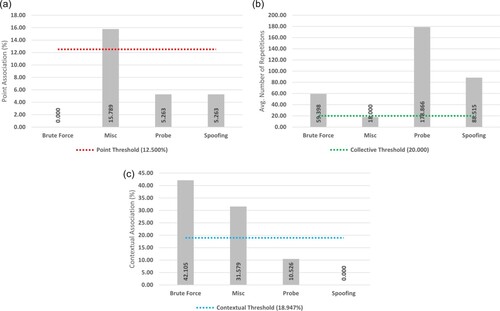
Collective identification, as shown in Figure (b), demonstrates that the Brute Force (59.398), Probe (178.866), and Spoofing (88.515) attack types all fell above the positive 20 average instance threshold. In contrast, the Misc (18.000) attack type was the only instance not deemed collective.
Figure c showcases the contextual results, with only the Brute Force (42.105) and Misc (31.579) attack types falling above the 18.947% threshold for positive classification. In contrast, the Probe (10.526) and Spoofing (0.000) attack types fell below the classification threshold.
Final mapping results are shown in Table . With heterogeneous mappings, including the polytextual classification of the Brute Force attack type and the unitextual classification of the Misc attack type. Both Probe and Spoofing attack types were subsequently mapped as purely collective anomalies.
Table 12. Heterogeneous mapping for the NDSec-1 BYOD dataset.
5.3. NDSec-1 Botnet
The results of point, collective, and contextual analysis for the NDSec-1 Botnet dataset are shown below in Table , with the table also detailing the minimum thresholds for positive anomaly classification.
Table 13. Analysis results for the NDSec-1 Botnet dataset.
As shown in Figure (a), none of the attack types fell above the 12.50% threshold for positive point classification, showcasing relatively low levels of point association (0.000 – 5.263). Of these attack types, the Botnet (0.000) showcased the lowest association, with both DoS (5.263) and Malware (5.263) attack types appearing equal.
Figure 8. Anomaly association results for the NDSec-1 Botnet dataset. (a) Point (b) Collective (c) Contextual.
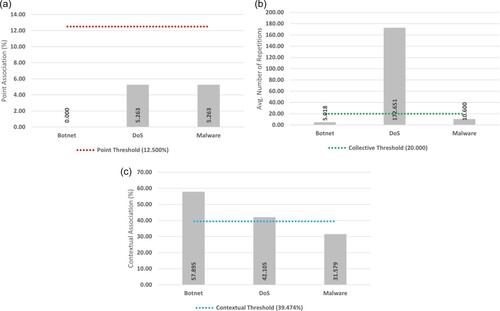
As per Figure (b), collective results indicated that only the DoS attack type (172.651) displayed enough repetitions to surpass the 20 instance threshold for positive collective classification. All other attack types fell below the minimum repetition threshold, demonstrating a relatively similar range (5.018 – 10.600).
Figure (c) showcases the contextual results, with only Botnet (57.895) and DoS (42.105) attack types falling above the minimum 39.474% threshold for positive classification. Subsequently, the Malware (31.579) attack type was deemed non-contextual.
Further, the Malware attack type was the only instance that did not fall above any thresholds. By default, this was mapped to that of a contextual anomaly, an outcome justified by its near-threshold contextual association.
Final mapping results are shown in Table . While the dataset only consists of three attack types, heterogeneous classifications are still present. More specifically, the DoS attack type resulted in a polytextual classification, with both Botnet and Malware attack types classified as purely contextual.
Table 14. Heterogeneous mapping for the NDSec-1 Botnet dataset.
5.4. NDSec-1 Wateringhole
The results of point, collective, and contextual analysis for the NDSec-1 Wateringhole dataset are presented below in Table , along with the minimum thresholds for positive anomaly classification.
Table 15. Analysis results for the NDSec-1 Wateringhole dataset.
Figure (a) demonstrated comparable point association results to that of the NDSec-1 Botnet dataset, with none of the attack types falling above the 12.50% minimum threshold for positive classification. Additionally, all attack types present a wide range of point associations (0.000 – 10.526), with Malware (10.526) presenting the strongest.
Figure 9. Anomaly association results for the NDSec-1 Wateringhole dataset. (a) Point (b) Collective (c) Contextual.
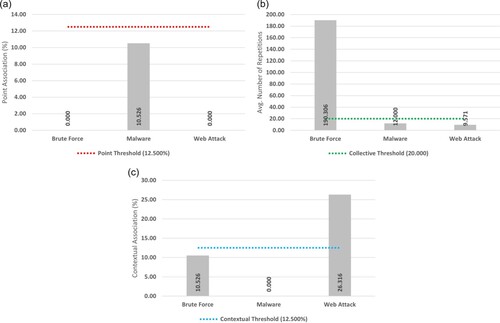
As presented in Figure (b), the collective analysis revealed only the Brute Force attack (190.306) falling above the 20 repeat threshold. In contrast, the Web Attack (9.571) and Malware (12.000) attack types fell below the threshold for classification.
Figure (c) demonstrates the contextual analysis, with only Web Attack (26.316) falling above the 12.50% threshold for positive classification. Falling below contextual classification were the Brute Force (10.526) and Malware (0.000) attack types.
As seen with the NDSec-1 Botnet dataset, the only attack type not falling above any threshold was the Malware attack type. Strangely, the attack presented no contextual association. However, as per Section 4.4, this attack type was mapped as a contextual anomaly by default.
The final mapping of the NDSec-1 Wateringhole dataset is presented in Table . No heterogeneous anomaly types were noted for this dataset, with each attack being mapped to a traditional type. More specifically, Brute Force was deemed collective, with Web Attack and Malware both being deemed contextual.
Table 16. Heterogeneous mapping for the NDSec-1 Wateringhole dataset.
5.5. CIC-IDS2017
The results of point, collective, and contextual analysis for the CIC-IDS2017 dataset are presented in Table . Similarly, the table also presents the minimum thresholds for positive anomaly classification.
Table 17. Analysis results for attacks in the CIC-IDS2017 dataset.
Point association results are shown in Figure (a), with several attack types falling above the minimum threshold of 15.330% for positive classification. This includes DDoS (24.359), DoS Goldeneye (19.231), DoS Hulk (33.333), DoS Slowhttptest (17.949), DoS Slowloris (19.231), Heartbleed (32.051), and Infiltration (16.667). All other attacks demonstrated a stable range of point association (10.256 – 11.538).
Figure 10. Anomaly association results for the CIC-IDS2017 dataset. (a) Point (b) Collective (c) Contextual.
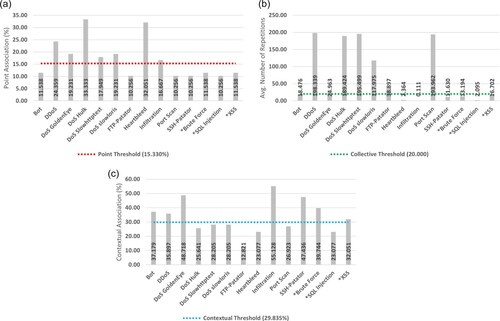
The collective analysis, as shown in Figure (b), also demonstrated several attack types falling above the 20 instances needed for classification. These attacks include, DDoS (198.339), DoS Goldeneye, (24.963), DoS Hulk (189.424), DoS Slowhttptest (195.499), DoS Slowloris (117.975), FTP-Patator (38.897), and Portscan (193.962). With non-classified attacks demonstrating a wide range of instance repetition (0.111 – 16.702).
Figure (c) highlights the contextual associations, with Bot (37.179), DDoS (35.897), DoS GoldenEye (48.718), Infiltration (55.128), SSH-Patator (47.436), Brute Force (39.744), and XSS (32.051) all classified as contextual. All non-classified attack types demonstrated a relatively wide range of contextual associations (12.821 – 28.205).
The only attack type not falling above any threshold was the SQL Injection attack type, which was mapped as contextual by default. This lack of outright classification is likely due to its web-orientated nature and lack of features regarding its payload.
The final mapping of the CIC-IDS2017 dataset is shown in Table . Most notable are the polyform classifications for the DDoS and DoS GoldenEye attack types, indicating their association with all three traditional anomaly types. Other heterogeneous classifications include serriform for the DoS Hulk, DoS Slowhttptest, and DoS Slowloris attack types and the unitextual classification for the Infiltration attack type.
Table 18. Heterogeneous mapping for the CICIDS-2017 dataset.
Traditionally classified attacks include the collective classifications for the Port Scan and FTP-Patator attack types, with the Heartbleed attack type being classified as a point anomaly. All other attack types were deemed contextual anomalies.
6. Discussion
Based on Section 5 there is compelling evidence to suggest the existence of heterogeneous anomalies, with all four theorised hybrids of Section 3 identified. While many attack types were still classified as traditional, heterogeneous anomalies were still present even amongst the smallest datasets.
Firstly, the NDSec-1 datasets exhibited polytextual hybrid classifications for the Brute Force and DoS attack types, a surprising result given the explicit collective associations of these attacks in prior works. Given this, the Brute Force attack of the Wateringhole subset was deemed purely collective, indicating potential variation among subset classifications. Further, the Misc attack of the NDSec-1 BYOD dataset also demonstrated heterogeneous properties, being classed as a unitextual anomaly. Given the various types of threats that could fall under this type of classification, the finding of hybridised qualities is not surprising.
Secondly, the UNSW-NB15 dataset also presented hybrid classifications, including a polytextual mapping of the DoS attack type. This identification supports the findings of the NDSec-1 dataset and the research by Zoppi et al. (Citation2020), lending credit to the existence of heterogeneous anomalies.
Additional classifications included the unitextual mapping of the Fuzzer and Worm attack types, attacks with known contextual underpinnings (Zoppi et al., Citation2021). Since both threats express ample point associations, a unitextual classification makes intuitive sense. However, considering the many features of the dataset, contextual attacks could likely present inherent global deviation (i.e. point characteristics). Raising the question of whether all contextually associated attack types can be associated with that of a point anomaly, given a broad enough feature set.
Further, the Generic attack type of the UNSW-NB15 dataset was classified as serriform, indicating the presence of both point and collective anomaly characteristics. As with the unitextual Misc attack of the NDSec-1 BYOD dataset, the Generic attack type is not a singular threat selection but a collection of many, highlighting how an attack's composition can readily impact final anomaly characteristics.
Thirdly, the CIC-IDS2017 dataset demonstrated the most comprehensive array of heterogeneous classifications, likely due to the number of attack types and variations present. Most notably were the polyform classifications for the DDoS and DoS GoldenEye attack types. While not identified in other datasets, these classifications demonstrate the broad potential for anomaly hybridisation.
Similarly, the dataset showcased several serriform classifications stemming from various DoS attack types, with findings from Zoppi et al. (Citation2020) also supporting these classifications. Given the inherent collective qualities of the attack type and the wide variety of features present within the dataset, this mapping also makes initiative sense. However, these classifications also highlight the impact of different feature sets for analysis, with various anomaly associations noted for DoS attack types over each dataset.
Additionally, the Infiltration attack type was deemed unitextual, a surprising result given its obfuscated nature. While undoubtedly contextually associated, the presence of point qualities would directly inhibit the attack's ability to occur without detection. However, as stated with the unitextual classifications of the UNSW-NB15 dataset, contextual attacks could present global deviation given a broad enough feature set.
Finally, regarding computational complexity, the unsupervised mapping scaled linearly with the number of features, instances, and attack types reviewed. Based on this, the computational time frames for the NDSec-1 (i.e. 19 features) datasets were the quickest, with the CICIDS-2017 (i.e. 78 features) dataset being the slowest.
6.1. Implications
Given the findings of heterogeneous anomalies throughout various datasets, several critical implications emerge. Firstly, many of the attacks reviewed present hybridised qualities, indicating that the traditional classification approach is ill-equipped to classify the variety expressed by the modern threat environment. While the proposed traditional classifications by Kendall (Citation1999) were ample upon their creation, there has been a significant increase in documented attack sub-types since its inception.
In line with this, the traditional classifications have dominated literature terminology to the point where novel hybrid research is becoming difficult to identify. A prime example of this is work concerning contextual collective anomaly detection (Araya etal., Citation2016; Dou et al., Citation2019; Jiang et al., Citation2014), which for the most part, has been ignored by security experts. Given that the heterogeneous classifications provide a more nuanced naming scheme, this would help disseminate future work.
More importantly, are the impacts that heterogeneous anomalies present towards the future of NADS development. Firstly, pure detection approaches are unlikely to offer the best detection performance. For example, an ideal point anomaly detection approach may only weakly detect unitextual associated threats, as their anomalous properties are distributed over multiple definitions. Supporting this is research by Jiang et al. (Citation2014), which points to the difficulty of singular methods for the simultaneous detection of anomaly types. An aspect undoubtedly heightened by the finding of additional heterogeneous types.
In contrast, a polyform associate threat is likely the easiest to identify due to its diverse presentation of all anomaly definitions. This broad characteristic profile would likely enable any traditional NADS to detect such an instance. However, because a polyform can present dynamic association to each traditional type, it may present weaker characteristics in the target area of a specific NADS. For example, the polyform mapped DDoS attack of the CIC-IDS2017 dataset appears to demonstrate a stronger association to point and collective characteristics rather than contextual ones. This difference would make NADS designed on the principles of contextual detection perform weaker on such an attack compared to collective or point-orientated ones.
Therefore, the development methods that acknowledge the presence of heterogeneous anomalies would significantly improve their overall capacity. Such an approach would improve the detection of both existing and emerging threats (i.e. zero-days), an area of specific security importance. Further, the inherent ability of NADS to refine analysis workload via pre-screening is critical in tackling the various big data issues facing the 21st century. An avenue of increasing industrial and academic interest given the rise of network anomaly summarisation research.
Finally, from a broader perspective, heterogeneous network anomalies also imply their presence in other anomaly domains, most notably in financial fraud detection and medical imaging (Ahmed, Citation2019). While undoubtedly unique areas, there is a strong intersection of the underlying principles of anomaly detection among them. Confirming these hybrids in other domains may drastically alter detection practices in various fields, a potentially lucrative crossover.
7. Conclusion and future work
Based on the repeated heterogeneous identifications found across datasets and the support of other anomaly research (Jiang et al., Citation2014; Kiani et al., Citation2020; Zoppi et al., Citation2020), it can be established that heterogeneous anomaly types do indeed exist. Going a step further, when looking at how anomaly identification is carried out against network attacks, forcing attacks into distinct best-fit traditional categories likely hamper both their detection and analysis. For example, using a collective anomaly approach to detect DDoS attacks could limit the scope of effectiveness as the contextual side of identification would be ignored. Future NADS research would benefit from including the considerations of heterogeneous anomalies and their unique characteristics, enabling improved detection and system robustness.
7.1. Future works
Future work aims to expand the mapping to other attacks and datasets, improving the understanding of how network attacks present themselves in surrounding data. Similarly, this would help facilitate existing and emerging attack classification, categorisation, and mitigation frameworks.
Furthermore, future mapping work would benefit from feature equalisation, given the variation of feature types among differing datasets. This could be achieved by selecting identical feature sets from the provided Packet Capture (PCAP) files for associated datasets, allowing future mapping research to draw more conclusive findings.
Similarly, further verification could be achieved via cross-attack anomaly detection (Zoppi et al., Citation2020), whereby attacks with identical heterogeneous anomaly mappings are used to train detection models. Based on a model's ability to identify identically mapped but differing attacks, further insight into heterogeneous detection could be achieved, improving future anomaly mapping endeavours and system robustness.
Finally, while the overall approach reduces the bias of other methods, using a threshold-based approach still introduces human judgement and interpretation. Future work would benefit from identifying improved mathematical methods for final classification to mitigate this.
Acronyms
Acknowledgements
This work has been supported by the Cyber Security Research Centre Limited whose activities are partially funded by the Australian Government's Cooperative Research Centres Programme.
Data Availability Statement
The data that support the findings of this study are openly available at:
(UNSW-NB15) https://research.unsw.edu.au/projects/unsw-nb15-dataset
(NDSec-1) https://www2.hs-fulda.de/NDSec/NDSec-1/
(CIC-IDS2017) https://www.unb.ca/cic/datasets/ids-2017.html
Disclosure statement
No potential conflict of interest was reported by the author(s).
References
- Ahmed, M. (2019). Data summarization: a survey. Knowledge and Information Systems, 58(2), 249–273. https://doi.org/10.1007/s10115-018-1183-0
- Ahmed, M., Mahmood, A. N., & Hu, J. (2016). A survey of network anomaly detection techniques. Journal of Network and Computer Applications, 60(1), 19–31. https://doi.org/10.1016/j.jnca.2015.11.016
- Araya, D. B., Grolinger, K., ElYamany, H. F., Capretz, M. A., & Bitsuamlak, G.. (2016). Collective contextual anomaly detection framework for smart buildings. International Joint Conference on Neural Networks (IJCNN). https://doi.org/10.1109/IJCNN.2016.7727242
- Ariyaluran Habeeb, R. A., Nasaruddin, F., Gani, A., Hashem, I., Ahmed, E., & Imran, M. (2018). Real-time big data processing for anomaly detection: a survey. International Journal of Information Management, 45(1), 289–307. https://doi.org/10.1016/j.ijinfomgt.2018.08.006
- Beer, F., & Bühler, U.. (2017). Feature selection for flow-based intrusion detection using Rough Set Theory. IEEE 14th International Conference on Networking, Sensing and Control (ICNSC). https://doi.org/10.1109/ICNSC.2017.8000162
- Beer, F., Hofer, T., Karimi, D., & Bühler, U.. (2017). 10. DFN-Forum Kommunikationstechnologien (pp. 11–20). Gesellschaft für Informatik e.V..
- Bhuyan, M. H., Bhattacharyya, D. K., & Kalita, J. K. (2013). Network anomaly detection: methods, systems and tools. IEEE Communications Surveys & Tutorials, 16(1), 303–336. https://doi.org/10.1109/SURV.2013.052213.00046
- Bovenzi, G., Aceto, G., Ciuonzo, D., Persico, V., & Pescapé, A.. (2020). A Hierarchical Hybrid Intrusion Detection Approach in IoT Scenarios. GLOBECOM 2020: IEEE Global Communications Conference. https://doi.org/10.1109/GLOBECOM42002.2020.9348167
- Chandola, V., Banerjee, A., & Kumar, V. (2009). Anomaly detection: A survey. ACM Computing Surveys (CSUR), 41(3), 1–58. https://doi.org/10.1145/1541880.1541882
- Chatterjee, A., & Ahmed, B. S. (2022). IoT anomaly detection methods and applications: a survey. Internet of Things, 19(1).https://doi.org/10.1016/j.iot.2022.100568
- Chen, L., Gao, S., & Cao, X. (2020). Research on real-time outlier detection over big data streams. International Journal of Computers and Applications, 42(1), 93–101. https://doi.org/10.1080/1206212X.2017.1397388
- Chen, W., Wang, Z., Zhong, Y., Han, D., Duan, C., Yin, X., Yang, J., & Shi, X.. (2021). ADSIM: Network Anomaly Detection via Similarity-aware Heterogeneous Ensemble Learning. 2021 IFIP/IEEE International Symposium on Integrated Network Management (IM). https://ieeexplore.ieee.org/document/9463987
- Cisco, U. (2020). Cisco annual internet report (2018–2023) white paper.
- Dahiya, P., & Srivastava, D. K.. (2018). A comparative evolution of unsupervised techniques for effective network intrusion detection in hadoop. International conference on advances in computing and data sciences. https://doi.org/10.1007/978-981-13-1813-9_28
- Dou, S., Yang, K., & Poor, H. V. (2019). PC 2 A: predicting collective contextual anomalies via LSTM with deep generative model. IEEE Internet of Things Journal, 6(6), 9645–9655. https://doi.org/10.1109/JIOT.2019.2930202
- Fernandes, G., Rodrigues, J. J., Carvalho, L. F., Al-Muhtadi, J. F., & Proença, M. L. (2019). A comprehensive survey on network anomaly detection. Telecommunication Systems, 70(3), 447–489. https://doi.org/10.1007/s11235-018-0475-8
- Guarino, I., Bovenzi, G., Di Monda, D., Aceto, G., Ciuonzo, D., & Pescapé, A.. (2022). On the use of Machine Learning Approaches for the Early Classification in Network Intrusion Detection. 2022 IEEE International Symposium on Measurements & Networking (M&N). https://doi.org/10.1109/MN55117.2022.9887775
- Hu, G., Wang, J., Liu, Y., Ke, W., & Lin, Y.. (2021). CCAD: A Collective Contextual Anomaly Detection Framework for KPI Data Stream. International Conference on Neural Information Processing. https://doi.org/10.1007/978-3-030-92307-5_53
- Jiang, Y., Zeng, C., Xu, J., & Li, T.. (2014). Real time contextual collective anomaly detection over multiple data streams. Proceedings of the ODD, 20–30. https://www.semanticscholar.org/paper/Real-time-contextual-collective-anomaly-detection-Jiang-Zeng/c878f99c2f0bb4be290f082470d803acf4048b16
- Kendall, K. K. R.. (1999). A database of computer attacks for the evaluation of intrusion detection systems (Thesis). Massachusetts Institute of Technology.
- Kiani, R., Keshavarzi, A., & Bohlouli, M. (2020). Detection of thin boundaries between different types of anomalies in outlier detection using enhanced neural networks. Applied Artificial Intelligence, 34(5), 345–377. https://doi.org/10.1080/08839514.2020.1722933
- Lee, C., Yi, L., Tan, L. H., Goh, W., Lee, B. S., & Yeo, C. K.. (2014). A Wavelet Entropy-Based Change Point Detection on Network Traffic: A Case Study of Heartbleed Vulnerability. 2014 IEEE 6th International Conference on Cloud Computing Technology and Science. https://doi.org/10.1109/CloudCom.2014.78
- Mirsky, Y., Doitshman, T., Elovici, Y., & Shabtai, A.. (2018). Kitsune: An Ensemble of Autoencoders for Online Network Intrusion Detection. Network and Distributed Systems Security Symposium (NDSS) 2018. https://doi.org/10.48550/arXiv.1802.09089
- Morgan, S. (2020). Cybercrime to cost the world $10.5 trillion annually by 2025 (Vol. 13) (No.11).
- Moustafa, N., Creech, G., & Slay, J.. (2017). Data Analytics and Decision Support for Cybersecurity (1, pp. 127–156). Springer International Publishing. https://doi.org/10.1007/978-3-319-59439-2_5
- Moustafa, N., Hu, J., & Slay, J. (2019). A holistic review of network anomaly detection systems: a comprehensive survey. Journal of Network and Computer Applications, 128(1), 33–55. https://doi.org/10.1016/j.jnca.2018.12.006
- Moustafa, N., & Slay, J.. (2015). UNSW-NB15: a comprehensive data set for network intrusion detection systems (UNSW-NB15 network data set). 2015 Military Communications and Information Systems Conference (MilCIS). https://doi.org/10.1109/MilCIS.2015.7348942
- Moustafa, N., & Slay, J. (2016). The evaluation of network anomaly detection systems: statistical analysis of the UNSW-NB15 data set and the comparison with the KDD99 data set. Information Security Journal: A Global Perspective, 25(1-3), 18–31. https://doi.org/10.1080/19393555.2015.1125974
- Moustafa, N., Slay, J., & Creech, G. (2017). Novel geometric area analysis technique for anomaly detection using trapezoidal area estimation on large-scale networks. IEEE Transactions on Big Data, 5(4), 481–494. https://doi.org/10.1109/TBDATA.2017.2715166
- Sarhan, M., Layeghy, S., Moustafa, N., & Portmann, M.. (2020). Big Data Technologies and Applications (1ed., pp. 117–135). Springer International Publishing. https://doi.org/10.1007/978-3-030-72802-1_9
- Sharafaldin, I., Lashkari, A. H., & Ghorbani, A. A.. (2018). Toward generating a new intrusion detection dataset and intrusion traffic characterization. Proceedings of the 4th International Conference on Information Systems Security and Privacy - ICISSP. https://doi.org/10.5220/0006639801080116
- Zhou, L., & Guo, H.. (2018). Anomaly Detection Methods for IIoT Networks. 2018 IEEE International Conference on Service Operations and Logistics, and Informatics (SOLI). https://doi.org/10.1109/SOLI.2018.8476769
- Zoppi, T., Ceccarelli, A., Capecchi, T., & Bondavalli, A. (2021). Unsupervised anomaly detectors to detect intrusions in the current threat landscape. ACM/IMS Transactions on Data Science, 2(2), 1–26. https://doi.org/10.1145/3441140
- Zoppi, T., Ceccarelli, A., Salani, L., & Bondavalli, A.. (2020). On the educated selection of unsupervised algorithms via attacks and anomaly classes. Journal of Information Security and Applications, 52(1). https://doi.org/10.1016/j.jisa.2020.102474