
Abstract
An Optical Waveguide Lightmode Spectroscopy (OWLS)-based immunosensor was developed for selective and sensitive determination of histamine content in fermented vegetable juices. The conjugate of the antigen (histamine-bovine serum albumin 10 µg mL−1) was attached on the amino modified sensor surface with glutaraldehyde. During the measurement standard solutions or samples were mixed with antibodies of appropriate concentration (1:1000), the mixture was incubated for 1 minute and injected into the OWLS system. The amount of antibodies bound to immobilised antigen conjugates was inversely proportional to the histamine content. Relative substrate specificity of the antibody was studied, and besides histamine, only putrescine, cadaverine and agmatine were found to give slight sensor responses. Fermented vegetable juice samples treated with different microorganisms were measured in 1000-fold dilution, and analytical data were compared to those measured by HPLC. It was concluded that the method is suitable for the sensitive and selective determination of histamine content.
Introduction
Biogenic amines are compounds commonly present in living organisms in which they are responsible for several essential physiological functions. At high concentrations, biogenic amines are risk factors for food intoxication (Schwelberger, Citation2009; Zaman et al., Citation2009), whereas at moderate levels they may trigger food intolerance (Bodmer, Imark, & Kneubühl, Citation1999; Jansen, van Dusseldorp, Bottema, & Dubois, Citation2003; Maintz & Novak, Citation2007) possibly due to genetic disorders in the regulation of histamine (Maintz et al., Citation2011). The most important biogenic amines occurring in foods are histamine, putrescine, cadaverine, tyramine, tryptamine, p-phenylethylamine, spermine and spermidine. Foods likely to contain biogenic amines include fish, fish products, meat products, eggs, cheeses, fermented vegetables, soybean products, beers and wines (Shalaby, Citation1996). They can be naturally present in many foods, but they can also be produced in high amounts by microorganisms through the activity of amino acid decarboxylases (Suzzi & Gardini, Citation2003). Certain bacteria produces the enzyme histidine decarboxylase during growth, which reacts with free histidine forming histamine. Once the enzyme histidine decarboxylase has been formed, it can continue to produce histamine in different types of foods even if the bacteria are no longer alive. In foods, amine levels are a good index of food decomposition (Carsol & Mascini, Citation1999).
In different studies, food samples were investigated to determine their freshness or quality. Sauerkraut and shredded white cabbage preservation by lactic fermentation (Kalac, Spicka, Krizek, Steidlova, & Pelikanova, Citation1999), kimchi products (Tsai et al., Citation2005), the effect of roasting in high and low quality coffee (Oliveira, Franca, Gloria, Lucia, & Borges, Citation2005) and musts and wines from different regions, varieties and vintages (Herbert, Cabrita, Ratola, Laureano, & Alves, Citation2005; Kiss & Sass-Kiss, Citation2005) were investigated. Histamine, cadaverine and agmatine could be used as quality or freshness indices for tuna (Ruiz-Capillas & Moral, Citation2005).
A wide variety of procedures for the determination of histamine have been published in the last decades. Thin-layer chromatography was used as an inexpensive, yet only semi-quantitative method (Lieber & Taylor, Citation1978). High-performance liquid chromatography (HPLC) with either pre-column or post-column derivatisation by different reagents (o-phthaldialdehyde and dansyl chloride) can be used (Hui & Taylor, Citation1983; Meitz & Karmas, Citation1978; Moret, Smela, Populin, & Conte, Citation2005; Saito, Horie, Nose, Nakagomi, & Nakazawa, Citation1992; Veciana-Nogues, Hernandez-Jover, Marine-Font, Vidal-Carou, Citation1995). The fluorometric derivatisation assay has been used routinely for 20 years as a basic histamine determination (Rogers & Staruszkiewicz, Citation1997; Staruszkiewicz, Waldron, & Bond, Citation1977).
Enzyme-based biosensors using oxygen electrode or other electrochemical detection after trichloroacetic acid extraction have been reported using various types of enzymes, such as purified amine oxidase or diamine oxidase from different sources (Lerke, Porcuna, & Chin, Citation1983; Lopez-Sabater, Rodriguez-Jerez, Roig-Sagues, & Mora-Ventura, Citation1993; Ohashi et al., Citation1994). Histamine membrane sensors were prepared by incorporating thiopyrilium derivative as a charged carrier with a linear measuring from 2.5×10⁻⁶ to 1.0×10⁻¹ mol L−1 (Javanbakht, Ganjali, Norouzi, Abdouss, & Riahi, Citation2008).
Enzyme-linked immunosorbent assays (ELISAs) are specific and sensitive (1–500 mg kg−1), but also require laborious sample extraction and extended incubation periods (Serrar, Brebant, Bruneau, & Denoyel, Citation1995). A dipstick test developed for histamine is rapid, but is only applicable over a very narrow concentration range (Hall, Eldridge, Saunder, Fairclough, & Bateman, Citation1995). Although these methods are quick and simple, their sensitivity is not high enough in some analytical cases. Therefore, the development of immunosensors recently came into the focus of sensor investigation. Recently, several research groups developed biosensors by substituting the biological receptors with biomimetic layers, molecularly imprinted polymers combined with different detectors, such as impedance spectroscopy (Bongaers et al., Citation2010; Broeders et al., Citation2011), microgravimetry (Horemans et al., Citation2010) or piezoelectric sensor (Pietrzyk, Suriyanarayanan, Kutner, Chitta, & D'Souza, Citation2009).
Among the aforementioned sensor techniques, the optical waveguide lightmode spectroscopy (OWLS) technique (Lukosz & Tiefenthaler, Citation1983; Ramsden, Citation1999) has been applied with success to detect different molecules based on the antigen antibody reaction. OWLS is an optosensor technique using evanescent field for the in situ and label-free study of surface processes at molecular levels (Duveneck, Abel, Bopp, Kresbach, & Ehrat, Citation2002; Tiefenthaler, Citation1992; Vörös et al., Citation2002). OWLS technique is based on the precise measurement of the resonance angle of polarised laser light, diffracted by a grating and incoupled into a thin waveguide. This incoupling resonance occurs at very precise angles depending on the optical parameters of the sensor chips and the complex refractive index of the covering sample medium. The refractive index, determined from the resonance incoupling angle detected at high accuracy, allows determination of layer thickness and coverage (or mass) of the adsorbed or bound material with ultra-high sensitivity and it allows construction of chemosensors and biosensors, and applications for direct sensing of various kinds of biomolecules by immobilising bioactive substances on the waveguide surface specific for the molecule of interest. As a result, OWLS detection has gained importance in environmental and food analysis (Székács, Adányi, Székács, Majer-Baranyi, & Szendrő, Citation2009).
The aim of our present work was to demonstrate the sensitivity, selectivity and the efficiency of OWLS technique using direct and indirect immunosensors for measuring the biogenic amine content in different vegetable juices (e.g. sauerkraut, leavened cucumber, pickles, carrots, etc.).
Materials and methods
Materials
Anti-histamine antibody (developed in rabbit against a histamine-KLH conjugate) and immunogens such as histamine, putrescine, cadaverine, agmatine, spermine, spermidine, tryptophan and other chemicals were obtained from Sigma-Aldrich Co. LLC (St. Louis, MO, USA) unless otherwise stated. The total protein content of the antibody solution was 23.4 mg mL−1.
Instrumental
OWLS measurements were undertaken by using integrated optical waveguide sensors (chips) type OW2400 (MicroVacuum, Budapest, Hungary). The sensors were read out with an OWLS100 instrument controlled by the BioSense 2.2 software (MicroVacuum, Hungary).
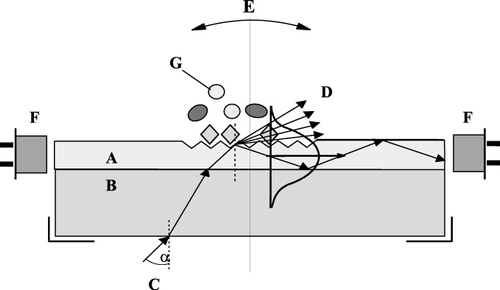
shows the measurement principle of the OWLS instrumentation. The sensor is constructed of an optical waveguide layer (A) on top of a glass support (B) and of a fine optical grating made in the waveguide. When a polarised laser beam (C) (He–Ne laser with 632.8 nm wavelength) reaches the grating, it is diffracted. The angle of diffraction depends not only on the optical parameters of the sensor, but also on the refractive index of the covering medium. The waveguide is gradually rotated around its rotation axis, and when the diffracted beam is incoupled into the waveguide, it is propagating towards the edge of the sensor through multiple internal reflections. The intensity of the incoupled light is measured with a photodiode (F). The light intensity versus the incoupling angle follows a sharp, resonant peak profile. By measuring the incoupling angle versus time, changes of the refractive index can be followed in real time. The change of the effective refractive index due to the presence/association/dissociation of the analyte molecules at the sensor surface results in a shift in the incoupling resonance angle. Association/dissociation of molecules on the surface of the sensor chip can be followed with high precision without labelling and in real time by continuously measuring the change in the incoupling angle.
All the experiments were performed in a flow-injection analyzer (FIA) system. The sensors were placed into the holder of the OWLS100 fixed with a flow-through cell (cuvette) and the instrument was connected to the FIA system containing a peristaltic pump (Minipuls3, Gilson, Middletown, WI, USA) and an injector (Rheodyne, Rohnert Park, CA, USA) equipped with an injector loop of 200 µL. A flow rate of 200 µL min−1 was maintained during the experiments. OWLS experiments were carried out using amino functionalised waveguide sensors, which were silanised by aminopropyltriethoxysilane (Trummer, Adányi, Váradi, & Szendrő, Citation2001).
Preparation of histamine-bovine serum albumin (BSA) antigen-conjugate
Histamine is commonly conjugated to carrier proteins using homobifunctional cross-linkers hexamethylene diisocyanate, glutaric anhydride or glutaraldehyde. In the present study, BSA was succinylated in order to introduce appropriate carboxyl groups in the protein for subsequent conjugation of histamine. Thus, 10 mg (16.7 µmol) of BSA was dissolved in 10 mL of 0.2 M aqueous dipotassium hydrogen phosphate. In a separate reaction vessel, 10 mg (100 µmol) of succinic anhydride was dissolved in 1 mL of 3 M aqueous sodium hydroxide, and this solution was slowly added to the protein solution and the reaction mixture was stirred for 5 hours at room temperature. The resulting solution was dialysed against distilled water for 2 days with two-hourly changes of distilled water, and was lyophilised to yield 11.3 mg product.
Histamine was conjugated to succinylated BSA. To a solution of 10 mg (0.16 µmol) of succinylated BSA in 1.5 mL of dry dimethyl formamide under argon atmosphere were added 5.4 mg (72 µmol) N-hydroxy-succiminide (NHS) and 13.8 mg (72 µmol) 1-[3-(dimethylamino)propyl]-3-ethylcarbodiimide hydrochloride (EDC). The solution was stirred for 2 hours at room temperature and was filtered. A solution of 6.9 mg (62 µmol) histamine in 0.35 mL of dimethylformamide was added to the cooled and stirred reaction mixture at 4°C, the mixture was stirred for 24 hours at 4°C, then 7 mL of distilled water was added and the solution was dialysed against distilled water for 1 day with hourly changes of distilled water. The resulting solution was further characterised by isoelectric focusing on polyacrylamide gel using 6 M urea and Ampholine, pH 3-10. The yield of clean product of histamine-BSA conjugate was 82% of the calculated mass and the protein content was 23.4 mg mL−1 measured by the Bradford method (Citation1976); the product was used in the OWLS experiments detailed below.
Immobilisation of protein type molecules on the waveguide layer
For the bio-sensitisation of the chips, the proper protein type biomolecules were attached on the amino modified sensor surface. Activation of the amino silanised sensors was performed by injecting glutaraldehyde (2.5% in distilled water). Then the surface was washed with distilled water and with tris(hydroxymethyl)aminomethane (TRIS) buffer (42 mM, pH 7.4) for a few minutes. For measurements, anti-histamine antibodies diluted to 1:500 in TRIS buffer for the direct method and histamine-conjugate (10 µg mL−1) for the indirect method were immobilised onto the surface. To remove loosely bound molecules 50 mM HCl was injected upon immobilisation. After this step, the chip was ready to measure histamine standard solutions of different concentrations.
Sample preparation
Sauerkraut, leavened cucumber, pickles and fermented vegetable juice samples were purchased on a retail market. Only the juice of the samples was used for the determination of histamine. In order to minimise the matrix effect of the juices, the samples were filtered on a ultrafiltration membrane with a cut off of 100.000 NMWL (Millipore Corporation, Bedford, MA, USA) by centrifuging the samples at 5000 rpm for 10 min. The filtrates were stored at 4°C before the OWLS measurement.
Determination of histamine by HPLC method
Separation of the amines was performed with an Alliance Waters 2690 HPLC chromatographic system supplied with Waters 474 fluorescence detector (345 and 455 nm, Waters Corporation, Milford, MA, USA). The biogenic amines were separated and quantified with ion-pair formation (octanesulfonic acid) on reverse phase column (µBondapak C18, 300 × 3,9 mm, 10 µm; from Waters) using post-column derivatisation (o-phtalaldehyde, 2-mercaptoethanol) and gradient elution. Samples were injected directly to the column after filtration and dilution.
Results and discussion
When measuring directly the antigen molecules by using OWLS technique, antibodies were immobilised covalently on the functionalised sensor surface. In the case of the competitive measurement method, the antigen conjugated with BSA was attached to the surface. The histamine-BSA conjugate is needed for the immobilisation process, because of spatial problems when immobilising only the histamine antigen on the sensor surface. Standards and samples were mixed in 1:1 ratio with solutions containing known amount of antibodies, the mixture was incubated for a short time and injected into the system. The amount of antibodies bound to the immobilised conjugates was inversely proportional to the quantity of the antigen in the standard solutions.
Direct measurement of histamine
Experiments were designed to study detection possibilities of histamine in a direct manner. For this purpose, the antibodies were attached on the amino modified sensor surface as detailed in section ‘Immobilization of protein type molecules on the waveguide layer’.
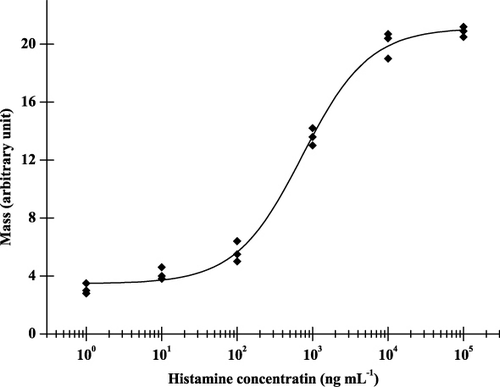
Sensor responses were obtained only above 10 ng mL−1 histamine concentration, but at this concentration the responses were unstable. Increasing the concentration of the standards, responses did not increase to a high degree, the layer fast saturated. A typical calibration curve obtained for histamine analyte is shown in . In such systems, high molecular weight (≈180 kDa) serum proteins were applied for immobilisation. It was, therefore, assumed that the relatively high limit of detection (LOD) was due to the small molecular weight of the histamine antigen (111.1 Da). As it has been pointed out before (Székács, Trummer, Adányi, Váradi, & Szendrő, Citation2003), poor sensitivity is not very surprising as the binding of such small analytes does not represent a high relative mass increase compared to the molecular mass of antibodies, therefore, does not produce strong signals in the OWLS system. From these results, it is apparent that the LOD of this method is not sufficiently low for investigation of food samples. To overcome this problem, to get a lower LOD, a competitive method was also investigated. In this measuring manner the antigen-protein conjugate is immobilised on the surface while the free antibody binding to the conjugate causes much higher response, than the antigen before.
Competitive assay of measuring histamine
When measuring by the binding inhibition test method, with the immobilised antigen-based, competitive way, the conjugate of the histamine formed with BSA was immobilised onto the waveguide surface via covalent coupling. Standards and samples were mixed with the appropriate dilution of the serum containing known excess amounts of antibodies; the mixtures were incubated for 1 minute and were injected into the flowing system. During determination, biogenic amine content of the solution is measured, while the conjugate immobilised on the surface binds to (or compete) the available antibodies in the mixture. Upon incubation, only antibodies remaining in free form in the sample mixture bound to the antigens immobilised on the sensor surface. Thus, the amount of antibodies bound to the surface of the chip was inversely proportional to the histamine content in the samples. This is a rather sensitive equilibrium; therefore, the choice of the appropriate analysis parameters is very important. The antibody concentration in the antiserum is one of the parameters of key importance, because increasing histamine concentrations in the samples result in larger decreases in the assay signal.
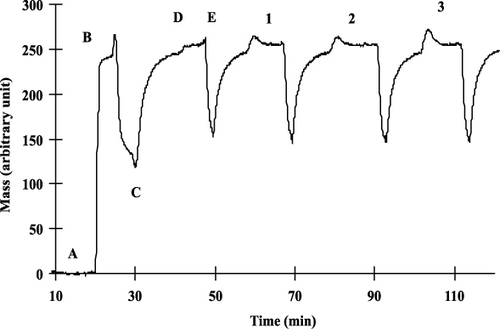
With the sensitised chip, the optimal dilution rate of the antibody was determined first. Concentration of the histamine-BSA conjugate applied for the immobilisation procedure was 10 µg mL−1. shows the entire measured graph including the immobilisation steps and the sensor responses obtained for histamine antibody solutions of different concentrations. The steps for the immobilisation were the same as detailed earlier. To find the adequate antibody concentration, antiserum against histamine was measured between different dilutions (1:100, 1:500, 1:1000, 1:2000 and 1:5000). shows sensor responses given for histamine antibody solutions at different concentrations (1:500, 1:1000, 1:2000 dilutions). When there is a smaller amount of proteins (1:5000 dil.) in the solution, monoclonal antibodies saturate poorly the surface and small response (only about 10 arbitrary units) can be obtained. In the case of higher concentrations (1:100 dilution), although the signal obtained is well measurable (about 25–30 arbitrary units), the surface becomes saturated, it loses its sensitivity while measuring standards and samples. For the measurements we chose monoclonal antibody concentration that gives already well-measurable signal (about 20 arbitrary units) with the solution containing not too many antibodies to be sensitive enough for the antigen containing standards. Taking the height and shape of the signals into consideration, in the case of competitive measurement of histamine, the monoclonal antibody stock solution was diluted to 1:1000.
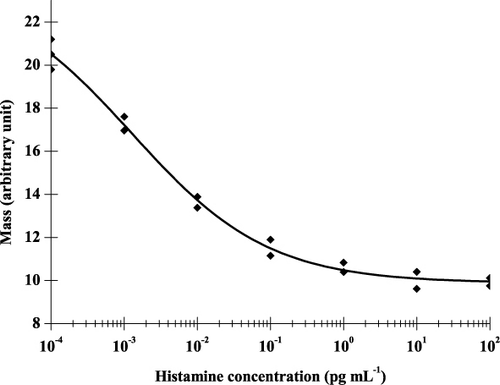
During the measurement, standard solutions containing different amounts of the toxin were mixed with antibodies of appropriate concentration, the mixture was incubated for 1 minute and injected into the OWLS system. Antibodies that remained in free form in the mixture bound to immobilised antigen-BSA conjugates. The amount of antibodies bound to the surface of the chip was inversely proportional to the biogenic amine content in the sample (). Antigen standards were measured in the range of 10−3−102 pg mL−1. The sensitive detection range of the competitive detection method was between 10−2−1 pg mL−1. This LOD (10−2 pg mL−1) is orders of magnitude better, than that obtained by Li et al. (Citation2006) in an SPR-based indirect competitive immunosensor offering an IC50 value of 7 ng mL−1 and an LOD of 3 ng mL−1 of histamine. It has to be noted, however, that this improvement in the detection range corresponds to the method performed in buffer solution. Both signal stability requirements and possible matrix effects in real samples are expected to moderate the range of detectable biogenic amine concentration of the OWLS sensor for real analytical samples.
As the results show, the performed experiments established the bases for developing immunosensors to detect biogenic amines with high sensitivity. The immobilised antigen-based, indirect method, however, offer much better sensitivity characteristics. In this case, binding of the antibodies (≈180 kDa) to the immobilised antigen conjugate (≈65 kDa) is allowed or inhibited by the presence of the immunoreactive antigen in the sample.
Substrate specificity of histamine antibody
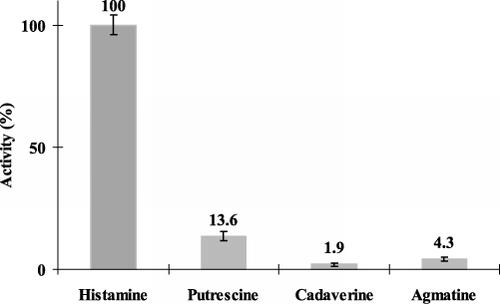
Depending on sample types and on the origin of the food samples, not only histamine occurs in the samples, but other different biogenic amine compounds as well. We studied relative substrate specificity of the antibody used. For this purpose, various biogenic amines (putrescine, cadaverine, agmatine, spermine, spermidine, tryptamine) were applied to the above competitive OWLS measurement protocol at a set concentration of 10−2−1 pg mL−1 and signal intensities were compared to each other. This chosen analyte concentration level is near to the upper detection limit of histamine in the OWLS system, therefore, significant signals by interfering biogenic amines can be expected. It was found that only putrescine, cadaverine and agmatine gave sensor response, and their responses remained moderate to slight (). Signal interference was above 10% only for putrescine (13.6%), it remained below 5% for agmatine and cadaverine (4.3% and 1.9%, respectively). When measuring spermine, spermidine, tryptamine standards, no signal could be detected. In consequence, the cross-reactivity of these biogenic amines is evaluated as negligible, and it could be concluded that the competitive OWLS sensor is selective for the histamine antigen.
Biogenic amine content of vegetable juice samples
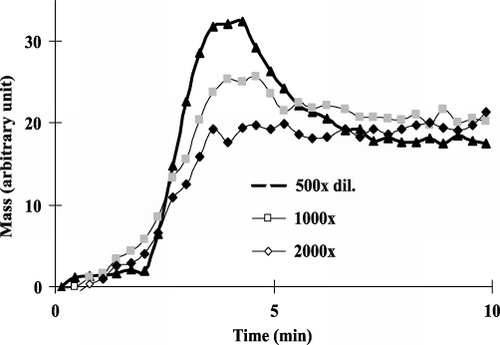
After the investigation of the indirect immunoanalytical method, vegetable juice samples prepared as detailed in Sample preparation were investigated. Dilutions were prepared from the samples in the rate of 1:100, 1:1000 and 1:10000 with buffer, and were analysed using the competitive assay. Measuring the 1:100 diluted samples, responses were very high (about 30–35 arbitrary units, data not shown) because of the matrix effect (e.g. high salt content); however, the responses were stable and reliable. On the other hand, the number of samples measured by the sensor was low, the lifetime of the sensor decreased. When the samples were measured in 1:1000 dilution, the peaks were still well evaluable and 25–30 samples could be measured by one sensor after each other. The histamine content was calculated on the basis of the calibration curve obtained by the standard solutions and the results were validated by standard addition. When diluting the samples 1:10000 rate, the responses according to the concentrations were in a low measuring range. According the results histamine content could be determined when using 1:1000 diluted samples. In this case the matrix effect was eliminated, and the calibration curve was suitable to determine the histamine content of spiked samples.
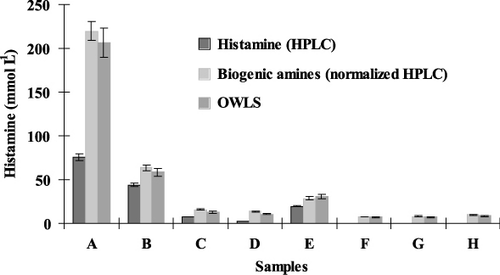
Table 1. The concentrations of the different biogenic amines determined by HPLC.
The concentrations of the different biogenic amines determined by HPLC are presented in . Results obtained for different vegetable juices by the immunosensor were compared to those measured by HPLC and summarised in . According our results it is to be noticed, that the results measured with OWLS method are higher, than the histamine content of the samples determined by HPLC. When the HPLC results were calculated by taking into consideration of the selectivity rate of the OWLS method determined before, the two different measuring techniques corresponded to each other excellenty, R 2 was 0.99.
On the basis of the novel results it can be stated, that the OWLS-based immunosensor provides reliable results on the level of the biogenic amine, histamine. Histamine concentrations detected by the competitive OWLS immunosensor have been readily verified by HPLC.
Conclusions
Common enzyme-based bioanalytical methods detect all biogenic amines, and the exact quantity or compositional proportion of each component needs to be determined by complex instrumental analytical methods. On the basis of our results, it is concluded that the performed experiments established the bases for developing immunosensors to detect histamine with high sensitivity and selectivity. The immobilised antigen-based, indirect method offer an outstanding sensitivity of 10−2 pg mL−1, allowing rapid, sensitive and selective determination of histamine.
References
- Bodmer, S., Imark, C., & Kneubühl, M. (1999). Biogenic amines in foods: Histamine and food processing. Inflammation Research, 48, 296–300.
- Bongaers, E., Alenus, J., Horemans, F., Weustenraed, A., Lutsen, L., Vanderzande, D., … Wagner, P. (2010). A MIP-based biomimetic sensor for the impedimetric detection of histamine in different pH environments. Physica Status Solidi A, 207, 837–843.
- Bradford, M. (1976). A rapid and sensitive method for the quantitation of microgram quantities of protein utilizing the principle of protein-dye binding. Analytical Biochemistry, 72, 248–254.
- Broeders, J., Duchateau, S., Van Grinsven, B., Vanaken, W., Peeters, M., Cleij, T., … De Ceuninck, W. (2011). Miniaturised eight-channel impedance spectroscopy unit as sensor platform for biosensor applications. Physica Status Solidi A, 208, 1357–1363.
- Carsol, M. A., & Mascini, M. (1999). Diamine oxidase and putrescine oxidase immobilized reactors in flow injection analysis: A comparison in substrate specificity. Talanta, 50, 141–148.
- Duveneck, G. L., Abel, A. P., Bopp, M. A., Kresbach, G. M., & Ehrat, M. (2002). Planar waveguides for ultra-high sensitivity of the analysis of nucleic acids. Analytica Chimica Acta, 469, 49–61.
- Hall, M., Eldridge, D. B., Saunder, R. D., Fairclough, D. L, & Bateman, R. C. (1995). A rapid dipstick test for histamine in tuna. Food Biotechnology, 9, 39–57.
- Herbert, P., Cabrita, M. J., Ratola, N., Laureano, O., & Alves, A. (2005). Free amino acids and biogenic amines in wines and musts from the Alentejo region. Evolution of amines during alcoholic fermentation and relationship with variety, sub-region and vintage. Journal of Food Engineering, 66, 315–322.
- Horemans, F., Alenus, J., Bongaers, E., Weustenraed, A., Thoelen, R., Duchateau, J., … Cleij, T. J. (2010). MIP-based sensor platforms for the detection of histamine in the nano- and micromolar range in aqueous media. Sensors and Actuators B: Chemical, 148, 392–398.
- Hui, J. Y., & Taylor, S. L. (1983). High pressure liquid chromatographic determination of putrefactive amines in foods. Journal of the Association of Official Analytical Chemists, 66, 853–857.
- Jansen, S. C., van Dusseldorp, M., Bottema, K. C., & Dubois, A. E. J. (2003). Intolerance to dietary biogenic amines: A review. Annals of Allergy, Asthma & Immunology, 91, 233–241.
- Javanbakht, M., Ganjali, M. R., Norouzi, P., Abdouss, M., & Riahi, S. (2008). Development of polymeric membrane sensor for the determination of histamine: Experimental and theoretical study. Analytical Letters, 41, 619–639.
- Kalac, P., Spicka, J., Krizek, M., Steidlova, S., & Pelikanova, T. (1999). Concentrations of seven biogenic amines in sauerkraut. Food Chemistry, 67, 275–280.
- Kiss, J., & Sass-Kiss, A. (2005). Protection of originality of Tokaji Aszu. Amines and organic acids in botrytised wines by HPLC. Journal of Agricultural and Food Chemistry, 53, 10042–10050.
- Lerke, P. A., Porcuna, M. N., & Chin, H. B. (1983). Screening test for histamine in fish. Journal of Food Science, 48, 155–157.
- Li, Y., Kobayashi, M., Furui, K., Soh, N., Nakano, K., & Imato, T. (2006). Surface plasmon resonance immunosensor for histamine based on an indirect competitive immunoreaction. Analytica Chimica Acta, 576, 77–83.
- Lieber, E. R., & Taylor, S. L. (1978). Thin-layer chromatographic screening methods for histamine in tuna fish. Journal of Chromatography, 153, 143–152.
- Lopez-Sabater, E. I., Rodriguez-Jerez, J. J., Roig-Sagues, A. X., & Mora-Ventura, M. T. (1993). Determination of histamine using an enzymic method. Food Additives & Contaminants, 10, 593–602.
- Lukosz, W., & Tiefenthaler, K. (1983). Directional switching in planar waveguides effected by adsorption-desorption processes, 2nd European Conference on Integrated Optics, Florence, Italy, LEE Conference Publication No. 227, London, 152–155.
- Maintz, L., & Novak, N. (2007). Histamine and histamine intolerance. American Journal of Clinical Nutrition, 85, 1185–1196.
- Maintz, L., Yu, C. F., Rodríguez, E., Baurecht, H., Bieber, T., Illig, T., … Novak, N. (2011). Association of single nucleotide polymorphisms in the diamine oxidase gene with diamine oxidase serum activities. Allergy, 66, 893–902.
- Meitz, J. L., & Karmas, E. (1978). Polyamine and histamine content of rockfish, salmon, lobster, and shrimp as an indicator of decomposition. Journal of the Association of Official Analytical Chemists, 61, 139–145.
- Moret, S., Smela, D., Populin, T., & Conte, L. S. (2005). A survey on free biogenic amine content of fresh and preserved vegetables. Food Chemistry, 89, 355–361.
- Ohashi, M., Numura, F., Suzuki, M., Otsuka, M., Adachi, O., & Arakawa, N. (1994). Oxygen-sensor-based simple assay of histamine in fish using purified amine oxidase. Journal of Food Science, 59, 519–522.
- Oliveira, S. D., Franca, A. S., Gloria, M. B. A., Lucia, M., & Borges, A. (2005). The effect of roasting on the presence of bioactive amines in coffees of different qualities. Food Chemistry, 90, 287–291.
- Pietrzyk, A., Suriyanarayanan, S., Kutner, W., Chitta, R., & D'Souza, F. (2009). Selective histamine piezoelectric chemosensor using a recognition film of the molecularly imprinted polymer of bis(bithiophene) derivatives. Analytical Chemistry, 81, 2633–2643.
- Ramsden, J. J. (1999). OWLS: A versatile technique for sensing with bioarrays. Chimia, 53, 67–71.
- Rogers, P. L., & Staruszkiewicz, W. F. (1997). Gas chromatographic method for putrescine and cadaverine in canned tuna and mahimahi and fluorometric method for histamine (minor modification of AOAC official method 977.13): Collaborative study. Journal of the Association of Official Analytical Chemists, 80, 591–602.
- Ruiz-Capillas, C., & Moral, A. (2005). Sensory and biochemical aspects of quality of whole bigeye tuna (Thunnus obesus) during bulk storage in controlled atmospheres. Food Chemistry, 89, 347–354.
- Saito, K., Horie, M., Nose, N., Nakagomi, K., & Nakazawa, H. (1992). Determination of polyamines in foods by liquid chromatography with on-column fluorescence derivatization. Analytical Sciences, 8, 675–680.
- Schwelberger, H. G. (2009). Histamine intolerance: Overestimated or underestimated? Inflammation Research, 58, 51–52.
- Serrar, D., Brebant, R., Bruneau, S., & Denoyel, G. A. (1995). The development of a monoclonal antibody-based ELISA for the determination of histamine in food: Application to fishery products and comparison with the HPLC assay. Food Chemistry, 54, 85–91.
- Shalaby, A. R. (1996). Significance of biogenic amines to food safety and human health. Food Research International, 29, 675–690.
- Staruszkiewicz, W. F., Waldron, E. M., & Bond, J. F. (1977). Fluorometric determination of histamine in tuna: Development of method. Journal of the Association of Official Analytical Chemists, 60, 1125–1131.
- Suzzi, G., & Gardini, F. (2003). Biogenic amines in dry fermented sausages: A review. International Journal of Food Microbiology, 88, 41–54.
- Székács, A., Adányi, N., Székács, I., Majer-Baranyi, K., & Szendrő, I. (2009). Optical waveguide light-mode spectroscopy immunosensors for environmental monitoring. Applied Optics, 48, B151–B158.
- Székács, A., Trummer, N., Adányi, N., Váradi, M., & Szendrő, I. (2003). Development of a non-labeled immunosensor for the herbicide trifluralin via OWLS detection. Analytical Chimica Acta, 487, 31–42.
- Tiefenthaler, K. (1992). Integrated optical couplers as chemical waveguide sensors. Advances in Biosensors, 2, 261–281.
- Trummer, N., Adányi, N., Váradi, M., & Szendrő, I. (2001). Modification of the surface of integrated optical wave-guide sensors for immunosensor applications. Fresenius'Journal of Analytical Chemistry, 371, 21–24.
- Tsai, Y. H., Kung, H. F., Lin, Q. L., Hwang, J. H., Cheng, S. H., Wei, C. I., & Hwang, D. F. (2005). Occurrence of histamine and histamine-forming bacteria in kimchi products in Taiwan. Food Chemistry, 90, 635–641.
- Veciana-Nogues, M. T., Hernandez-Jover, T., Marine-Font, A., & Vidal-Carou, M. C. (1995). Liquid chromatographic method for determination of biogenic amines in fish and fish products. Journal of the Association of Official Analytical Chemists, 78, 1045–1050.
- Vörös, J., Ramsden, J. J., Csúcs, G., Szendrõ, I., De Paul, S. M., Textor, M., Spencer, N. D. (2002). Optical grating coupler biosensors. Biomaterials, 23, 3699–3710.
- Zaman, M. Z., Abdulamir, A. S., Bakar, F. A., Selamat, J., & Bakar, J. (2009). A review: Microbiological, physicochemical and health impact of high level of biogenic amines in fish sauce. American Journal of Applied Sciences, 6, 1199–1211.