
ABSTRACT
An amikacin-sensitive monoclonal antibody (MAb) assay and immunochromatographic test strip were developed and applied for the detection of amikacin residues in bovine milk and chicken eggs. The immunoassay was specific to amikacin and showed no cross-reactivity with other aminoglycosides. The half maximum inhibitory concentration (IC50) of the assay was 0.65 ng/mL and the results were obtained within 90 min. Recoveries from spiked food matrices were within the range of 73.55–84.61% for bovine milk and 73.70–105.75% for whole egg. The strip test results were obtained within 10 min and showed a visual detection limit of 5.0 ng/mL for both food matrices. These results show that the MAb immunoassay and strip test developed in this study are very specific to amikacin and sufficiently sensitive for detection and routine monitoring of amikacin residues in food.
Introduction
Amikacin is a semi-synthetic aminoglycoside antibiotic synthesized by chemical modification of kanamycin A (Armstrong et al., Citation2012; Zawilla, Li, Hoogmartens, & Adams, Citation2007). Therefore, it belongs to the kanamycin subclass which includes kanamycin, tobramycin, and amikacin (). Similar to other aminoglycosides, amikacin disrupts bacterial protein synthesis by binding to the 30S ribosome of susceptible organisms. Binding interferes with mRNA binding and tRNA acceptor sites, leading to the production of non-functional or toxic peptides (Armstrong et al., Citation2012).
Figure 1. Chemical structural features that distinguish amikacin from other aminoglycosides.
Amikacin is used in both human and veterinary medicine and is able to overcome gram-negative bacterial infections that exhibit resistance to gentamicin, kanamycin, or tobramycin (). This is because the amikacin molecule has fewer points susceptible to enzymatic attack than most other aminoglycosides (Chen, Chen, He, Shang, & Zhang, Citation2012; Nicoli & Santi, Citation2006; Serrano & Silva, Citation2006; Yu, He, Fu, Xie, & Gan, Citation2009), and hence has a broader antibiotic spectrum.
Amikacin is commonly used in neonatal therapies and is indicated for therapeutic drug monitoring due to the toxicity risks inherent in its use (Losoya-Leal, Estevez, Martinez-Chapa, & Lechuga, Citation2015). When used in the treatment of cow mastitis, adequate withdrawal periods are required to avoid the occurrence of amikacin residues in the milk (Chen et al., Citation2012). This is important because amikacin has earlier been reported to have potential ototoxicity (Kitasato, Yokota, Inouye, & Igarashi, Citation2004; Zawilla et al., Citation2007) and nephrotoxicity (Luft et al., Citation1978; Serrano & Silva, Citation2006).
In addition to the human health implications of nephrotoxicity and ototoxicity, continuous consumption of foodstuffs containing amikacin residues can also lead to antibiotic resistance (Yu et al., Citation2009); hence, for the purposes of food safety, there is a need to monitor the drug residues in foods from exposed animals.
Previously, amikacin has been detected using analytical methods such as capillary electrophoresis (Oguri & Miki, Citation1996; Yu et al., Citation2009) and liquid chromatography (Chen et al., Citation2012; Nicoli & Santi, Citation2006; Ovalles, Brunetto, & Gallignani, Citation2005; Zawilla et al., Citation2007). However, these methods are costly, time-consuming, require sophisticated laboratory equipment and technically trained personnel (Chen, Kong, et al., Citation2016; Li et al., Citation2016; Lourenco, Barbosa, & Pinto, Citation2011; Xu et al., Citation2016; Xu et al., Citation2011). In addition, the amikacin molecule has no chromophores that can give a reliable signal in the UV region, lacks volatility and is very hydrophilic (Farouk, Azzazy, & Niessen, Citation2015). As a result, direct HPLC analysis by UV detection is further complicated since it requires derivatization of some functional groups in amikacin to give efficient absorption in the UV–visible wavelength range or efficient fluorescent properties (Farouk et al., Citation2015; Ovalles et al., Citation2005; Zawilla et al., Citation2007). Therefore, other than the chromatographic methods, there is a need for alternative analytical techniques for amikacin determination.
Enzyme-linked immunosorbent assay (ELISA) detection methods are semi-quantitative, simple, highly specific, sensitive, and cost effective, hence they are convenient for routine monitoring and screening of drug residues in food samples (Chen, Kong, et al., Citation2016; Liu, Yan, Zhang, Kuang, & Xu, Citation2015; Tian, Chen, Guo, Guo, & Mei, Citation2015). Previously, commercially available polyclonal antibodies were used to develop a surface plasmon resonance immunoassay for therapeutic drug monitoring of amikacin (Losoya-Leal et al., Citation2015) and a fluorescence polarization immunoassay for detection of amikacin (Sanchez-Martinez, Aguilar-Caballos, & Gomez-Hens, Citation2007), but neither studies provided detailed information on antibody preparation and cross-reactivity analysis. Another group reported the production of a high-affinity polyclonal antibody (IC50, 1.3 ng/mL) against amikacin that was used to develop a sensitive ELISA for amikacin in milk (Chen et al., Citation2012).
The current study describes the development of a monoclonal antibody assay for the detection of amikacin antibiotic residues in milk and eggs. This detection can also be made simpler, faster, and more convenient by using a single-step immunochromatographic strip test where results are obtained within 5–10 min, and all necessary reagents are included in the strip without the need for any sophisticated costly equipment (Kong et al., Citation2016; Sun, Liu, Song, Kuang, & Xu, Citation2016). Therefore, the aim of the current study was to develop a monoclonal antibody assay and an immunochromatographic test strip for the detection of amikacin residues in milk and eggs.
Materials and methods
Chemicals and reagents
Amikacin, kanamycin, tobramycin, gentamicin, apramycin, paromomycin, lincomycin, neomycin, spectinomycin, and streptomycin were obtained from Aladdin Industrial Corporation (Shanghai, China). Complete Freund’s adjuvant (FCA), incomplete Freund’s adjuvant (FIA), and enzyme immunoassay-grade horseradish peroxidase (HRP)-labeled goat anti-mouse immunoglobulin were acquired from Sigma (St. Louis, MO, USA). Gelatin was purchased from Beijing Biodee Biotechnology Co., Ltd. (Beijing, China). Tetramethylbenzidine (TMB) and HRP were supplied by Aladdin Chemistry Co., Ltd. All cell fusion reagents were acquired from Sunshine Biotechnology Co., Ltd. (Nanjing, China). Bovine serum albumin (BSA) and ovalbumin (OVA) were obtained from Solarbio Science & Technology, Co. Ltd. (Beijing, China). Other reagents and chemicals were purchased from the National Pharmaceutical Group Chemical Reagent Co., Ltd. (Shanghai, China). Dialysis tubes (nominal pore size: 10 nm) and 96-well microtiter plates were acquired from Green Bird Biotechnology Development Company Ltd. (Shanghai, China) and Wuxi Biotechnology Company (Wuxi, China), respectively. Eight-week-old female Balb/C mice were obtained from Nanjing Biotechnology Company (Nanjing, China). Nitrocellulose (NC) high-flow plus membranes (Pura-bind RP) were purchased from Whatman-Xinhua Filter Paper Co., Ltd. (Hanzhou, China). Glass fiber membrane (CB-SB08) used for the sample pad, polyvinylchloride (PVC), and absorbance pad (SX18) were supplied by Gold Biotech Co., Ltd. (Shanghai, China).
Solutions and buffers
Coating buffer (pH 9.6) consisted of 1.59 g Na2CO3 and 2.93 g NaHCO3 in one liter of water. The ELISA substrate solution was prepared by mixing 2 mL of 0.06% (w/v) TMB in polyethylene glycol with 10 mL of 0.1 M citrate phosphate buffer (pH 5.0) containing 1.8 μL of 30% hydrogen peroxide. ELISA stop solution consisted of 2 M sulfuric acid. All other buffers: blocking buffer (0.2% w/v gelatin in coating buffer), washing buffer (phosphate buffered saline [PBS] containing 0.05% v/v Tween 20, PBST), and antibody dilution buffer (PBS containing 0.1% w/v gelatin and 0.05% v/v Tween 20) were prepared with 0.01 M PBS, pH 7.5.
Synthesis of immunogens and coating antigens
The glutaraldehyde (GDA) and carbodiimide (EDC) coupling methods reported in previous studies (Isanga, Tochi, et al., Citation2017; Xu et al., Citation2014; Xu et al., Citation2011) were used to prepare the immunogens and coating antigens, as described briefly below.
GDA coupling method
Different amounts of amikacin (AMK: 28.0 and 35.0 mg) corresponding to different ratios of AMK:BSA (120:1 and 150:1) were dissolved in 4 mL of 0.01 M PBS followed by the drop-wise addition of 200 µL of freshly prepared 1% GDA under constant stirring for 15 min. Next, 20 mg of BSA dissolved in 2 mL of 0.01 M PBS was added to the AMK-GDA mixtures and allowed to equilibrate under constant stirring for 1 h at 4°C. Sodium borohydride was then added to a final concentration of 2 mg/mL, and the solutions were incubated at 4°C for 2 h. The mixtures were subsequently dialyzed against 0.01 M PBS for 3 days at room temperature with frequent changes of the PBS solution every 4–5 h to remove uncoupled haptens. Polyacrylamide gel electrophoresis was used to confirm the success of conjugation. The conjugates (AMK-GDA-BSA) were stored at −20°C. The same procedure was followed to prepare the AMK-GDA-OVA coating conjugates.
EDC coupling method
A solution of 20 mg of BSA in 2 mL of 0.1 M 2-(N-morpholino) ethanesulfonic acid (MES; pH 4.7) was activated with 4 mg of EDC and an equimolar amount of N-hydroxysuccinimide (NHS; 2.4 mg) dissolved in 2 mL of 0.05 M KH2PO4, pH 8.6. The mixture was incubated under constant stirring for 2 h at room temperature. The activated protein solution was then slowly added to different amounts of AMK (28.0 and 35.0 mg) corresponding to different AMK:BSA ratios (120:1 and 150:1) dissolved in 2 mL of 0.05 M KH2PO4, pH 8.6. The mixture was allowed to equilibrate under constant stirring for 3 h at room temperature. The conjugates were dialyzed against 0.01 M PBS for 3 days with frequent changes of the PBS solution every 4–5 h to remove uncoupled haptens. Polyacrylamide gel electrophoresis was used to confirm the success of conjugation. The conjugates (AMK-EDC-BSA) were stored at −20°C. The same procedure was followed to prepare AMK-EDC-OVA coating conjugates.
Immunization of mice
The synthesized immunogens (AMK-GDA-BSA and AMK-EDC-BSA) were diluted to a concentration of 2 mg/mL using sterile 0.9% (w/v) sodium chloride (NaCl) followed by thorough mixing with an equivalent volume of Freund’s adjuvant before being administered subcutaneously to female BALB/c mice (6–8 weeks of age) at multiple sites on the back. The first dose consisted of 100 µL of the diluted immunogens emulsified with Freund’s complete adjuvant. Three subsequent booster injections of 50 µL immunogen each emulsified with Freund’s incomplete adjuvant were administered at 21-day intervals. Seven days following the third boost, mice were tail-bled. Blood samples (antisera) were screened for anti-amikacin activity by indirect competitive ELISA (idcELISA). The mouse with the highest anti-amikacin activity was administered a fifth injection intraperitoneally and 4 days later, the mouse was dissected and its spleen was removed for hybridoma production.
Hybridoma production, screening, and purification of MAb
The mouse spleen was ground to yield spleen lymphocytes which were fused with myeloma cells using polyethylene glycol (PEG) 1500 to produce hybridoma cells. The hybridoma cells were distributed into 96-well plates, fed with HAT medium containing 20% bovine fetal serum, and incubated for 7 days at 37°C in 5% CO2. Successfully fused cells (hybridomas) were identified by screening with the aid of idcELISA and further analyzed for sensitivity to amikacin in an immunoassay. Hybridomas showing high optical density (OD450 nm) and significant amikacin sensitivity in the assay were selected and sub-cloned four times at intervals of 6–7 days. Each of the five selected hybridoma cell lines was injected intraperitoneally into at least two mature female BALB/c mice (primed with paraffin oil) to produce ascites fluid. The ascites fluid was harvested 7–14 days after injection, then purified using the caprylic acid–ammonium sulfate precipitation method (Kuang et al., Citation2013) and dialyzed against PBS for 3 days before storage at −20°C.
ELISA development
In this study, an idcELISA was used together with AMK-EDC-OVA as the selected coating antigen. The checkerboard method was used to optimize the concentration of the coating antigen and antiserum or MAb. Microtiter plates were coated with 100 μL/well AMK-EDC-OVA and incubated overnight at 4°C. The plates were then washed three times with PBST and blocked with blocking buffer (200 μL/well). After incubation at 37°C for 2 h, the plates were washed twice, and 50 μL of standard solution was added to each well. Then, 50 μL of either diluted antiserum or MAb solution was added to each well, and the plates were incubated for 30 min at 37°C. After washing the plates three times, a secondary antibody (HRP-labeled goat anti-mouse IgG) diluted 1:3000 with antibody dilution buffer was added (100 μL/well). The microtiter plates were incubated for 30 min and washed four times. Freshly prepared TMB substrate solution was added to the plates (100 μL/well) and allowed to react in the dark for 15 min at 37°C. Sulfuric acid (2 M) was used to stop the chromogenic reaction (50 μL/well). The optical density was measured at 450 nm (OD450) with a microplate reader. Competition curves were constructed by plotting OD450 against the logarithm of the analyte concentration. The software package OriginPro 8.5 (OriginLab Corporation, Northampton, MA, USA) was used to calculate the four-parameter sigmoidal curve equation:where A is the maximum absorbance in the absence of analyte, B is the curve slope at the inflection point, C is the concentration of the analyte resulting in 50% inhibition (IC50), and D is the minimum absorbance at infinite concentration. The IC50 value was used to evaluate the sensitivity of the ELISA.
Immunoassay optimization
The effects of pH value and salt concentration of the assay buffer (0.01 M PBS) were investigated. A pH range of 5.0–9.0 and concentration of sodium chloride in the range of 0%–3.2% (w/v) were evaluated to optimize immunoassay performance.
Determination of cross-reactivity
The optimized assay conditions were used in idcELISA from which a standard AMK calibration curve (0.0–24.3 ng/mL) was generated. The limit of detection (LOD) was determined from the AMK concentration that resulted in 50% inhibition. Several aminoglycosides including amikacin, kanamycin, gentamicin, paromomycin, lincomycin, neomycin, spectinomycin, streptomycin, and tobramycin were analyzed for cross-reactivity (CR) using idcELISA. CR values were calculated by the following equation,
Immunoassay analysis of spiked milk and egg samples
Bovine milk and whole eggs were purchased from a local supermarket and confirmed to be residue-free by HPLC–MS/MS. Samples of the two food matrices were spiked with three different concentrations of AMK dissolved in 0.01 M PBS, pH 7.5. The spiking and extraction process of the food samples were performed as detailed below.
Bovine milk
Amikacin sulfate (10,000 ng/mL in 0.01 M PBS, pH 7.5) was added to milk samples resulting in final concentrations of 200, 400, and 800 ng/mL in a total volume of 1 mL. The spiked milk samples were thoroughly mixed and placed on a shaker at room temperature for 30 min followed by a 200-fold dilution with 0.01 M PBS, pH 7.5. Aliquots (50 µL) of the diluted milk samples were transferred to microtiter plates for analysis. Recovery was calculated on the basis of the standard curve generated by idcELISA.
Whole egg
Egg white and yolk were thoroughly mixed in a blender and stored at −20°C. Amikacin sulfate (10,000 ng/mL in 0.01 M PBS, pH 7.5) was added to the egg samples resulting in final concentrations of 400, 800, and 1600 ng/mL in a total volume of 1 mL. The spiked egg samples were thoroughly mixed on a vortex machine for 20 s and placed on a shaker at room temperature for 30 min before being diluted 400-fold with 0.01 M PBS, pH 7.5. Aliquots (50 µL) of the diluted samples were transferred to a microtiter plate for analysis. Recovery was calculated based on the standard curve generated by idcELISA.
Recovery assessment
Inter-assay variability was determined from triplicate spiked food samples analyzed three times on four different days. Intra-assay variability was determined from triplicate spiked food samples repeated six times on a single day. Recovery data and precision were expressed as the coefficient of variation (CV) calculated using the following formula,
Immunochromatographic test strip preparation and procedure
Preparation of colloidal gold particles
An immunochromatographic strip was developed based on a method reported in previous studies (Isanga, Tochi, et al., Citation2017; Luo et al., Citation2014). Double-distilled water was used to prepare all solvents which were afterwards filtered using a 0.22-µm membrane. Chloroauric acid solution (0.1 M, 50 mL) was heated to boiling under constant stirring at 100×g and mixed with 2 mL of 1% w/v trisodium citrate solution for 6 min. Upon turning wine-red, the solution was allowed to cool at room temperature and stored at 4°C. When observed through a transmission electron microscope, the gold nanoparticles had a nearly uniform particle size of 30 nm. The UV–visible spectrum characterized the maximum absorbance peak at 530 nm.
Preparation of colloidal gold-labeled antibodies
Colloidal gold solution for conjugation (10 mL) was adjusted to pH 7.0 with 0.1 M K2CO3. MAb (1 mL) was added to the solution drop-wise, and after 50 min, 1 mL of 0.5% (w/v) casein was added and mixed for 2 h. The products were centrifuged at 7000×g for 50 min to remove the gold aggregates. The red supernatant was further centrifuged at 7000×g for 50 min. The resulting lower phase (red gold-labeled MAb) was washed with 0.02 M phosphate buffer (containing 5% sucrose, 1% BSA and 0.5% PEG 6000, pH 7.4) and purged three times to remove unlabeled MAb. The conjugation products were reconstituted to 1 mL with 0.02 M phosphate buffer containing 0.02% sodium nitrite (NaN3) and stored at 4°C.
Screening and selection of coating antigen for strip tests
Four different coating antigens (AMK-GDA-BSA/180:1, AMK-GDA-BSA/120:1, AMK-EDC-BSA/180:1, and AMK-EDC-BSA/120:1), each at a concentration of 5 mg/mL, were tested to identify which one was best for use in construction of the test strip. Gold nanoparticles (1 mL) were diluted with 4 µL of K2CO3 and mixed with 30 µg/mL antibody 1F11. For the preparation of the zero standard, 7 μL of gold nanoparticles was mixed with 43 μL PBS + Tween 20, and an aliquot of 50 μL was mixed with 100 μL of food sample.
Optimization of PBS salt concentration for strip tests
Salt concentrations of 0.0%, 0.1%, 0.3%, 0.4%, and 0.8% (w/v) were tested to select the most suitable concentration for use in the strip test.
Preparation of nitrocellulose capture membranes
The coating antigen (AMK-EDC-BSA/120:1) and goat anti-mouse IgG were used as the capture reagents in the control line. The coating antigen with MAb or goat anti-mouse IgG coating was sprayed onto the nitrocellulose membrane at 1 μL/cm to generate the test line and control line on the strip. The membrane was dried at 37°C for 30 min and stored at room temperature. The capture reagent was sprayed onto a glass fiber membrane to prepare the conjugate pad, which was dried at 37°C for 2 h. The nitrocellulose membrane coated with capture reagents was then pasted at the center of the polyvinylchloride (PVC) plastic backing plate, and the conjugate pad (glass fiber), sample pad, and absorbent pad were attached to the back plate. Finally, the plate was cut into 3-mm-wide strips using a strip cutter.
Strip test detection of amikacin in 0.01 m PBS and spiked food samples
The capture test line was constructed by mixing 1 mL of gold nanoparticles with 4 μL of potassium carbonate (K2CO3) and 30 μg/mL of antibody 1F11. The coating concentration used was 5 mg/mL. For the preparation of the zero standard, 7 μL of gold nanoparticles were mixed with 43 μL of PBS + Tween 20, and an aliquot of 50 μL was mixed with 100 μL of either PBS or spiked food sample.
Results and discussion
Synthesis of immunogens and coating antigens
Amikacin is a small molecule lacking immunogenicity so in order to make it immunogenic, it needs to be conjugated to a larger carrier protein or carbohydrate (Chen, Liu, Song, Kuang, & Xu, Citation2016; Isanga, Tochi, et al., Citation2017; Xu et al., Citation2014). This conjugation can be made possible via one of the four amino or eight hydroxyl functional groups (Isanga, Mukunzi, et al., Citation2017) present in the amikacin chemical structure as shown in (a).
Figure 2. (a) Amikacin chemical structure showing its four amino groups and eight hydroxyl groups that can be used to link the amikacin molecule to a protein carrier. (b) Polyacrylamide gel electrophoresis image of AMK-BSA conjugates; 1 = BSA standard, 2 = AMK-GDA-BSA/120:1, 3 = AMK-GDA-BSA/150:10:1, 4 = AMK-EDC-BSA/120:1, 5 = AMK-EDC-BSA/150:1.
In this study, AMK was conjugated to BSA (immunogen synthesis) or OVA (coating antigen synthesis) using both the GDA and EDC coupling methods in each case. Theoretically, these two methods facilitate the linkage of any one of the amino groups in the amikacin chemical structure to one of the carboxyl groups in the carrier protein (Xu et al., Citation2014).
The success of conjugation was confirmed using polyacrylamide gel electrophoresis as shown in (b). Migration band 1 of the BSA standard moved slightly ahead of the other migration bands (2, 3, 4, and 5) corresponding to the four tested conjugates ((b)). The relatively slower movement exhibited by migration bands 2, 3, 4, and 5 during electrophoresis can be attributed to the relatively higher molecular weight (Xu et al., Citation2016) of the AMK-BSA conjugates compared to that of the BSA standard, which is not conjugated and hence lighter and faster. Therefore, conjugation was successful at all the four ratios tested.
Mouse serum testing
The titer and inhibition level of the antiserum were tested using both homologous and heterologous coating antigens. Mice immunized with the immunogens AMK-GDA-BSA and AMK-EDC-BSA all showed comparatively good results during checkerboard titration experiments with the serum (results not shown). However, the best mouse from the group immunized with AMK-GDA-BSA was selected for cell fusion based on good optical density and inhibition ≥50% at the standard concentration of 2 ng/mL when tested on AMK-EDC-OVA coating antigen.
Antibody production
Hybridoma screening (results not shown) followed by four cycles of subcloning using idcELISA was used to identify the culture supernatants containing cell lines with high sensitivity to amikacin in immunoassay, of which the best five were selected and used for intraperitoneal injection into fresh mice. Ascites fluid collected from the injected mice was purified giving rise to five monoclonal antibodies, of which 1F11 was found to be the most sensitive, with an IC50 of 0.68 ng/mL. Therefore, MAb 1F11 was chosen for further studies.
Immunoassay optimization
IC50 and maximum optical density (Amax) at 450 nm were the two major parameters upon which the immunoassay performance of the antibody was evaluated. Preliminary checkerboard titration experiments (results not shown) were used to determine the optimum concentrations of coating antigen (AMK-EDC-OVA) and 1F11 antibody, which were 0.3 and 0.5 μg/mL, respectively. The other optimized factors were pH and salt concentration, since they significantly affect antibody performance in immunoassay; yet, they vary in different food matrices (Isanga, Tochi, et al., Citation2017; Tochi et al., Citation2016). Variation of pH also affects the isoelectric point of the antibody, as with any other protein, hence making it an indispensable factor in assay performance (Yu, Liu, Song, Kuang, & Xu, Citation2016).
The Amax values generally increased with increasing pH in the range 5–7.5, after which they started to decrease over the pH range 8–9 ((a)). However, the Amax values remained within the preferred range of 1.5–2.0. A similar observation was reported in earlier studies (Chen et al., Citation2012; Chen, Shang, Li, Wu, & Xiao, Citation2008). On the other hand, IC50 values decreased with increasing pH over the range 5–7.5, beyond which they started to increase up to pH 9 ((a)). This observation is consistent with the findings of some previous studies (Chen et al., Citation2012) and our recent studies (Isanga, Mukunzi, et al., Citation2017). Consequently, a pH of 7.5, having had the lowest IC50 of 0.65 ng/mL, with a relatively high Amax value of 1.78 was selected as optimal and used for subsequent experiments.
Figure 3. Effect of (a) pH variation and (b) salt concentration on Amax and IC50 Values. (c) Amikacin standard curve under optimized conditions. n = 7.
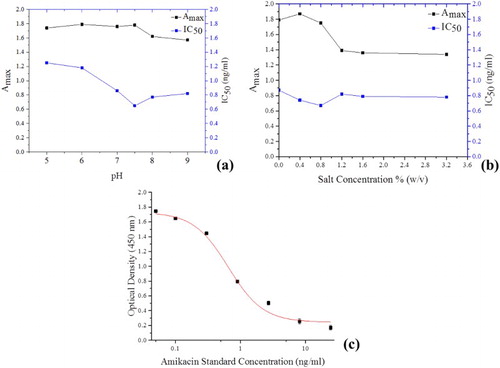
As shown in (b), the Amax values generally decreased with increasing salt concentration over the tested range of 0.0–3.2% (w/v). In the lower salt concentrations of 0.0–0.8% (w/v), the Amax remained within the preferred range of 1.5–2.0, with the highest Amax of 1.86 recorded at a salt concentration of 0.4% (w/v). However, at higher salt concentrations in the range of 1.2–3.2% (w/v), the Amax significantly decreased to values below the preferred range of 1.5–2.0, hence high salt concentrations negatively impacted the immunoassay performance of the antibody. This impact of salt concentration on Amax was also observed in some previous studies (Chen et al., Citation2012; Chen et al., Citation2008).
The variation in salt concentration also had a significant effect on the IC50. Within the salt concentration range of 0.0–0.8% (w/v), the IC50 generally decreased with increasing salt concentration ((b)), beyond which it increased and remained relatively constant in the salt concentration range of 1.2–3.2% (w/v). Therefore, on account of having the lowest IC50 of 0.67 ng/mL and relatively high Amax of 1.75, the salt concentration of 0.8% (w/v) was chosen as optimum for the antibody performance in immunoassay.
Using the optimized assay conditions in idcELISA, a standard calibration curve for amikacin was generated after fitting with the aid of Origin Pro 8.5 software ( c). The IC50 was 0.65 ng/mL, with a LOD of 0.28 ng/mL.
Determination of cross-reactivity
Under the optimized assay conditions, the MAb was tested for cross-reactivity, where it detected amikacin (100%), but showed no sensitivity to the other nine aminoglycosides tested (). This observation is partly consistent with earlier studies (Chen et al., Citation2012), where the AMK polyclonal antibody was found to have negligible cross-reactivity with other aminoglycosides including neomycin, gentamicin, apramycin, spectinomycin, and streptomycin.
Table 1. Cross-reactivity of amikacin MAb with other aminoglycosides.
The fact that amikacin is synthesized by acylation of the amino group in position 1 of the hexose nucleus of kanamycin A (Zawilla et al., Citation2007) theoretically implies that its MAb would be expected to show some level of cross-reactivity with kanamycin and tobramycin since they share closer chemical structural similarity and also have a 4,6-disubstituted hexose nucleus as shown in . However, the AMK MAb was specific and showed no cross-reactivity with kanamycin or tobramycin, as was the case with other aminoglycoside analogs tested. This could be attributed to the 2-hydroxy-4-aminobutyric acid substituent (HABA) attached to the first amino group of the hexose nucleus of amikacin, which is absent in kanamycin and tobramycin as illustrated in .
Immunoassay analysis of spiked milk and egg samples
Bovine milk and whole egg samples were spiked at three different concentrations and their average intra- and inter-assay recoveries determined as shown in . The intra-assay recoveries ranged from 78.12% to 84.61% for bovine milk and from 85.37% to 105.75% for whole egg (). Inter-assay recoveries for bovine milk ranged from 73.55% to 84.10%, while those of whole egg ranged from 73.70% to 88.96% (). The intra-assay coefficients of variation in the two matrices ranged from 3.17% to 12.56%, while the inter-assay coefficients of variation ranged from 4.36% to 14.42% (), demonstrating the assay stability. The relatively high recoveries and low coefficients of variation observed in this study illustrate the suitability of the extraction procedure used and the adequacy of the corresponding dilution ratios in minimizing matrix interference with assay performance.
Table 2. Amikacin recovery from spiked milk and egg samples.
Immunochromatographic test strip procedure and principle
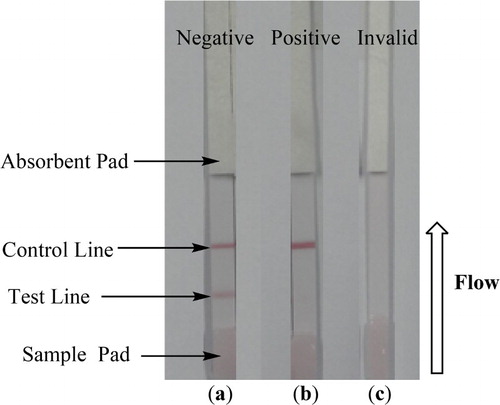
The strip test procedure and principle used in this study are a slight modification of that reported in earlier studies (Isanga, Tochi, et al., Citation2017; Luo et al., Citation2014). Briefly, 50 μL of the sample was added to the conjugate layer containing colloidal gold-labeled antibodies. Due to capillary action, the solution moved in the direction of the absorbent pad (). Since the test line was already embedded with the AMK-EDC-BSA coating antigen, the presence of amikacin in the sample led to competition for the finite amount of anti-amikacin MAb. Therefore, the higher the concentration of amikacin in the sample, the weaker the color of the test line in terms of visual appearance. In the absence of amikacin in the sample, the limited amount of colloidal gold-labeled MAb was trapped by the immobilized coating antigen (AMK-EDC-BSA), which in turn created a clear visible red test line as shown in (a). When a sufficient amount of amikacin was present, the free amikacin bound to all the labeled MAb, preventing any binding to the coating antigen (AMK-EDC-BSA) on the test line as shown in (b). To ensure that the strip works well, the flow must reach the control line that is impregnated with anti-mouse IgG. When only the control line appears, the result is positive ((b)) while the appearance of both control line and test line indicates a negative result ((a)). The test is invalid either when only the test line appears without the control line or if both test line and control lines do not appear as shown in (c).
Figure 4. Illustration of typical strip test results. (a) When both the control and test line appear, the test is negative. (b) The test is positive if only the control line appears but without the test line. (c) The test is invalid either; when only the test line appears without the control line or if both test line and control lines do not appear.
Selection of strip coating antigen
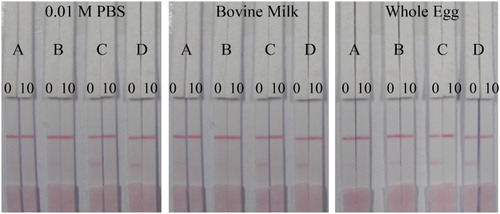
Four coating antigens (A = AMK-GDA-BSA/180:1, B = AMK-GDA-BSA/120, C = AMK-EDC-BSA/180:1, and D = AMK-EDC-BSA/120:1) were tested as shown in . The coating antigens A and B (AMK-GDA-BSA) showed low color intensities at the strip test lines in PBS, milk and egg matrices (). However, coating antigens C and D (AMK-EDC-BSA) showed higher and more distinct color intensities at their respective test lines in all the matrices () and the results were obtained within 10 min. Therefore, coating antigen D (AMK-EDC-BSA/120:1) was selected for further experiments since it gave the best color intensity compared to all the other coating antigens tested.
Figure 5. Screening and selection of coating antigens for use in strip construction. A = AMK-GDA-BSA/180:1, B = AMK-GDA-BSA/120, C = AMK-EDC-BSA/180:1, D = AMK-EDC-BSA/120:1. Amikacin concentrations of 0 and 10 ng/mL were used for the negative and positive tests respectively. The coating antigen and antibody concentrations were fixed at 5 and 30 mg/mL respectively.
Optimization of PBS salt concentration for strip tests
Although the PBS salt concentration of 0.8% (w/v) was originally selected as the optimum for use in immunoassay experiments ((b)), preliminary strip tests (results not shown) indicated low color intensity at the test line when this salt concentration was used. This observation reinforced our earlier findings ((b)) and subsequent conclusion that MAb 1F11 was sensitive to salt concentration, since its performance in immunoassay was significantly inhibited at high salt concentrations as shown in (b). Therefore, further optimization was carried out to determine the most suitable salt concentration for use in the strip tests.
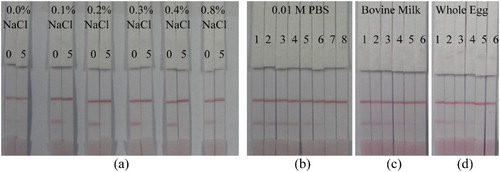
As shown in (a), salt concentrations in the range of 0.0–0.8% (w/v) were tested. In the absence of salt (0.0% w/v), there was negligible color development at the test line. However, salt concentrations of 0.1–0.4% (w/v) showed good color development at the test line ((a)). Although 0.8% (w/v) salt concentration showed some color development, the intensity was low. Therefore, the salt concentration of 0.4% (w/v) was selected for further strip tests.
Figure 6. (a) Optimization of PBS salt concentration for strip tests. Amikacin concentrations of 0 and 5 ng/mL were used for the negative and positive tests respectively. (b) Test strip detection of different amikacin concentrations in 0.01 M PBS. 1 = 0, 2 = 0.1, 3 = 0.25, 4= 0.5, 5 = 1.0, 6 = 2.5, 7 = 5.0, and 8 = 10 ng/mL. (c) Strip detection of amikacin in bovine milk samples and (d) in whole egg samples. 1 = 0, 2 = 0.25, 3 = 0.5, 4 = 1.0, 5 = 2.5, and 6 = 5.0 ng/mL.
Strip detection of amikacin in 0.01 m PBS and spiked food samples
Different amikacin concentrations of 0, 0.1, 0.25, 0.5, 1.0, 2.5, 5, and 10 ng/mL were prepared in 0.01 M PBS, then analyzed using the strip test. The visual LOD was 5.0 ng/mL, as shown in (b), and the results were obtained within 10 min.
Milk and egg samples spiked with different amikacin concentrations of 0, 0.25, 0.5, 1, 2.5, and 5.0 ng/mL were analyzed using the strip test as shown in (c) and (d). The visual LOD in both matrices was 5.0 ng/mL and the results were obtained in 10 min. Maximum residual limits (MRLs) for amikacin in food matrices are not yet established despite reports that amikacin is indicated for therapeutic drug monitoring due to its toxicity (Losoya-Leal et al., Citation2015) and sufficient withdrawal periods are required to avoid the occurrence of amikacin residues in milk when it is used in the treatment of cow mastitis (Chen et al., Citation2012). However, the detection limit of 5.0 ng/mL observed in this study is far below most aminoglycoside MRLs recommended by the European Union (EU, Citation2010). Therefore, our strip detection limit of 5.0 ng/mL is sufficient to facilitate the screening and monitoring of amikacin residues in food matrices.
Conclusion
The developed immunoassay was specifically sensitive to amikacin and showed no cross-reactivity with the other nine aminoglycosides tested. After optimization of assay conditions, the MAb had an IC50 of 0.65 ng/mL, with an LOD of 0.28 ng/mL, and the results were obtained within 90 min. The average recoveries and coefficients of variation from the spiked food samples were within reasonable ranges of 73.55–105.75% and 3.17–14.42%, respectively. Strip test results from spiked milk and egg samples were obtained in 10 min with visual detection limits of 5.0 ng/mL for both matrices. Therefore, the developed immunoassay and immunochromatographic strip test are very specific to amikacin and are sufficiently sensitive for detection and routine monitoring of amikacin residues in milk and eggs.
Disclosure statement
No potential conflict of interest was reported by the authors.
Notes on contributors
Joel Isanga is a Ugandan citizen and started PhD studies in 2013 at Jiangnan University in the School of Food Science and Technology. His research interests are monoclonal antibody development and applications.
Daniel Mukunzi was born in Rwanda and started PhD studies in 2012 at Jiangnan University in the School of Food Science and Technology. His research interests are immunoassay development for agonists.
Yanni Chen obtained her bachelor’s degree from Liaoning Medical University, Jinzhou, China, in 2012 and then started postgraduate studies in Jiangnan University (Wuxi, China) as a PhD student in the School of Food Science. Her research interests are immunoassay applications in food.
Steven Suryoprabowo is an Indonesian citizen and obtained his bachelor’s degree from Pelita Harapan University (Indonesia) and his master’s degree in Food Science (2014) from Jiangnan University, Wuxi, China. His research interests are monoclonal antibodies development and immunochromatographic strip test and applications.
Liqiang Liu obtained his PhD in Food Science in 2014 from Jiangnan University, Wuxi, China and then became a faculty in the School of Food Science and Technology of Jiangnan University. His research interests are immunochromatographic strip design and application.
Hua Kuang obtained her PhD from China Agricultural University in 2009 and then began to work as a faculty in the School of Food Science and Technology of Jiangnan University. She is currently a Professor in Food Safety. Her research interests are biosensor development.
Additional information
Funding
References
- Armstrong, E. S., Kostrub, C. F., Cass, R. T., Moser, H. E., Serio, A. W., & Miller, G. H. (2012). Aminoglycosides. In T. J. Dougherty & M. J. Pucci (Eds.), Antibiotic discovery and development (pp. 229–269). New York, NY: Springer Science Media, LLC.
- Chen, Y., Chen, Q., He, L., Shang, B., & Zhang, L. (2012). Enzyme immunoassay and liquid chromatography-fluorescence detection for amikacin in raw milk. Food Chemistry, 135(2), 380–385. doi: 10.1016/j.foodchem.2012.05.001
- Chen, Y. N., Kong, D. Z., Liu, L. Q., Song, S. S., Kuang, H., & Xu, C. L. (2016). Development of an ELISA and immunochromatographic assay for tetracycline, oxytetracycline, and chlortetracycline residues in milk and honey based on the class-specific monoclonal antibody. Food Analytical Methods, 9(4), 905–914. doi: 10.1007/s12161-015-0262-z
- Chen, Y. N., Liu, L. Q., Song, S. S., Kuang, H., & Xu, C. L. (2016). Establishment of a monoclonal antibody-based indirect enzyme-linked immunosorbent assay for the detection of trimethoprim residues in milk, honey, and fish samples. Food and Agricultural Immunology, 27(6), 830–840. doi: 10.1080/09540105.2016.1183599
- Chen, Y. Q., Shang, Y. H., Li, X. M., Wu, X. P., & Xiao, X. L. (2008). Development of an enzyme-linked immunoassay for the detection of gentamicin in swine tissues. Food Chemistry, 108(1), 304–309. doi: 10.1016/j.foodchem.2007.10.022
- EU. (2010). Commission regulation on pharmacologically active substances and their classification regarding maximum residue limits in foodstuffs of animal origin (Vol. 37/2010, pp. 1– 72). United Kingdom: Official Journal of the European Union.
- Farouk, F., Azzazy, H. M. E., & Niessen, W. M. A. (2015). Challenges in the determination of aminoglycoside antibiotics, a review. Analytica Chimica Acta, 890, 21–43. doi: 10.1016/j.aca.2015.06.038
- Isanga, J., Mukunzi, D., Chen, Y., Suryoprabowo, S., Liu, L., Kuang, H., & Xu, C. (2017). Development of a monoclonal antibody assay and a lateral flow strip test for the detection of paromomycin residues in food matrices. Food and Agricultural Immunology, 1–19. doi:10.1080/09540105.2016.1272551 doi: 10.1080/09540105.2017.1309361
- Isanga, J., Tochi, B. N., Mukunzi, D., Chen, Y., Liu, L., Kuang, H., & Xu, C. (2017). Development of a specific monoclonal antibody assay and a rapid testing strip for the detection of apramycin residues in food samples. Food and Agricultural Immunology, 28(1), 49–66. doi: 10.1080/09540105.2016.1202211
- Kitasato, I., Yokota, M., Inouye, S., & Igarashi, M. (2004). Comparative ototoxicity of ribostamycin, dactimicin, dibekacin, kanamycin, amikacin, tobramycin, gentamicin, sisomicin and netilmicin in the inner ear of Guinea pigs. Chemotherapy, 36(2), 155–168. doi: 10.1159/000238762
- Kong, D., Liu, L., Song, S., Suryoprabowo, S., Li, A., Kuang, H., … Xu, C. (2016). A gold nanoparticle-based semi-quantitative and quantitative ultrasensitive paper sensor for the detection of twenty mycotoxins. Nanoscale, 8(9), 5245–5253. doi: 10.1039/C5NR09171C
- Kuang, H., Xing, C., Hao, C., Liu, L., Wang, L., & Xu, C. (2013). Rapid and highly sensitive 15 detection of lead ions in drinking water based on a strip immunosensor. Sensors, 13(16), 4214–4224. doi: 10.3390/s130404214
- Li, A., Tang, L., Song, D., Song, S., Ma, W., Xu, L., … Xu, C. (2016). A SERS-active sensor based on heterogeneous gold nanostar core-silver nanoparticle satellite assemblies for ultrasensitive detection of aflatoxinB1. Nanoscale, 8(4), 1873–1878. doi: 10.1039/C5NR08372A
- Liu, L. Q., Yan, H. J., Zhang, X., Kuang, H., & Xu, C. L. (2015). Development of an anti-chlorothalonil monoclonal antibody based on a novel designed hapten. Food and Agricultural Immunology, 26(3), 410–419. doi: 10.1080/09540105.2014.938319
- Losoya-Leal, A., Estevez, M. C., Martinez-Chapa, S. O., & Lechuga, L. M. (2015). Design of a surface plasmon resonance immunoassay for therapeutic drug monitoring of amikacin. Talanta, 141, 253–258. doi: 10.1016/j.talanta.2015.04.009
- Lourenco, F. R., Barbosa, E. A., & Pinto, T. J. A. (2011). Microbiological assay for apramycin soluble powder. Latin American Journal of Pharmacy, 30(3), 554–557.
- Luft, F. C., Bloch, R., Sloan, R. S., Yum, M. N., Costello, R., & Maxwell, D. R. (1978). Comparative nephrotoxicity of aminoglycoside antibiotics in rats. Journal of Infectious Diseases, 138(4), 541–545. doi: 10.1093/infdis/138.4.541
- Luo, L., Suryoprabowo, S., Liu, L., Peng, J., Kuang, H., & Xu, C. (2014). Development of an immunochromatographic strip test for rapid detection of ciprofloxacin in milk samples. Sensors, 14, 16785–16798. doi: 10.3390/s140916785
- Nicoli, S., & Santi, P. (2006). Assay of amikacin in the skin by high-performance liquid chromatography. Journal of Pharmaceutical Biomedical Analysis, 41(3), 994–997. doi: 10.1016/j.jpba.2005.12.029
- Oguri, S., & Miki, Y. (1996). Determination of amikacin in human plasma by high-performance capillary electrophoresis with fluorescence detection. Journal of Chromatography B-Biomedical Applications, 686(2), 205–210. doi: 10.1016/S0378-4347(96)00237-X
- Ovalles, J. F., Brunetto, M. D., & Gallignani, M. (2005). A new method for the analysis of amikacin using 6-aminoquinolyl-N-hydroxysuccinimidyl carbamate (AQC) derivatization and high-performance liquid chromatography with UV-detection. Journal of Pharmaceutical and Biomedical Analysis, 39(1-2), 294–298. doi: 10.1016/j.jpba.2005.02.030
- Sanchez-Martinez, M. L., Aguilar-Caballos, M. P., & Gomez-Hens, A. (2007). Long wave length fluorescence polarization immunoassay: Determination of amikacin on solid surface and gliadins in solution. Analytical Chemistry, 79(19), 7424–7430. doi: 10.1021/ac070761l
- Serrano, J. M., & Silva, M. (2006). Determination of amikacin in body fluid by high-performance liquid-chromatography with chemiluminescence detection. Journal of Chromatography B, 843(1), 20–24. doi: 10.1016/j.jchromb.2006.05.016
- Sun, C., Liu, L. Q., Song, S. S., Kuang, H., & Xu, C. L. (2016). Development of a highly sensitive ELISA and immunochromatographic strip to detect pentachlorophenol. Food and Agricultural Immunology, 27(5), 689–699. doi: 10.1080/09540105.2016.1148668
- Tian, Y. F., Chen, G. H., Guo, L. H., Guo, X., & Mei, X. Y. (2015). Methodology studies on detection of aminoglycoside residues. Food Analytical Methods, 8(7), 1842–1857. doi: 10.1007/s12161-014-0067-5
- Tochi, B. N., Khaemba, G., Isanga, J., Mukunzi, D., Liu, L. Q., Peng, J., … Xu, C. L. (2016). Monoclonal antibody for the development of specific immunoassays to detect enrofloxacin in foods of animal origin. Food and Agricultural Immunology, 27(4), 435–448. doi: 10.1080/09540105.2015.1089844
- Xu, F., Jiang, W., Zhou, J., Wen, K., Wang, Z., Jiang, H., & Ding, S. (2014). Production of monoclonal antibody and development of a new immunoassay for apramycin in food. Journal of Agricultural & Food Chemistry, 62(14), 3108–3113. doi: 10.1021/jf405379r
- Xu, L. G., Peng, S., Liu, L. Q., Song, S. S., Kuang, H., & Xu, C. L. (2016). Development of sensitive and fast immunoassays for amantadine detection. Food and Agricultural Immunology, 27(5), 678–688. doi: 10.1080/09540105.2016.1148667
- Xu, N. F., Qu, C. L., Ma, W., Xu, L. G., Liu, L. Q., Kuang, H., & Xu, C. L. (2011). Development and application of one-step ELISA for the detection of neomycin in milk. Food and Agricultural Immunology, 22(3), 259–269. doi: 10.1080/09540105.2011.569882
- Yu, C. Z., He, Y. Z., Fu, G. N., Xie, H. Y., & Gan, W. E. (2009). Determination of kanamycin A, amikacin and tobramycin residues in milk by capillary zone electrophoresis with post-column derivatization and laser-induced fluorescence detection. Journal of Chromatography B, 877(3), 333–338. doi: 10.1016/j.jchromb.2008.12.011
- Yu, L., Liu, L. Q., Song, S. S., Kuang, H., & Xu, C. L. (2016). Development of an immunochromatographic test strip and ic-ELISA for tetrabromobisphenol: A detection in lake water and rice pudding samples. Food and Agricultural Immunology, 27(4), 460–470. doi: 10.1080/09540105.2015.1126234
- Zawilla, N. H., Li, B., Hoogmartens, J., & Adams, E. (2007). Improved reversed-phase liquid chromatographic method combined with pulsed electrochemical detection for the analysis of amikacin. Journal of Pharmaceutical and Biomedical Analysis, 43(1), 168–173. doi: 10.1016/j.jpba.2006.06.043