
 ?Mathematical formulae have been encoded as MathML and are displayed in this HTML version using MathJax in order to improve their display. Uncheck the box to turn MathJax off. This feature requires Javascript. Click on a formula to zoom.
ABSTRACT
A competitive lateral flow immunoassay (LFA) using fluorescent microspheres (FMs) as label was developed for the quantitative detection of chloramphenicol (CAP), thiamphenicol (TAP) and florfenicol (FF) in milk. The limit of detection (LOD) for CAP, TAP and FF in milk was 0.08, 0.8 and 1.9 μg L−1, respectively. The recovery of intra and inter-assay ranged from 87.7% to 107.0% and 82.5% to 112.3%, with corresponding coefficient of variations less than 11.3% and 14.5%, respectively. The sensitivity of the FMs lateral flow assay (FMs-LFA) was comparable to those of the colloidal gold lateral flow assay. A quantitative comparison of the FMs-LFA and LC–MS/MS analysis of milk samples indicated good agreement between the two methods. The FMs-LFA can be used as a reliable, rapid and cost-effective method for food safety analysis.
1. Introduction
Chloramphenicol (CAP), thiamphenicol (TAP) and florfenicol (FF) are broad-spectrum antibiotics which have been extensively used to treat various infections in animals. With the health side-effects to humans and the emergence of drug-resistant bacteria (Chen et al., Citation2014), the use of these antibiotics was strictly limited in many countries including China, European Community, the United States, Canada and Japan. In China, CAP was prohibited for use in any food-producing animals and the maximum residue limit for TAP was set at 50 μg L−1 in milk. Meanwhile, FF has not been approved for use in lactating cattle and sheep (Ministry of Agriculture [MOA], Citation2002). Considering that, it is necessary to establish a rapid, sensitive assay for the determination of CAP, TAP and FF residues in food samples.
A number of analytical methods have been developed to detect CAP, TAP and FF; these include high-performance liquid chromatography (Xie et al., Citation2011), gas chromatography-mass spectrometry (GC-MS) (Shen et al., Citation2009), liquid chromatography tandem mass spectrometry (LC–MS/MS) (Barreto, Ribeiro, Hoff, & Dalla Costa, Citation2016; Li, Hu, Huo, & Xu, Citation2006; Rezende, Filho, & Rocha, Citation2012), enzyme-linked immunosorbent assay (Fodey, Murilla, Cannavan, & Elliott, Citation2007; Liu et al., Citation2014; Xu, Xu, Ma, et al., Citation2015) and lateral flow immunoassay (LFA) (Bai et al., Citation2013; Guo et al., Citation2015; Samsonova, Cannavan, & Elliott, Citation2012; Xu, Xu, Ma, Liu, et al., Citation2015). Compared with chromatographic methods, immunoassays are simple, rapid and do not require expensive equipment and professional operator. In conclusion, the LFA has proven to be a suitable tool for onsite test to detect various types of analytes (Hsieh et al., Citation2013).
Fluorescent microspheres (FMs) have been commonly used in immunoassays because of their stable morphology, high fluorescence efficiency and the ability of surface modification (Eucker et al., Citation2010; Li et al., Citation2015; Liang, Zou, Guo, Gui, & Zhu, Citation2013). In this study, carboxylate-modified FMs were covalently conjugated with antibodies to form FMs-mAb probes. A competitive format was selected to detect CAP, TAP and FF in milk. In addition, fluorescent microspheres lateral flow immunoassay (FMs-LFA) was also compared with the colloidal gold lateral flow immunoassay (CG-LFA) and LC–MS/MS.
2. Materials and methods
2.1. Reagents and apparatus
Standards (CAP, TAP and FF) were purchased from National Institutes for Food and Drug Control (Beijing, China). 2-(N-morpholino) ethanesulfonic acid (MES), N-hydroxysuccinimide (NHS), 1-ethyl-3-(3-dimethylaminopropyl)-carbodiimide (EDC), bovine serum albumin (BSA) and goat anti-mouse immunoglobulin (IgG) antibody were purchased from Sigma-Aldrich (St Louis, MO, USA). FluoSpheres® carboxylate-modified microspheres, 200 nm, red (580/605), 2% solids, were purchased from Invitrogen (Carlsbad, CA, USA). The antibodies including anti-CAP monoclonal antibody (mAb), anti-TAP monoclonal antibody (mAb); and the antigens including CAP-BSA and TAP-BSA were obtained from WDWK Biotech Co. Ltd. (Beijing, China). The nitrocellulose (NC) membrane (Millipore 135) was supplied by Millipore Corporation (Bedford, MA). Polyvinylchloride (PVC) sheets, the sample pad (glass fiber membrane, SB06) and the absorbance pad were purchased from Kinbio Tech Co., Ltd. (Shanghai, China). The dispensing platform (Model: ZX1000) and the guillotine (Model: CM4000) were provided by BioDot (Irvine, CA, USA). The NanoDrop ND-1000 spectrophotometer was provided by Gene Co., Ltd. (Hong Kong, China). The UV spectrometer was obtained from Qiangyun Co., Ltd. (Shanghai, China). The ESE Quant LFR fluorescence reader was purchased from Qiagen (Dusseldorf, Germany).
2.2. Preparation of FMs-mAb probe
The FMs-mAb probe was prepared with the following methods (Zhou et al., Citation2014). Ten microliters of 2% red FMs was dispersed in 1 mL of MES buffer (50 mM, pH 5), 10 μL of 0.5 mg mL−1 EDC solution and 12 μL of 0.5 mg mL−1 of the NHS solution were sequentially added to the FMs solution for 15 min at room temperature. The anti-CAP mAb (10 μL), anti-TAP mAb (10 μL) were added and incubated for another 2 h, respectively. Then, 100 μL of 10% BSA (w/v) was added drop-wise for 30 min. The mixtures were centrifuged at 10,000 rpm for 10 min at 4°C, and the red FMs-mAb precipitates were resuspended with 200 μL of 0.05 M phosphate buffer (pH 7.4) containing 5% sucrose, 0.5% BSA, 0.05% polyvinyl pyrolidone and 1% Tween-20. Finally, the suspensions were stored at 4°C in the dark for further use.
2.3. Preparation of the CG-mAb probe
The CG-mAb probe was synthesized as described in previous protocols with a few modifications (Kolosova, De Saeger, Sibanda, Verheijen, & Van Peteghem, Citation2007). In brief, the pH of the CG solution was adjusted to 9 by adding 1.6 μL of 0.1 mol L−1 K2CO3. Eighty microliters of 0.2 μg L−1 anti-CAP mAb solution was added drop-wise to 1 mL of CG solution for 60 min at 4°C. Then, 100 μL of 10% BSA was incubated with the mixtures at room temperature for 10 min. The labeled anti-CAP mAb was purified by centrifugation at 4°C for 10 min at 10,000 rpm, and the supernatant was removed. The precipitate was resuspended in 200 μL of 0.05 M phosphate buffer (pH 7.4) containing 5% sucrose, 0.5% BSA, 0.05% polyvinyl pyrolidone and 1% Tween-20. The anti-TAP mAb probe was also prepared in the same way under optimized conditions.
2.4. Assembly of test strip
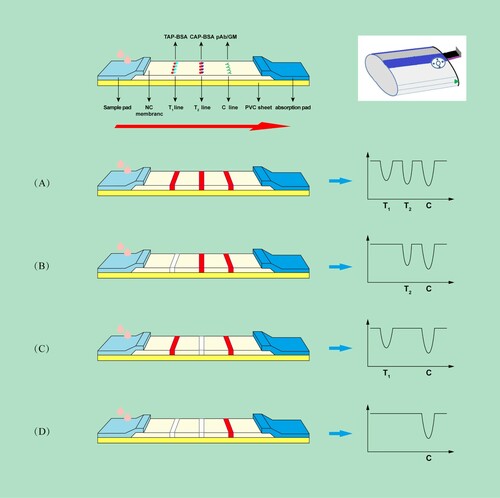
The test strip consists of a sample pad, conjugate pad, NC membrane, absorbent pad and PVC sheet, as shown in . Firstly, the NC membrane was pasted onto the PVC sheet. Then, the sample pad and the absorption pad were pasted to the lower and upper portions of the PVC sheet, respectively, with 2 mm overlap to the NC membrane on both sides. A volume of 1.0 μL cm−1 of TAP-BSA (1.2 mg mL−1), CAP-BSA (1.6 mg mL−1) and goat anti-mouse IgG antibody (0.1 mg mL−1) were sprayed onto the NC membrane in order to form two test lines (test 1 for TAP and test 2 for CAP) and a control line, respectively. The distance of each line was 3 mm.
Figure 1. The schematic illustration of FMs-LFA. (A) Negative, (B) TAP/FF positive, (C) CAP positive and (D) TAP/FF and CAP positive.
2.5. Establishment of calibration curves
A series of CAP standards in milk were diluted by PBS (0.01 M, pH 7.4). The CAP concentrations were 0, 0.0125, 0.025, 0.05, 0.1, 0.2, 0.4 and 0.8 μg L−1. Similarly, the TAP concentrations were 0, 0.63, 1.25, 2.5, 5, 10, 20 and 40 μg L−1, and the FF concentrations were 0, 1.25, 2.5, 5, 10, 20, 40 and 80 μg L−1. Each concentration was analyzed in triplicate. The limit of detection (LOD) for the quantitative detection was defined as the concentration which corresponded to the blank test line value plus 3 times the standard deviation of the blank.
2.6. Specificity of FMs-LFA
To evaluate the specificity of the FMs-LFA for florfenicol (FF), florfenicol amine (FFA), streptomycin (STR), tetracycline (TC), and sulfamethazine (SM2), standard solutions of these antibiotics with a series of concentrations were prepared by diluting the respective stock solutions (1 mg mL−1) with PBS (0.01 M, pH 7.4). The values of cross reactivity (CR) were calculated according to the following equation:
2.7. Accuracy and precision of FMs-LFA and CG-LFA
The accuracy and precision of FMs-LFA and CG-LFA were carried out by detecting different concentrations of CAP, TAP and FF. In FMs-LFA, the milk was diluted four times with PBST and then spiked with known concentrations of drugs (CAP, 0.2, 0.4 and 0.6 μg L−1, TAP 20, 40 and 80 μg L−1, FF 40, 80 and 160 μg L−1) to calculate the recovery and coefficient of variations (CVs). Three experiments were repeated.
2.8. Detection of blind milk samples
Fifteen blind milk samples were provided by the National Veterinary Drug Safety Evaluation Center (Beijing, China). These samples were tested by FMs-LFA and GC-LFA, the results were confirmed by LC–MS/MS (Zhang et al., Citation2008).
3. Results and discussion
3.1. Detection principle of the FM-LFA
In this study, 150 μL of sample solution was added into one well of the 96-microtiter plate containing labeled antibody probes. The sample solution and the probes were thoroughly mixed. After incubating for 3 min at room temperature, the test strips were immediately vertically inserted into the corresponding microwell to absorb the mixture for 10 min. The result, which is the change in optical signal density on the two T line (T1 and T2), could be quantitated by the ESE Quant lateral flow reader in 10 min. In the absence of analytes in the sample, the labeled antibody probes vertically migrate into the NC membrane and form antibody–antigen complexes with the immobilized TAP-BSA and CAP-BSA conjugates ((A)), respectively. In contrast, if the sample contains sufficient analytes, no result was detected in the test zone ((B–D)). In any case, the control zone (C line) should always show a color line, if not, the result was considered to be invalid.
3.2. Calibration curves of FMs-LFA and CG-LFA
The calibration curves were set up by plotting the logarithm of the concentration of analytes (x) vs. the ratio of the optical signal density (peak area) of positive and blank samples (y). The peak area of the blank and positive samples was renamed as B0 and B, respectively.
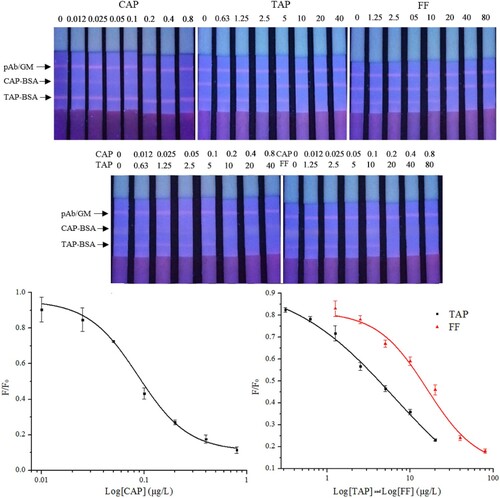
The calibration curves of the FMs-LFA were constructed by plotting B/B0 against the logarithm of analyte concentrations. The results are shown in . Three calibration curves were calculated with IC50 values of 0.09, 6.4 and 15.9 μg L−1 for CAP, TAP and FF, respectively. The LOD for CAP, TAP and FF in milk was 0.08, 0.8 and 1.9 μg L−1, respectively.
Figure 2. Fluorescent images of the LFA acquired under UV light and the calibration curves of FMs-LFA.
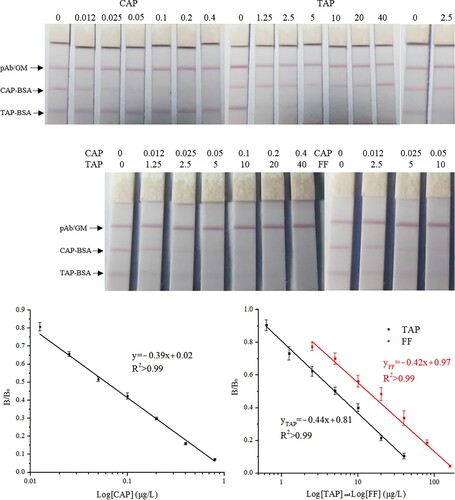
The calibration curves of the CG-LFA were also constructed by plotting B/B0 against the logarithm of analyte concentrations. The results are shown in . Three calibration curves were calculated with IC50 values of 0.06, 5.1 and 13.2 μg L−1 for CAP, TAP and FF, respectively. The LOD for CAP, TAP and FF in milk was 0.01, 0.5 and 1.1 μg L−1, respectively.
Figure 3. The images and calibration curves of CG-LFA.
3.3. Specificity of FMs-LFA
The specificity of the FMs-LFA was determined by evaluating CR with frequently occurring antibiotics, including FF, FFA, STR, TC and SM2. The FMs-LFA only exhibited CR with FF of 37%, and negligible cross reactivities with other antibiotics (<1%).
3.4. Accuracy and precision of FMs-LFA and CG-LFA
Recovery studies were executed with the milk samples spiked with known concentrations of analytes and the results are summarized in . For FMs-LFA, the average intra-assay recovery values of CAP, TAP and FF ranged from 87.7% to 107.0%, with CV less than 11.3%, the average inter-assay recovery values of CAP, TAP and FF ranged from 82.5% to 112.3%, with CV less than 14.5%. For CG-LFA, the average intra-assay recovery values of CAP, TAP and FF ranged from 94.9% to 111.7%, with CV less than 11.5%, the average inter-assay recovery values of CAP, TAP and FF ranged from 91.6% to 124.1%, with CV less than 13.6%.
Table 1. The intra and inter-assay recovery studies of FMs-LFA and CG-LFA (n = 3).
3.5. Detection of blind milk samples
A total of 15 blind milk samples were analyzed using FMs-LFA, CG-LFA and LC–MS/MS. The results () show that the No. 7 positive sample was simultaneously detected by three methods, indicating a good agreement with each other.
Table 2. Comparison of FMs-LFA, GC-LFA and LC–MS/MS for quantification of CAP, TAP and FF in milk samples (n = 15).
4. Conclusions
In summary, we concluded that FMs were a promising practical label for LFAs. The FMs-LFA were capable of detecting CAP, TAP and FF in milk with a minimum of 0.08, 0.8 and 1.9 μg L−1, respectively. The assay provided quantitative results for the accurate determination of CAP, TAP and FF in milk samples. Analysis of CAP, TAP and FF in blind milk samples showed that the results determined by FMs-LFA were consistent with those determined by LC–MS/MS. Therefore, the FMs-LFA can be used as a reliable, rapid and cost-effective method for food safety analysis.
Disclosure statement
No potential conflict of interest was reported by the authors.
Additional information
Funding
Notes on contributors
Jianyi Wang
Jianyi Wang began to study as a Ph.D. student in the College of Veterinary Medicine of China Agricultural University in 2015. His research interests are monoclonal antibody development and applications.
Qi Wang
Qi Wang got her master degree in the College of Veterinary Medicine of China Agricultural University in 2016. Her research interests are immunoassay’s development for veterinary drug residue.
Yongjun Zheng
Yongjun Zheng got his Ph.D. from China Agricultural University and began to work as a faculty in College of Engineering of China Agricultural University. He is currently a full professor in Mechanical and Electrical Engineering. His research interests are biosensor development.
Tao Peng
Tao Peng began to study as a Ph.D. student in the College of Veterinary Medicine of China Agricultural University in 2015. His research interests are immunoassay’s development for verterinary drug residue.
Kai Yao
Kai Yao began to study a Ph.D. student in the College of Veterinary Medicine of China Agricultural University in 2016. His research interests are immunoassay’s development for veterinary drug residue.
Sanlei Xie
Sanlei Xie began to study a Ph.D. student in the College of Veterinary Medicine of China Agricultural University in 2014. His research interests are immunoassay’s development for veterinary drug residue.
Xiya Zhang
Xiya Zhang got his Ph.D. from China Agricultural University in 2017. His research interests are monoclonal antibody development and applications.
Xi Xia
Xi Xia got his Ph.D. from China Agricultural University and began to work as a faculty in College of Veterinary Medicine of China Agricultural University. He is currently an assistant professor in basic veterinary science. His research interests are veterinary residue analysis and microbial drug resistance.
Jiancheng Li
Jiancheng Li got his Ph.D. from China Agricultual University and began to work as a faculty in College of Veterinary Medicine of China Agricultural University. He is currently an assistant professor in basic veterinary science. His research interests are veterinary pharmacology and toxicology.
Haiyang Jiang
Haiyang Jiang got his Ph.D. from Agricultural University and began to work as a faculty in College of Veterinary Medicine of China Agricultural University. He is currently an professor in basic veterinary science. His research interests are food safety and veterinary pharmacology and toxicology.
Related Research Data
References
- Bai, Z., Luo, Y., Xu, W., Gao, H., Han, P., Liu, T., … Huang, K. (2013). Development of a new fluorescence immunochromatography strip for detection of chloramphenicol residues in chicken muscles. Journal of the Science of Food and Agriculture, 93(15), 3743–3747. doi: https://doi.org/10.1002/jsfa.6232
- Barreto, F., Ribeiro, C., Hoff, R. B., & Dalla Costa, T. (2016). Determination of chloramphenicol, thiamphenicol, florfenicol and florfenicol amine in poultry, swine, bovine and fish by liquid chromatography-tandem mass spectrometry. Journal of Chromatography A, 1449, 48–53. doi: https://doi.org/10.1016/j.chroma.2016.04.024
- Chen, H., Rao, H., He, P., Qiao, Y., Wang, F., Liu, H., … Yao, J. (2014). Potential toxicity of amphenicol antibiotic: Binding of chloramphenicol to human serum albumin. Environmental Science and Pollution Research, 21(19), 11340–11348. doi: https://doi.org/10.1007/s11356-014-3081-7
- Eucker, S. A., Hoffman, B. D., Natesh, R., Ralston, J., Armstead, W. M., & Margulies, S. S. (2010). Development of a fluorescent microsphere technique for rapid histological determination of cerebral blood flow. Brain Research, 1326, 128–134. doi: https://doi.org/10.1016/j.brainres.2010.02.059
- Fodey, T., Murilla, G., Cannavan, A., & Elliott, C. (2007). Characterisation of antibodies to chloramphenicol, produced in different species by enzyme-linked immunosorbent assay and biosensor technologies. Analytica Chimica Acta, 592(1), 51–57. doi: https://doi.org/10.1016/j.aca.2007.04.015
- Guo, L., Song, S., Liu, L., Peng, J., Kuang, H., & Xu, C. (2015). Comparison of an immunochromatographic strip with ELISA for simultaneous detection of thiamphenicol, florfenicol and chloramphenicol in food samples. Biomedical Chromatography, 29(9), 1432–1439. doi: https://doi.org/10.1002/bmc.3442
- Hsieh, K. H., Lin, C. P., Cheng, C. C., Lai, C. P., Sheu, S. Y., Yao, C. H., … Kuo, T. F. (2013). Screening procedures for chloramphenicol residue determination in serum, milk, and feedstuff using immunochromatographic assay. Food Biotechnology, 27(4), 328–341. doi: https://doi.org/10.1080/08905436.2013.838784
- Kolosova, A. Y., De Saeger, S., Sibanda, L., Verheijen, R., & Van Peteghem, C. (2007). Development of a colloidal gold-based lateral-flow immunoassay for the rapid simultaneous detection of zearalenone and deoxynivalenol. Analytical and Bioanalytical Chemistry, 389(7–8), 2103–2107. doi: https://doi.org/10.1007/s00216-007-1642-z
- Liang, C., Zou, M., Guo, L., Gui, W., & Zhu, G. (2013). Development of a bead-based immunoassay for detection of triazophos and application validation. Food and Agricultural Immunology, 24(1), 9–20. doi: https://doi.org/10.1080/09540105.2011.639065
- Li, X., Hu, Y., Huo, T., & Xu, C. (2006). Comparison of the determination of chloramphenicol residues in aquaculture tissues by time-resolved fluoroimmunoassay and with liquid chromatography and tandem mass spectrometry. Food and Agricultural Immunology, 17(3–4), 191–199. doi: https://doi.org/10.1080/09540100601090349
- Li, X., Shen, J., Wang, Q., Gao, S., Pei, X., Jiang, H., & Wen, K. (2015). Multi-residue fluorescent microspheres immunochromatographic assay for simultaneous determination of macrolides in raw milk. Analytical and Bioanalytical Chemistry, 407(30), 9125–9133. doi: https://doi.org/10.1007/s00216-015-9078-3
- Liu, N., Song, S., Lu, L., Nie, D., Han, Z., Yang, X., … Zheng, X. (2014). A rabbit monoclonal antibody-based sensitive competitive indirect enzyme-linked immunoassay for rapid detection of chloramphenicol residue. Food and Agricultural Immunology, 25(4), 523–534. doi: https://doi.org/10.1080/09540105.2013.847065
- Ministry of Agriculture. (2002). Agricultural standards [Internet]. No. 235 Bulletin of the Ministry of Agriculture of the People’s Republic of China. Retrieved November 20, 2011, from http://www.moa.gov.cn/zwllm/nybz/index_2.htm
- Rezende, D. R., Filho, N. F., & Rocha, G. L. (2012). Simultaneous determination of chloramphenicol and florfenicol in liquid milk, milk powder and bovine muscle by LC–MS/MS. Food Additives & Contaminants: Part A, 29(4), 559–570. doi: https://doi.org/10.1080/19440049.2011.641161
- Samsonova, J. V., Cannavan, A., & Elliott, C. T. (2012). A critical review of screening methods for the detection of chloramphenicol, thiamphenicol, and florfenicol residues in foodstuffs. Critical Reviews in Analytical Chemistry, 42(1), 50–78. doi: https://doi.org/10.1080/10408347.2012.629951
- Shen, J., Xia, X., Jiang, H., Li, C., Li, J., Li, X., & Ding, S. (2009). Determination of chloramphenicol, thiamphenicol, florfenicol, and florfenicol amine in poultry and porcine muscle and liver by gas chromatography-negative chemical ionization mass spectrometry. Journal of Chromatography B, 877(14), 1523–1529. doi: https://doi.org/10.1016/j.jchromb.2009.03.040
- Xie, K., Jia, L., Yao, Y., Xu, D., Chen, S., Xie, X., … Liu, Z. (2011). Simultaneous determination of thiamphenicol, florfenicol and florfenicol amine in eggs by reversed-phase high-performance liquid chromatography with fluorescence detection. Journal of Chromatography B, 879(23), 2351–2354. doi: https://doi.org/10.1016/j.jchromb.2011.06.027
- Xu, N., Xu, L., Ma, W., Kuang, H., & Xu, C. (2015). Development and characterisation of an ultrasensitive monoclonal antibody for chloramphenicol. Food and Agricultural Immunology, 26(3), 440–450. doi: https://doi.org/10.1080/09540105.2014.950201
- Xu, N., Xu, L., Ma, W., Liu, L., Kuang, H., & Xu, C. (2015). An ultrasensitive immunochromatographic assay for non-pretreatment monitoring of chloramphenicol in raw milk. Food and Agricultural Immunology, 26(5), 635–644. doi: https://doi.org/10.1080/09540105.2014.998640
- Zhang, S., Liu, Z., Guo, X., Cheng, L., Wang, Z., & Shen, J. (2008). Simultaneous determination and confirmation of chloramphenicol, thiamphenicol, florfenicol and florfenicol amine in chicken muscle by liquid chromatography–tandem mass spectrometry. Journal of Chromatography B, 875(2), 399–404. doi: https://doi.org/10.1016/j.jchromb.2008.09.035
- Zhou, J., Zhu, K., Xu, F., Wang, W., Jiang, H., Wang, Z., & Ding, S. (2014). Development of a microsphere-based fluorescence immunochromatographic assay for monitoring lincomycin in milk, honey, beef, and swine urine. Journal of Agricultural and Food Chemistry, 62(49), 12061–12066. doi: https://doi.org/10.1021/jf5029416