
ABSTRACT
Little is known about pollen-food allergy syndrome (PFS) in China. To investigate the clinical characteristics, as well as sensitization patterns, of PFS in China. Clinical parameters and serum Immunoglobulin E (IgE) responses to prevalent pollens, plant foods and corresponding allergen components were evaluated. The top three most common pollen-associated allergenic foods were peach, apple and pear. Fifty-nine percent of the patients with PFS were allergic to peach. Sixty-one percent of PFS patients developed systemic reactions with or without oral cavity discomfort upon ingestion of the culprit food. Positive IgE responses to nonspecific lipid transfer proteins occurred in 69.9% of PFS patients, which was in accordance with the high prevalence of systemic reactions. Peach was the most common allergenic food in PFS patients. Patients with PFS in China showed an LTP-dominant sensitization profile and usually presented systemic reactions upon consumption of the allergenic foods.
1. Introduction
Pollen allergy is one of the most common chronic allergic diseases in western countries (Platts-Mills, Citation2015; Salo et al., Citation2014), as well as in Northern China (Li et al., Citation2009, Citation2012). Pollen-related food allergy, i.e. pollen-food allergy syndrome (PFS), is also common, and PFS is the predominant type of adult food allergy in some countries (Asero et al., Citation2009; Skypala et al., Citation2011). Symptoms of PFS range from mild oral cavity discomfort to serious systemic reactions or even life-threatening anaphylactic shock (Webber & England, Citation2010). In addition to the seasonal outbreak of pollen-elicited symptoms, PFS-associated food reactions are often perennial (Geroldinger-Simic et al., Citation2011). PFS can arouse long-term, persisting inflammatory and progressive disorders in the oesophagus (Mahdavinia et al., Citation2017). PFS noticeably affects health-related quality of life (Beyer, Franke, Simon, & Treudler, Citation2016; Ludman et al., Citation2016), especially for those sufferers who have multiple food allergies (Beyer et al., Citation2016).
It is difficult to estimate the accurate prevalence of PFS, because people who suffer from mild discomfort upon exposure to the allergenic food may simply avoid it instead of reporting their symptoms to a physician. A population-based investigation from Britain reported a two percent prevalence of PFS (Burney et al., Citation2014), while in British children with seasonal allergic rhinitis, the prevalence of PFS seemed to be relatively high and increase with age (17% in children under 5 years old, and as high as 78% in children beyond 10 years old) (Ludman et al., Citation2016). According to previous reports from middle and southern Europe, approximately 30–70% of pollinosis sufferers have also developed PFS (Cuesta-Herranz et al., Citation2010; Flores, Cervera, Sanz, Diaz-Perales, & Fernández, Citation2012; Geroldinger-Simic et al., Citation2011), especially patients who are allergic to birch pollen, as more than 70% were reported to have PFS (Geroldinger-Simic et al., Citation2011). The most frequently reported allergenic foods were apples, hazelnuts and kiwifruit. In Japan, the prevalence of PFS in pollen-sensitized individuals is approximately 4.1% (Maeda, Inomata, Morita, Kirino, & Ikezawa, Citation2010). In America, median estimates of the prevalence of PFS among patients with a pollen allergy are 5% among children and 8% among adults (Ma, Sicherer, & Nowak-Wegrzyn, Citation2003).
The association between pollinosis and pollen-food allergies has been fully elucidated in the literature (Egger et al., Citation2006; Jimenez-Lopez, Gachomo, Ariyo, Baba-Moussa, & Kotchoni, Citation2012; Morales, López-Matas, Moya, & Carnés, Citation2014). Advances in molecular biology have allowed the isolation and purification, as well as recombinant production, of allergens to become reality. Panallergens are cross-reactive allergen components from different sources with similar structures and Immunoglobulin E (IgE) reactivities, such as PR-10 proteins, nonspecific lipid transfer proteins (nsLTPs), and profilins. Extensive knowledge of panallergen existence was the foundation of PFS (Hauser, Roulias, Ferreira, & Egger, Citation2010; Jimenez-Lopez et al., Citation2012; Morales et al., Citation2014; Scheurer et al., Citation2001). In a study by Mastrorilli et al. (Citation2016), five panallergen sensitization patterns were identified in Italian children with PFS, including the following: (i) co-sensitization to ≥2 panallergens; (ii–iv) sensitization to either a profilin, nsLTP, or PR-10, respectively; and (v) no sensitization to panallergens.
Little is known about PFS in China. In this study, the clinical characteristics and sensitization patterns of 83 patients with PFS were evaluated. Forty-six pollinosis sufferers without PFS were included as controls. All the patients were from Northern China, where pollinosis is prevalent in spring, as well as in late summer and autumn.
2. Materials and methods
2.1. Subjects
According to the results of an airborne allergen investigation in China (Ye, Zhang & Qiao, Citation1988), patients allergic to one or more of the seven species of spring pollens, including poplar, elm, white ash, birch, juniper, phoenix and willow trees, and/or at least one of the eight species of late summer and autumn pollens, including mugwort, Humulus japonicas, ragweed, goosefoot, Cirsium japonicum, Kochia scoparia, Bermuda grass and Timothy grass, were recruited. The study included 83 patients with PFS (PFS group) and 46 pollinosis sufferers without pollen-food allergies (PS group). Pollinosis was defined as seasonal rhinitis and/or asthma occurring with or without conjunctivitis in the pollen seasons, together with a confirmed IgE sensitization by a skin test and/or serum IgE response to a pollen extract. Plant food allergy was diagnosed based on a convincing history and confirmed IgE sensitization to corresponding plant food. Patients in the PS group never experienced any adverse reactions to any kind of food.
All participants were recruited as outpatients from the Allergy Department at Peking Union Medical College Hospital (Beijing, China). All the diagnoses were made by experienced allergists at the clinic. Clinical parameters of the patients were carefully collected and re-evaluated by an additional allergist. This research protocol was approved by the Ethical Committee of Peking Union Medical College. Written informed consent was obtained from each participant prior to study inclusion.
2.2. Serological analysis
Serum total IgE antibodies (tIgEs) and specific IgE antibodies (sIgEs) against whole extracts of 15 species of pollens (the previously mentioned 7 that appear in spring and 8 that appear in late summer and autumn) and 12 kinds of plant foods, as well as 10 component allergens from panallergen families, were detected using an ImmunoCAP system (Thermo Fisher, Uppsala, Sweden). We used 0.35 kU/L as a cut-off for sIgE levels.
2.3. Statistical analysis
SPSS 16.0 statistical software (SPSS, Inc., Chicago, IL, USA) was used to analyse the data. Frequencies of qualitative variables were compared with Pearson’s chi-squared test. Spearman’s rank correlation coefficient (ρ) was used to quantify correlations between variables. Comparisons of quantitative variables were carried out using Student’s t-test, in the case of normally distributed data, or the Mann–Whitney U-test, in the case of a non-normal distribution. A p-value <0.05 was considered statistically significant. A multiple regression analysis was used to explore the possible risk factors or protective factors for the development of PFS in pollinosis sufferers. A univariate analysis was used to assess the odds ratios (ORs) of relevant variables. ORs are reported with 95% confidence intervals (CIs).
3. Results
3.1. Study population and clinical parameters
Eighty-three pollinosis sufferers with PFS and 46 pollinosis sufferers without PFS were recruited for this study. The clinical characteristics of both groups are shown in . PFS patients had a lower level of tIgE and a higher frequency of dust mite sensitization than PS patients. No significant difference was found in age of admission, age at pollinosis onset, sex, pollen seasons, or pollinosis duration. More females were enrolled than males, and this disproportion was even more evident in the PFS group (57.8% vs. 42.2%, respectively, p = 0.04).
Table 1. Characteristics of patients with and without plant food allergy.
3.2. Pollen sensitization and symptoms
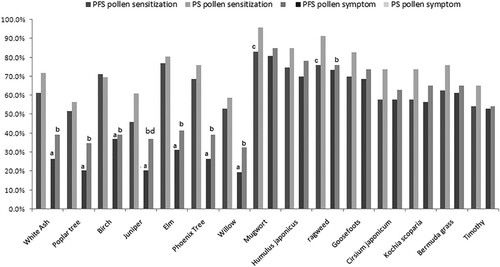
The distribution of pollen sensitization, as confirmed by serum-specific IgE tests, is shown in . Pollinosis to late summer and autumn pollens seemed to be more common than that to spring pollens. Although the seasonal pollens showed similar sensitization frequencies, fewer patients who were sensitized to spring pollens presented clinical respiratory symptoms in comparison to the patients who were sensitized to late summer and/or autumn pollens ( and eTable 1). Juniper pollen allergy and mugwort and ragweed pollen sensitizations were significantly more common in the PS group than in the PFS group ( and eTable 1). Only seven patients in total were monosensitized to birch (n = 5, PFS group), mugwort (n = 1, PFS group) and Humulus japonicas (n = 1, PS group). All the remaining patients were sensitized to two or more species of pollen. PFS patients tended to exhibit both upper and lower respiratory symptoms (rhinitis complicated by asthma or cough) more frequently than PS patients (54.2% vs. 39.1%, respectively).
Figure 1. Pollen sensitizations and allergies in both PFS and PS groups. Statistical significances are indicated by lowercase letters: (a) comparison between pollen sensitization and allergy in the PFS group; (b) comparison between pollen sensitization and allergy in the PS group; (c) comparison between the PFS and PS groups in pollen sensitization; (d) comparison between the PFS and PS groups in pollen symptom.
3.3. Food sensitization and symptoms
(a) shows positivity rates of corresponding food IgE sensitization and its clinical translation in the total 129 pollinosis sufferers. Clinical translation rate of IgE sensitization to different foods differs a lot. Peach had the highest rates of both IgE sensitization and clinical translation. Only 1% patients sensitized to celery had symptoms, while its IgE sensitization rate was as high as 79.8% among all the pollinosis sufferers. (b,c) show sensitizations to the plant foods studied in both the PFS and PS groups. Sensitization frequencies of peach and apple were higher in PFS group than that in PS group ((b)). The sIgE titers of plant foods were comparable in the PFS group and the PS (eFigure 1). shows the reported pollen-food allergies corresponding to different pollen seasons. The number of plant foods reported by each individual ranged from 1 to 10 foods (the median was 3). Peach was the most frequently reported pollen-food allergy in all seasons, followed by apple. The most common allergenic tree nut was hazelnut, especially in patients with spring pollinosis. shows the clinical reactions to the tested plant foods. The food-associated symptoms with the highest frequency in PFS patients were oral allergy syndrome (OAS, 72.3%), followed by general urticaria and/or angioedema (32.5%) and respiratory symptoms (24.1%), including rhinitis, asthma or tightness of the chest. OAS alone was the most frequent clinical manifestation (38.6%), followed by urticaria or angioedema with OAS (12%) and gastrointestinal discomfort (8.4%).
Figure 2. Plant-food sensitizations and allergies. (a) Clinical translation of food IgE sensitization; (b) sensitization rates of plant foods.
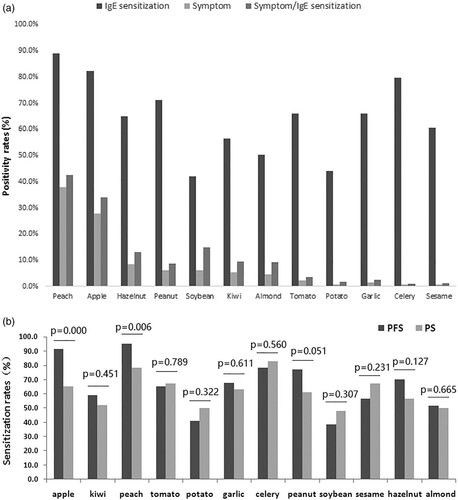
Table 2. Reported plant food allergy in patients allergic to pollens of different seasons.
Table 3. Food-associated symptoms of patients with PFS.
3.4. Panallergen sensitization profile
shows the panallergen sensitization patterns and relevant clinical symptoms of the PFS group. A total of 81 of the 83 PFS patients showed a positive IgE response to at least one of the three tested panallergens, with a remarkably higher frequency than the PS patients (97.6% vs. 69.6%, respectively, p = 0.000). When assessing the sensitization of component allergens, higher positive rates of IgE responses to Bet v 1 (37.3% vs. 19.6%), Art v 3 (62.7% vs. 34.8%), Gly m 4 (28.9% vs. 10.9%), Pru p 1 (31.3% vs. 13.0%) and Pru p 3 (57.8% vs. 34.8%) were observed in the PFS group than the PS group, respectively (). With regard to the sensitization patterns of PR-10 proteins (Bet v 1, rAra h 8, nGly m 4, rCor a 1, and rPru p 1), LTPs (nArt v 3, rAra h 9, rCor a 8, and rPru p 3) and Profilin protein (Bet v 2) in the PFS group, monosensitization to an LTP was the most common (33 in 83, 39.8%), followed by monosensitization to a PR-10 (15 in 83, 18.1%) and profilin (11 in 83, 13.3%). In total, 69.9% of PFS patients (58 in 83) were sensitized to any one of the LTPs, and 38.6% of PFS patients (32 in 83) were sensitized to any one of the PR-10s, while 37.3% of PFS patients (31 in 83) were sensitized to profilin. No positive response to a PR-10 from another source was observed in the case of negative IgE responses to Bet v 1 and Pru p 1. Likewise, no positive response to an LTP from another source was found in the case of negative IgE responses to Art v 3 and Pru p 3. PR-10 sensitization was more common in the group of patients who had OAS compared with those who did not have OAS, and LTP sensitization was more common in the PS group.
Figure 3. Sensitization rates of component allergens in PFS and PS groups.
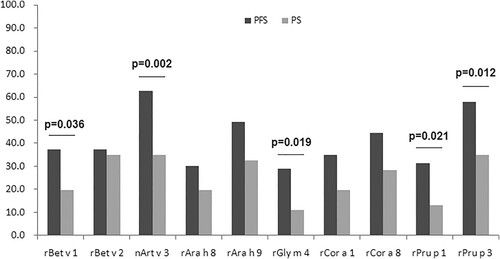
Table 4. Sensitization patterns and clinical relevance of patients with PFS.
3.5. Multivariate and univariate analyses
Multivariate analysis (PFS vs. PS) showed that the factors having a causal relation with pollen-food sensitization were tIgE (p = 0.047), sensitization to Art v 3 (p = 0.001) and sensitization to Bet v 1 (p = 0.020). Sensitization to Art v 3 (ρ = 1.417) and Bet v 1 (ρ = 1.197) were directly proportional to the risk of suffering a food allergy, whereas the association with tIgE (ρ = −0.001) was inversely proportional. The ORs for the variables tIgE, Bet v 1 and Art v 3 were 0.999 (CI: 0.998–1.000), 2.451 (CI: 1.044–5.754) and 3.145 (CI: 1.482–6.674), respectively. Mite allergy was not significant in the multivariate analysis, but it was correlated to tIgE (rank sum test, p = 0.000); thus, it was just a confounding factor. In the univariate analysis of food allergen components, the ORs for the variables Pru p 3, Pru p 1 and Gly m 4 were 2.571 (CI: 1.218–5.427), 3.041 (CI: 1.147–8.065) and 4.1 (CI: 3.336–9.462), respectively.
4. Discussion
All of the pollinosis sufferers in this study were from Northern China, as pollinosis is mainly prevalent in this region of China and is relatively rare in the South (Li et al., Citation2009). In both the PFS and PS groups, female patients seemed to be more common than male patients. This was in accord with the present consensus that female adults are predisposed to develop allergic diseases such as asthma, food allergies and anaphylaxis, which might be associated with the oestrogen receptor-dependent mast cell activation (Jensen-Jarolim & Untersmayr, Citation2008). The predisposition for anaphylaxis is especially distinct (Burr & Merrett, Citation1983; Niestijl Jansen et al., Citation1994; Schäfer et al., Citation2001; Webb & Lieberman, Citation2006). No differences in the sex ratio, onset age of pollinosis, duration of pollinosis, or pollen season distribution were found between the two groups. The PS group had a higher level of serum tIgE and a higher positivity rate of dust mite sensitization than the PFS group. Dust mite sensitization was correlated to the serum level of tIgE (rank sum test, p < 0.001) and confirmed to be a confounding factor in an additional multivariate analysis.
Sensitizations to spring pollens were common, while clinical allergies to spring pollens were less frequent, compared with late summer and autumn pollens (). This is in accord with a previous multicenter investigation on the prevalence of pollen sensitization in patients with asthma and or rhinitis in China (Li et al., Citation2009). The fruits that were the most common pollen-food allergens in all seasons were peach (59.0%) and apple (43.4%). The most common allergenic tree nut in PFS patients was hazelnut (14.4%, 12 in 83), especially in those patients with spring pollinosis (26.2%, 11 in 42; ).
The food-associated reactions with the highest frequency were OAS (72.3%), followed by general urticaria and/or angioedema (32.5%) and respiratory symptoms (24.1%), including rhinitis, asthma or tightness of the chest. OAS alone was the most frequent clinical manifestation (38.6%), followed by urticaria or angioedema with OAS (12%) and gastrointestinal discomfort (8.4%). Cuesta-Herranz et al. (Citation2010) and Flores et al. (Citation2012) found that a specific pollen sensitization, such as a Platanus or Artemisia species (e.g. mugwort), was associated with the development of a pollen-food allergy in Spain. However, in this study, no specific sensitization to any species of pollen was found to increase the risk of PFS development. In contrast, juniper, mugwort, and ragweed sensitization seemed to be more common in the PS group compared with the PFS group, but the prevalence of a relevant pollen allergy was not different between groups. In addition, no difference was found in the serum levels of specific IgEs against whole extracts of plant foods between the PFS and PS groups (eFigure 1). Positivity rates of peach and apple sensitization were higher in PFS group than that in PS group ((b)). IgE sensitization to allergen components, such as Bet v1, Art v 3, Gly m 4, and Pru p 3, seemed to be associated with the development of PFS (). PFS patients had a significantly higher sensitization to Bet v1, Art v 3, Pru p 3 Pru p 1 and Gly m4 [ORs (95% CIs) were 2.451 (1.044–5.754), 3.145 (1.482–6.674), 2.571 (1.218–5.427), 3.041 (1.147–8.065) and 4.1 (3.336–9.462), respectively]. In a study by Mastrorilli et al. (Citation2016), about one-fourth of the patients with PFS did not show a positive IgE response to any of the three panallergens. However, in the current study, 97.6% of PFS patients (81 in 83) were sensitized to one or more of the three panallergens, indicating a geographical difference in the sensitization patterns of PFS. Higher frequencies of peach and apple sensitization in PFS group were in accord with the higher positivity rates of rPru p 1 and rPru p 3 in the same group. The allergens identified in peach and apple belong to mainly four protein families: PR 10 proteins (Pru p 1 in peach, Mal d 1 in apple, respectively), thaumatin-like proteins (Pru p 2 in peach, Mal d 2 in apple, respectively), LTPs (Pru p 3 in peach, Mal d 3 in apple, respectively) and profilins (Pru p 4 in peach, Mal d 4 in apple, respectively). PR-10s and LTPs are the most studied clinically relevant panallergens. PR-10s and LTPs from peach and apple are highly homologous and cross-reactive (Bohle, Citation2007; Chen et al., Citation2008; Gaier et al., Citation2008; Sánchez-Monge, Lombardero, García-Sellés, Barber, & Salcedo, Citation1999).
More than two-thirds of the PFS patients showed a positive IgE response to LTPs (mainly Art v 3 and/or Pru p 3), indicating an LTP-dominant profile of PFS in our country, which is similar to that in the Mediterranean region (Andersen, Hall, & Dragsted, Citation2011; Vereda et al., Citation2011), and this observation was in accord with previous studies on sensitization patterns of food allergies in China (Gao et al., Citation2013; Ma, Nie, Li, Wang, & Yin, Citation2016; Ma, Yin, & Jiang, Citation2013). Prevalent mugwort pollinosis in late summer and autumn seems to be an important promoting factor (Gao et al., Citation2013; Ma et al., Citation2013, Citation2016; Scala et al., Citation2015). Peach was the most common food allergen in patients allergic to pollens during all seasons. A positive response to an LTP was associated with systemic reactions, while a positive response to a PR-10 protein was closely related to OAS, which is consistent with previous observations (Hauser et al., Citation2010).
Besides sensitization to whole extracts of birch and mugwort pollens, sensitization to Bet v 1 and/or Art v 3 seemed to be a risk factor for the development of PFS, supporting the idea that the cross-reactivity between pollen panallergens and their homologue allergens in plant foods is the basis of PFS development (Egger et al., Citation2006; Hauser et al., Citation2010; Jimenez-Lopez et al., Citation2012; Morales et al., Citation2014; Scheurer et al., Citation2001). However, the mechanism of PFS is rather complicated. Still many panallergen-responsive patients did not have food allergy, and anti-carbohydrate IgE antibodies may be also involved in the extensive existence of cross-reactivity between pollens and plant foods (Vieths, Mayer, & Baumgart, Citation1994). Besides, more other aspects needed to be considered. To some extent, tIgE showed a protective effect, though not strongly. This was in line with the observation of Erwin et al. (Citation2007). A higher level of tIgE seemed to be a protective factor for the development of PFS. Horimukai et al. (Citation2015) found that patients with higher tIgE levels were significantly less responsive in an oral food challenge (OFC). Gupta et al. found that the ratio of sIgE to tIgE is more accurate than sIgE alone in predicting the outcomes of challenges to confirm tolerance to select food allergens, especially to peanuts and tree nuts. The allergen sIgE to tIgE ratio for participants who failed their challenge was higher than the ratio of those who passed their challenge (1.48% failed vs. 0.49% passed; n = 195) (Gupta, Lau, Hamilton, Donnell, & Newhall, Citation2014). This was in accordance with a study by Mehl et al. (Citation2005) that showed that a higher ratio of sIgE to tIgE correlates with an increased probability of a symptomatic food allergy. It is well known that IgE-mediated reactions are initiated by the coupling of IgE receptors to IgEs that recognize different epitopes from the same allergen molecule. A higher serum concentration of tIgE means more types and higher levels of irrelevant IgEs on the surface of the same effector cell. These irrelevant IgEs may interfere with the coupling of the corresponding IgE receptors. Thus, it is easy to understand why higher sIgE and lower tIgE levels were more likely to trigger clinical reactions.
One of the biggest limitations of this study was that food allergy diagnoses were not based on OFC tests. However, PFS-associated symptoms usually promptly followed food ingestion, and the symptoms were specifically recognized by patients. In addition, a previous study showed that clinical history-based questionnaires and algorithms achieved satisfactory diagnostic sensitivity and specificity (Skypala et al., Citation2011).Thus findings in this study are convincing.
Food allergy is worrisome and difficult to predict for pollinosis sufferers. Fortunately, some sensitive and specific immunoblotting approach for the detection of IgE antibodies against both pollens and plant foods maybe helpful (Vieths, Schöning, & Baltes, Citation1992).
Supplemental Material
Download Zip (432.9 KB)Disclosure statement
No potential conflict of interest was reported by the authors.
Additional information
Funding
Related Research Data
References
- Andersen, M. B., Hall, S., & Dragsted, L. O. (2011). Identification of European allergy patterns to the allergen families PR-10, LTP, and profilin from Rosaceae fruits. Clinical Reviews in Allergy & Immunology, 41, 4–19. doi: https://doi.org/10.1007/s12016-009-8177-3
- Asero, R., Antonicelli, L., Arena, A., Bommarito, L., Caruso, B., Crivellaro, M., … Senna, G. E. (2009). EpidemAAITO: Features of food allergy in Italian adults attending allergy clinics: A multi-centre study. Clinical & Experimental Allergy, 39, 547–555. doi: https://doi.org/10.1111/j.1365-2222.2008.03167.x
- Beyer, S., Franke, A., Simon, J. C., & Treudler, R. (2016). Measurement of health-related quality of life in adult patients with birch pollen-associated food allergy. Journal der Deutschen Dermatologischen Gesellschaft, 14, 397–404.
- Bohle, B. (2007). The impact of pollen-related food allergens on pollen allergy. Allergy, 62(1), 3–10. doi: https://doi.org/10.1111/j.1398-9995.2006.01258.x
- Burney, P. G., Potts, J., Kummeling, I., Mills, E. N., Clausen, M., Dubakiene, R., … van Ree, R. (2014). The prevalence and distribution of food sensitization in European adults. Allergy, 69, 365–371. doi: https://doi.org/10.1111/all.12341
- Burr, M. L., & Merrett, T. G. (1983). Food intolerance: A community survey. British Journal of Nutrition, 49, 217–219. doi: https://doi.org/10.1079/BJN19830028
- Chen, L., Zhang, S., Illa, E., Song, L., Wu, S., Howad, W., … Gao, Z. (2008). Genomic characterization of putative allergen genes in peach/almond and their synteny with apple. BMC Genomics, 9, 543. doi: https://doi.org/10.1186/1471-2164-9-543
- Cuesta-Herranz, J., Barber, D., Blanco, C., Cistero-Bahima, A., Crespo, J. F., Fernández-Rivas, M., … Tabar, A. I. (2010). Differences among pollen-allergic patients with and without plant food allergy. International Archives of Allergy and Immunology, 153, 182–192. doi: https://doi.org/10.1159/000312636
- Egger, M., Mutschlechner, S., Wopfner, N., Gadermaier, G., Briza, P., & Ferreira, F. (2006). Pollen-food syndromes associated with weed pollinosis: An update from the molecular point of view. Allergy, 61, 461–476. doi: https://doi.org/10.1111/j.1398-9995.2006.00994.x
- Erwin, E. A., Rönmark, E., Wickens, K., Perzanowski, M. S., Barry, D., Lundbäck, B., … Platts-Mills, T. A. E. (2007). Contribution of dust mite and cat specific IgE to total IgE: Relevance to asthma prevalence. Journal of Allergy and Clinical Immunology, 119, 359–365. doi: https://doi.org/10.1016/j.jaci.2006.12.648
- Flores, E., Cervera, L., Sanz, M. L., Diaz-Perales, A., & Fernández, J. (2012). Plant food allergy in patients with pollinosis from the Mediterranean area. International Archives of Allergy and Immunology, 159, 346–354. doi: https://doi.org/10.1159/000338282
- Gaier, S., Marsh, J., Oberhuber, C., Rigby, N. M., Lovegrove, A., Alessandri, S., … Shewry, P. R. (2008). Purification and structural stability of the peach allergens Pru p 1 and Pru p 3. Mol Nutr Food Res, 52(Suppl 2), S220–S229.
- Gao, Z. S., Yang, Z. W., Wu, S. D., Wang, H. Y., Liu, M. L., Mao, W. L., … van Ree, R. (2013). Peach allergy in China: A dominant role for mugwort pollen lipid transfer protein as a primary sensitizer. Journal of Allergy and Clinical Immunology, 131, 224–226.e3. doi: https://doi.org/10.1016/j.jaci.2012.07.015
- Geroldinger-Simic, M., Zelniker, T., Aberer, W., Ebner, C., Egger, C., Greiderer, A., … Bohle, B. (2011). Birch pollen-related food allergy: Clinical aspects and the role of allergen-specific IgE and IgG4 antibodies. Journal of Allergy and Clinical Immunology, 127, 616–622.e1. doi: https://doi.org/10.1016/j.jaci.2010.10.027
- Gupta, R. S., Lau, C. H., Hamilton, R. G., Donnell, A., & Newhall, K. K. (2014). Predicting outcomes of oral food challenges by using the allergen-specific IgE-total IgE ratio. The Journal of Allergy and Clinical Immunology: In Practice, 2, 300–305. doi: https://doi.org/10.1016/j.jaip.2013.12.006
- Hauser, M., Roulias, A., Ferreira, F., & Egger, M. (2010). Panallergens and their impact on the allergic patient. Allergy, Asthma & Clinical Immunology, 6, 1. doi: https://doi.org/10.1186/1710-1492-6-1
- Horimukai, K., Hayashi, K., Tsumura, Y., Nomura, I., Narita, M., Ohya, Y., … Matsumoto, K. (2015). Total serum IgE level influences oral food challenge tests for IgE-mediated food allergies. Allergy, 70, 334–337. doi: https://doi.org/10.1111/all.12562
- Jensen-Jarolim, E., & Untersmayr, E. (2008). Gender-medicine aspects in allergology. Allergy, 63, 610–615. doi: https://doi.org/10.1111/j.1398-9995.2008.01645.x
- Jimenez-Lopez, J. C., Gachomo, E. W., Ariyo, O. A., Baba-Moussa, L., & Kotchoni, S. O. (2012). Specific conformational epitope features of pathogenesis-related proteins mediating cross-reactivity between pollen and food allergens. Molecular Biology Reports, 39, 123–130. doi: https://doi.org/10.1007/s11033-011-0717-2
- Li, J., Huang, Y., Lin, X., Zhao, D., Tan, G., Wu, J., … Zhong, N. (2012). Factors associated with allergen sensitizations in patients with asthma and/or rhinitis in China. American Journal of Rhinology and Allergy, 26, 85–91. doi: https://doi.org/10.2500/ajra.2012.26.3751
- Li, J., Sun, B., Huang, Y., Lin, X., Zhao, D., Tan, G., … Zhong, N. (2009). A multicentre study assessing the prevalence of sensitizations in patients with asthma and/or rhinitis in China. Allergy, 64, 1083–1092. doi: https://doi.org/10.1111/j.1398-9995.2009.01967.x
- Ludman, S., Jafari-Mamaghani, M., Ebling, R., Fox, A. T., Lack, G., & Du Toit, G. (2016). Pollen food syndrome amongst children with seasonal allergic rhinitis attending allergy clinic. Pediatric Allergy and Immunology, 27, 134–140. doi: https://doi.org/10.1111/pai.12504
- Ma, S., Nie, L., Li, H., Wang, R., & Yin, J. (2016). Component-resolved diagnosis of peanut allergy and its possible origins of sensitization in China. International Archives of Allergy and Immunology, 169, 241–248. doi: https://doi.org/10.1159/000446156
- Ma, S., Sicherer, S. H., & Nowak-Wegrzyn, A. (2003). A survey on the management of pollen-food allergy syndrome in allergy practices. Journal of Allergy and Clinical Immunology, 112, 784–788. doi: https://doi.org/10.1016/S0091-6749(03)02008-6
- Ma, S., Yin, J., & Jiang, N. (2013). Component-resolved diagnosis of peach allergy and its relationship with prevalent allergenic pollens in China. Journal of Allergy and Clinical Immunology, 132, 764–767. doi: https://doi.org/10.1016/j.jaci.2013.04.017
- Maeda, N., Inomata, N., Morita, A., Kirino, M., & Ikezawa, Z. (2010). Correlation of oral allergy syndrome due to plant-derived foods with pollen sensitization in Japan. Annals of Allergy, Asthma & Immunology, 104, 205–210. doi: https://doi.org/10.1016/j.anai.2009.11.049
- Mahdavinia, M., Bishehsari, F., Hayat, W., Elhassan, A., Tobin, M. C., & Ditto, A. M. (2017). Association of eosinophilic esophagitis and food pollen allergy syndrome. Annals of Allergy, Asthma & Immunology, 118, 116–117. doi: https://doi.org/10.1016/j.anai.2016.10.012
- Mastrorilli, C., Tripodi, S., Caffarelli, C., Perna, S., Di Rienzo-Businco, A., Sfika, I., … Matricardi, P. M. (2016). Endotypes of pollen-food syndrome in children with seasonal allergic rhinoconjunctivitis: A molecular classification. Allergy, 71, 1181–1191. doi: https://doi.org/10.1111/all.12888
- Mehl, A., Verstege, A., Staden, U., Kulig, M., Nocon, M., Beyer, K., Niggemann, B. (2005). Utility of the ratio of food-specific IgE/total IgE in predicting symptomatic food allergy in children. Allergy, 60, 1034–1039. doi: https://doi.org/10.1111/j.1398-9995.2005.00806.x
- Morales, M., López-Matas, M. A., Moya, R., & Carnés, J. (2014). Cross-reactivity among non-specific lipid-transfer proteins from food and pollen allergenic sources. Food Chemistry, 165, 397–402. doi: https://doi.org/10.1016/j.foodchem.2014.05.101
- Niestijl Jansen, J. J., Kardinaal, A. F., Huijbers, G., Vlieg-Boerstra, B. J., Martens, B. P., & Ockhuizen, T. (1994). Prevalence of food allergy and intolerance in the adult Dutch population. Journal of Allergy and Clinical Immunology, 93, 446–456. doi: https://doi.org/10.1016/0091-6749(94)90353-0
- Platts-Mills, T. A. E. (2015). The allergy epidemics: 1870–2010. Journal of Allergy and Clinical Immunology, 136(1), 3–13. doi: https://doi.org/10.1016/j.jaci.2015.03.048
- Salo, P. M., Arbes, S. J., Jaramillo, R., Calatroni, A., Weir, C. H., Sever, M. L., … Zeldin, D. C. (2014). Prevalence of allergic sensitization in the United States: Results from the National Health and Nutrition Examination Survey (NHANES) 2005–2006. Journal of Allergy and Clinical Immunology, 134(2), 350–359. doi: https://doi.org/10.1016/j.jaci.2013.12.1071
- Sánchez-Monge, R., Lombardero, M., García-Sellés, F. J., Barber, D., & Salcedo, G. (1999). Lipid-transfer proteins are relevant allergens in fruit allergy. Journal of Allergy and Clinical Immunology, 103(3 Pt 1), 514–519. doi: https://doi.org/10.1016/S0091-6749(99)70479-3
- Scala, E., Till, S. J., Asero, R., Abeni, D., Guerra, E. C., Pirrotta, L., … Cecchi, L. (2015). Lipid transfer protein sensitization: Reactivity profiles and clinical risk assessment in an Italian cohort. Allergy, 70, 933–943. doi: https://doi.org/10.1111/all.12635
- Schäfer, T., Böhler, E., Ruhdorfer, S., Weigl, L., Wessner, D., Heinrich, J., … Ring, J. (2001). Epidemiology of food allergy/food intolerance in adults: Associations with other manifestations of atopy. Allergy, 56, 1172–1179. doi: https://doi.org/10.1034/j.1398-9995.2001.00196.x
- Scheurer, S., Wangorsch, A., Nerkamp, J., Skov, P. S., Ballmer-Weber, B., Wüthrich, B., … Vieths, S. (2001). Cross-reactivity within the profilin panallergen family investigated by comparision of recombinant profilins from pear (Pyr c 4), cherry (Pru av 4) and celery (Api g 4) with birch pollen profilin Bet v 2. Journal of Chromatography B: Biomedical Sciences and Applications, 756, 315–325. doi: https://doi.org/10.1016/S0378-4347(01)00090-1
- Skypala, I. J., Calderon, M. A., Leeds, A. R., Emery, P., Till, S. J., & Durham, S. R. (2011). Development and validation of a structured questionnaire for the diagnosis of oral allergy syndrome in subjects with seasonal allergic rhinitis during the UK birch pollen season. Clinical & Experimental Allergy, 41, 1001–1011. doi: https://doi.org/10.1111/j.1365-2222.2011.03759.x
- Vereda, A., van Hage, M., Ahlstedt, S., Ibañez, M. D., Cuesta-Herranz, J., van Odijk, J., … Sampson, H. A. (2011). Peanut allergy: Clinical and immunologic differences among patients from 3 different geographic regions. Journal of Allergy and Clinical Immunology, 127, 603–607. doi: https://doi.org/10.1016/j.jaci.2010.09.010
- Vieths, S., Mayer, M., & Baumgart, M. (1994). Food allergy: Specific binding of IgE antibodies from plant food sensitized individuals to carbohydrate epitopes. Food and Agricultural Immunology, 6, 453–463. doi: https://doi.org/10.1080/09540109409354857
- Vieths, S., Schöning, B., & Baltes, W. (1992). Allergy to fruits and vegetables in pollen-sensitive patients: Allergen characterization by IgE immunoblotting and peroxidase staining. Food and Agricultural Immunology, 4, 181–197. doi: https://doi.org/10.1080/09540109209354767
- Webb, L. M., & Lieberman, P. (2006). Anaphylaxis: A review of 601 cases. Annals of Allergy, Asthma & Immunology, 97, 39–43. doi: https://doi.org/10.1016/S1081-1206(10)61367-1
- Webber, C. M., & England, R. W. (2010). Oral allergy syndrome: A clinical, diagnostic, and therapeutic challenge. Annals of Allergy, Asthma & Immunology, 104, 101–108, 109–110, 117. doi: https://doi.org/10.1016/j.anai.2009.11.007
- Ye, S., Zhang, J., & Qiao, B. (1988). Investigation of aeroborne allergenic pollens in different regions of China (1st ed.). Beijing: Science Publishing House.