
ABSTRACT
In this paper, we describe the development of a rapid, simple, specific, and sensitive immunochromatographic strip test based on an antibody–antigen reaction for detection of tulathromycin (TULA) in samples of 0.01 M PBS pH 7.4, pure milk and honey. The monoclonal antibodies specifically recognized the corresponding antigens produced in our laboratory. Under optimized conditions, the cut-off limits of the test strips for TULA in 0.01 M PBS pH 7.4 was found to be 2.5 ng/mL. Meanwhile, with simple preparation for detection in pure milk and honey samples, the cut-off limits for TULA were found to be 5 and 10 ng/mL, respectively. Each test can be evaluated in 5 min. In summary, this lateral-flow device provides a sensitive, effective, specific, and rapid method for detection of TULA residues in food matrix.
Introduction
Tulathromycin (C41H79N3O12, M: 806.08 g/mol; TULA) (), is a novel member of the triamilide subclass of macrolide antibiotics, which is used for the treatment of bacterial respiratory diseases of cattle and swine. When administered to pigs or cattle by subcutaneous or intramuscular injection, it is effective against Actinobacillus pleuropneumoniae, Pasteurella multocida, and Mycoplasma hyopneumoniae (Gajda, Posyniak, & Bladek, Citation2013; Villarino et al., Citation2013). TULA has been used for treatment of abscessing pneumonia of fouls caused by Rhodococcus equi (Scheuch, Spieker, Venner, & Siegmund, Citation2007).
Figure 1. Chemical structure of tulathromycin.

A single dose of TULA demonstrates high clinical effectiveness after intramuscular injection. TULA is rapidly absorbed from the injection site with great bioavailability and a long elimination half-life of 4–6 days. Compared with others macrolide antibiotics (erythromycin, tylosin, etc.), TULA is widely used in veterinary medicine, its modified structure provides improved pharmacokinetic properties, as well as minimizing the frequency of administration (Benchaoui, Nowakowski, Sherington, Rowan, & Sunderland, Citation2004; Charles & Segreti, Citation1997). Typically repeated administration of TULA over several days is required to achieve therapeutic or preventative efficacy. Pro-longed exposure of lung tissues to macrolides are important for the treatment and prevention of bovine respiratory disease. However the incorrect use of TULA may leave residues in edible tissues, milk, and honey, and resulting in undesirable effects on consumer health such as the onset of allergies in individuals with hypersensitivity and the appearance of antibiotic-resistant bacteria (Hoogenboom et al., Citation2008; Hurd, Citation2004).
In order to monitor antibiotics residues more efficiently, it is essential to develop an easy and sensitive analytical method capable of simultaneous detection of various antibiotic residues in different food matrices. Analytical methods, including high-performance liquid chromatography (HPLC) (Gáler et al., Citation2004; Huang et al., Citation2012) and liquid chromatography-tandem mass spectrometry (LC–MS/MS) (Berrada, Borrull, Font, & Marcé, Citation2008; Fedeniuk et al., Citation2015; Hu et al., Citation2014; Scheuch et al., Citation2007) have already been used for the environmental analysis of TULA. HPLC methods have been routinely used for screening purposes but have disadvantages insofar as the method is complex, time consuming, and labour intensive (Liu, Suryoprabowo, Zheng, Song, & Kuang, Citation2017). LC–MS is a powerful qualitative tool; however, it requires skilled operators and its high cost limits the application (Isanga et al., Citation2017b; Khaemba et al., Citation2016; Peng, Liu, Kuang, Cui, & Xu, Citation2017).
In contrast, lateral-flow immunochromatographic strips allow the semi-quantitative analysis of various drug residues and have become increasingly popular because they are simple, rapid, specific, and sensitive. Lateral-flow immunochromatographic assays have the advantages that all the reagents are included in the strip and the results can be obtained within 5–10 min (Chen et al., Citation2017; Gu, Liu, Song, Kuang, & Xu, Citation2016; Isanga et al., Citation2017a; Liu et al., Citation2014). No immunochromatographic lateral-flow test device for detection of TULA residues has been previously reported. Therefore, the aim of the current study was to develop an immunochromatographic lateral-flow test strip for detection of TULA in milk and honey.
Materials and methods
Chemicals and reagents
TULA was purchased from J&K Scientific (Shanghai, China). Freund’s Complete adjuvant (FCA), Freund’s incomplete adjuvant (FIA), and enzyme immunoassay-grade horseradish peroxidase-labeled goat anti-mouse immunoglobulin were obtained from Sigma (St. Louis, MO, USA). N,N″-carbonyldiimidazolen (CDI) was acquired from East China Chemicals Co., Ltd. (Wuxi, China). Gelatin was supplied by Beijing Biodee Biotechnology Co., Ltd. (Beijing, China). Tetramethylbenzidine and horseradish peroxidase were acquired from Aladdin Chemistry Co., Ltd. (Shanghai, China). All reagents used for cell fusion were from Sunshine Biotechnology Co., Ltd. (Nanjing, China). Bovine serum albumin (BSA) was obtained from Solarbio Science & Technology, Co., Ltd. (Beijing, China). Succinic anhydride (SA) was purchased from J&K Scientific (Shanghai, China). All other reagent and chemicals were supplied by the National Pharmaceutical Group Chemical Reagent Co., Ltd. (Shanghai, China).
Nitrocellulose (NC) high-flow plus membranes (Pura-bind RP) were obtained from Whatman-Xinhua Filter Paper Co., Ltd. (Hangzhou, China). Glass fibre membrane (CB-SB08) used for the sample pad, polyvinylchloride (PVC) backing material and absorbance pad (SX18) were supplied by Goldbio Tech Co., Ltd. (Shanghai, China). A BioDot TSR 3000 Membrane Strip Reader (Gene Company Limited, Shanghai Branch, Shanghai, China) was used to test the colour intensities of colloidal gold on the test zone. The conjugated coating antigens (TULA-CDI-BSA) and specific monoclonal antibodies (anti-TULA mAb, No. 3B8) were generated in our laboratory.
All buffer solutions were prepared using ultrapure water (Milli-Q purification system, Millipore Co., Bedford, MA, USA). The strip cutting instrument was a CM 4000 (Gene, Shanghai, China). The Airjet Quanti 3000™ and Biojet Quanti 3000™ (XinqidianGene-technology Co., Ltd., Beijing, China) were used as dispensers.
Preparation and characterization of monoclonal anti-TULA antibody
TULA was conjugated to BSA using the CDI method (Cao et al., Citation2015; Shan, Stoutamire, Wengatz, Gee, & Hammock, Citation1999) for coating antigens. TULA (9.62 mg) mixed with BSA at a ratio of 40:1 was dissolved in 2 mL of acetone with CDI (4 mg), and the mixture was stirred at room temperature for 3 h to form an activated amide intermediate. The reaction mixture was then vacuum-dried, and the yellow powder was dissolved in 2 mL of anhydrous N,N-dimethylformamide (DMF). This solution was added dropwise to 20 mg of BSA carrier protein dissolved in 4 mL of carbonate buffer (0.05 M, pH 9.5). After stirring for 5 h at room temperature, the conjugated TULA-CDI-BSA was dialysed against 0.025 M carbon buffer for 3 days at room temperature, and then stored at −20°C until use.
Female BALB/c mice (6–8 weeks old) were used to produce the monoclonal antibody (mAb). The mice were immunized subcutaneously with a TULA-SA-BSA conjugate. TULA (9.62 mg) and SA (4 mg) were dissolved in 2 mL pyridine and gently stirred for 2 h at room temperature. After evaporating the pyridine, the residue was dissolved in 2 mL of DMF. 1-Ethyl-3-(3-dimethylaminopropyl) carbodiimide (EDC) (8 mg) and N-hydroxy succinimide (4.8 mg) were added. The mixture was gently stirred for 4 h at room temperature then added dropwise to 20 mg BSA dissolved in 4 mL of carbonate buffer (0.05 M, pH 9.5). After stirring for 5 h at room temperature, the conjugated TULA-SA-BSA was dialysed against 0.025 M carbon buffer for 3 days at room temperature and stored at −20°C until use.
The first immunization used FCA and FIA was used in the subsequent booster injections. The mice were immunized every 3 weeks with 100 µg for the first immunization and 50 µg for subsequent injections (2–5 times). The antibodies in the blood samples from immunized mice were measured by ELISA and the mouse with the highest titre was sacrified and its splenocytes were fused with Sp 2/0 murine myeloma cells. The resulting hybridomas were then screened with an indirect ELISA. The selected hybridoma cells were expanded and injected into BALB/c mice to produce the mAb. The ascites was harvested and purified by the caprylic acid-ammonium sulphate precipitation method (Chen et al., Citation2014). The purified antibody solution was stored at −20°C until further use.
Development of the lateral-flow test device
Preparation of colloidal gold particles
All the solvents were prepared with ultrapure water then filtered through a transfer membrane (0.22 µm). Chlorauric acid (25 mL of a 0.1 g/L solution) was heated to boiling under constant stirring, and then 1% w/v sodium citrate tribasic dihydrate solution (1.0 mL) was added. The mixture was stirred for 30 min until the colour of the solution turned wine-red, then cooled to room temperature, and stored at 4°C. Transmission electron microscopy analysis showed that the gold nanoparticles had a nearly uniform particle size of 15 nm.
Preparation of colloidal gold-labelled mAb
The anti-TULA mAb (no. 3B8) with half-maximal inhibitory concentration (IC50) of 0.79 ng/mL was used. Colloidal gold solution (10 mL) was adjusted pH 7.0 with 0.1 M K2CO3 (40 µL). Briefly, the mAb (0.40 mL) was added to the solution dropwise, and 35 min later, 10% (w/v) BSA (1 mL) was added, and the mixture was stirred for 2 h. The product was centrifuged for 45 min at 8000 rpm to remove the gold aggregates. The solution separated into two layers, the lower layer (red gold-labelled mAb) was collected and washed with 0.02 M phosphate buffer containing 5% sucrose, 1% BSA, and 0.5% polyethylene glycol (PEG) 6000, pH 7.4. The conjugation products were reconstituted to 1 mL in gold-labeling resuspension buffer (0.02 M PBS, 5% sucrose, 2% sorbitol, 1% mannitol, 0.1% PEG, 0.1% tween, and 0.04% NaN3) and stored at 4°C until use.
Preparation of NC capture membranes
The coating antigen (TULA-CDI-BSA) (Test line) and goat anti-mouse IgG antibody (Control line) were used as the capture reagent on the test strip. The antigen and goat anti-mouse IgG coatings were sprayed onto the NC membrane at 1 µL/cm using a dispenser to produce the test line and a control line on the strip. The capture and control reagents were sprayed onto the glass fibre membrane to prepare the conjugate pad, which was dried at 37°C overnight. The NC membrane coated with capture reagents was pasted onto the centre of the PVC backing plate and the conjugate pad, sample pad, and absorbent pad were laminated and pasted onto the backing plate. Finally the plate was cut into 2.8 mm wide strips with a strip cutter.
Test procedure and principle
To perform the test, 50 µL of gold-labelled mAb is first mixed with 150 µL of sample solution, allowed it to react for about 5 min, than added to the sample pad. The solution migrates to the absorbent pad, and test results are obtained within 5 min. If TULA is present in the sample, it competes with the TULA-CDI-BSA conjugates embedded in the test line for the finite amount of anti-TULA mAb. When a sufficient amount of TULA is present, the free TULA binds with all the labelled mAb, preventing the mAb binding to the TULA-CDI-BSA in the test line. Therefore, the more TULA that is present, the weaker colour of the test line will appear. If no TULA present, the limited amount of colloidal gold-labelled mAb is trapped by the immobilized TULA-CDI-BSA conjugate, and a clearly visible red test line appears.
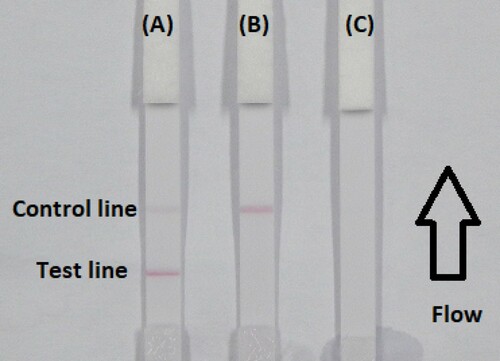
The fluid must reach the control line, which contains goat anti-mouse IgG antibody, and also produces an indicator reaction. Therefore, the control line must always appear in a successful test, whereas the test line will only appear when the sample is negative ((A)). The appearance of the control line alone is a positive result ((B)), whereas if neither the control line nor the test line appear ((C)), the test procedure is incorrect or the strip is invalid, indicating that the test should be repeated with a new strip.
Figure 2. Illustration of typical strip test results. If the sample is negative (A), a positive result could be indicated only if the control line appears (B), and if the control and test line does not appears (invalid) (C).
Determination of performance
Sensitivity of the test strip
The sensitivity of the test strip was determined by testing TULA samples. The TULA standard solution was diluted to concentrations of 0, 0.1, 0.25, 0.5, 1, and 2.5 ng/mL in 0.01 M PBS (pH 7.4) and the detection limit was determined. The sample solution (150 µL) was mixed with 50 µL gold-labelled mAb, allowed to react for 5 min and added to the sample pad. After 5 min, the test strip reader recorded the colour intensities of the different strips. The lowest detection limit (LDL) with the naked eye was defined as the amount of TULA that produced a colour reaction on the strip that clearly visibly differed in intensity from the result of 0 ng/mL TULA. Six replicate samples of each concentration were analysed on the same day.
Detection of TULA in milk and honey samples
The detection of TULA in milk and honey samples was assessed using milk and honey bought in the local market. A simple pre-treatment was used, adding undiluted milk and diluted (fourfold) honey in extraction buffer. The extraction buffer consisted of PBS with 1.6% NaCl (pH 7.4). The samples to be analysed were spiked with the TULA standard solution (10 µg/mL, prepared with 0.01 M PBS, pH 7.4). The TULA concentrations in milk were 0.1, 0.25, 0.5, 1, 2.5, and 5 ng/mL and in honey samples were 0.1, 0.25, 0.5, 1, and 2.5 ng/mL. An un-spiked (blank) sample was used as the control. Six replicates of each concentration were analysed using the test strips.
Results and discussion
Optimization of the strip test
In order to function as the reaction matrix in an immunochromatographic assay, the strip materials must be hydrophilic and have consistent flow characteristics. NC, used as a base material, is hydrophobic and is made hydrophilic during the membrane production process by the addition of rewetting agents. These rewetting agents are surfactants, the type and amount of which can affect the performance of the assay initially and over time. Not every protein is compatible with every surfactant. This is one reason for screening multiple membrane types during development. Many factors affect the binding process and these must be considered when developing assays and processing NC membranes. Some of these factors are: (1) reagent choices: non-specific proteins such as bulking proteins (BSA, casein) compete for binding sites, materials that interfere with hydrophobic interactions (tween and triton), and polymers such as polyvinyl acetate, polyvinylpyrrolidone (PVP), and PEG and (2) environment humidity should be optimized for binding (25–50% relative humidity at room temperature).
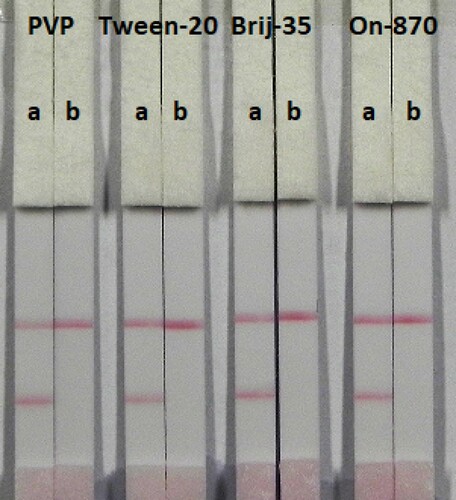
In this study, suspension buffer (0.02 M PBS, 5% sucrose, 2% sorbitol, 1% mannitol, 0.1% PEG, 0.1% tween, and 0.04% NaN3) was added to 13 reagents PVP, PEG, polyvinyl alcohol (PVA) BSA, casein, sucrose, trehalose, sorbitol, mannitol, tween-20, brij-35, triton X-100, and Rhodasurf® On-870 (an ethoxylated oleyl alcohol). As shown in , the reagents PVP, tween-20, brij-35, and On-870 produced the best and most stable colour reactions, and were used for subsequent experiments. Based on these four reagents (), the signal colour on the test line using brij-35 as the reagent produced the best colour reaction and was chosen for further experiments.
Figure 3. Result of using 14 kinds of reagent. 1 = suspension buffer, 2 = PVP, 3 = PEG, 4 = PVA, 5 = BSA, 6 = Casein, 7 = Sucrose, 8 = Trehalose, 9 = Sorbitol, 10 = Mannitol, 11 = tween-20, 12 = Brij-35, 13 = Triton X-100, and 14 = On-870. a = negative (0 ng/mL). b = positive (25 ng/mL).
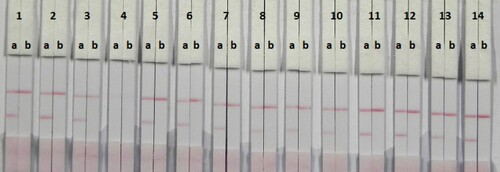
Figure 4. Colloidal gold immunocromatography for TULA using 4 kinds of reagent. a = negative (0 ng/mL). b = positive (5 ng/mL).
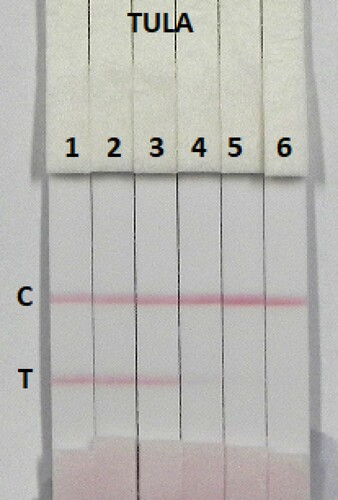
The sensitivity of the assay was investigated with a series of TULA standards diluted in 0.01 M PBS (pH 7.4). The LDL with the naked eye was obtained at the amount of TULA producing a significant difference in colour intensity of the test strip in comparison with negative control (no TULA added). shows that the signal colour on the test lines changed from strong (0 ng/mL) to weak and finally disappeared completely at 2.5 ng/mL TULA.
Figure 5. Colloidal gold immunochromatography assay for TULA in 0.01 M PBS (pH 7.4). TULA concentration: 1 = 0 ng/mL; 2 = 0.1 ng/mL; 3 = 0.25 ng/mL; 4 = 0.5 ng/mL; 5 = 1 ng/mL; and 6 = 2.5 ng/mL. TULA, tulathromycin; C, control line; T, test line.
Detection of TULA in milk and honey samples
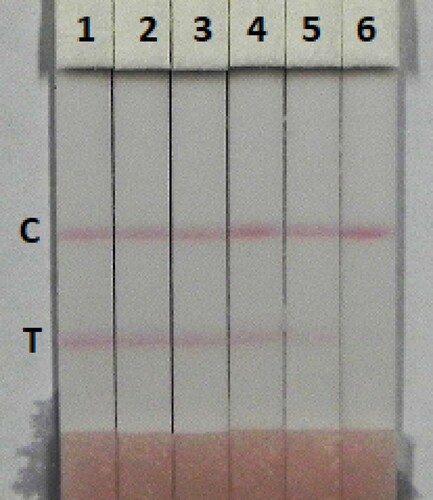
The immunochromatographic assay is simple and rapid. Milk was spiked with TULA in 0.01 M PBS pH 7.4 (10 µg/mL), at final concentration of TULA in pure milk of 0.1, 0.25, 0.5, 1, 2.5, and 5 ng/mL and was directly detected (). The signal colour changed from strong to weak, a distinct change in the test line could be observed in 2.5 ng/mL of TULA and disappeared completely at 5 ng/mL. Honey is complex food matrix, which offers disadvantages for the strip test. Therefore, honey was diluted fourfold with extraction buffer (0.01 M PBS pH 7.4) and then spiked with different amounts of TULA (0.1, 0.25, 0.5, 1, and 2.5 ng/mL) (). The test line disappeared with 2.5 ng/mL of TULA in fourfold diluted honey. The lower detection limits were 2.5 ng/mL of TULA in milk and 4 ng/mL of TULA in honey, and the cut-off values were 5 ng/mL of TULA in milk and 10 ng/mL of TULA in honey.
Figure 6. Determination of TULA with immunocromatography strip test spiked in pure milk sample. TULA concentration: 1 = 0 ng/mL; 2 = 0.1 ng/mL; 3 = 0.25 ng/mL; 4 = 0.5 ng/mL; 5 = 1 ng/mL; 6 = 2.5 ng/mL; and 7 = 5 ng/mL. C, control line; T, test line.
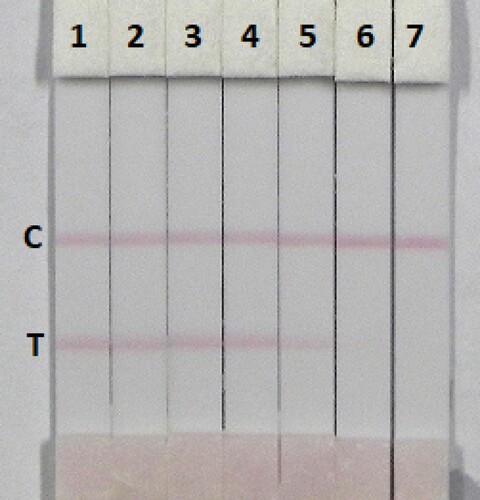
Figure 7. Determination of TULA with immunocromatography strip test spiked in honey. TULA concentration: 1 = 0 ng/mL; 2 = 0.1 ng/mL; 3 = 0.25 ng/mL; 4 = 0.5 ng/mL; 5 = 1 ng/mL; and 6 = 2.5 ng/mL. C, control line; T, test line.
Conclusion
In this study, an immunochromatographic strip test was developed as a sensitive, simple, and rapid analytical method for detection of TULA in pure milk and honey samples. Under optimized conditions, the results demonstrated that the cut-off limits of the semi-quantitative test strip for TULA can be as low as 2.5 ng/mL in 0.01 M PBS pH 7.4, 5 ng/mL in milk, and 10 ng/mL in honey. The TULA strip test can be completed within 5 min in only one step and with an easy procedure and simple equipment.
Disclosure statement
No potential conflict of interest was reported by the authors.
Additional information
Funding
Related Research Data
References
- Benchaoui, H. A., Nowakowski, M., Sherington, J., Rowan, T. G., & Sunderland, S. J. (2004). Pharmacokinetics and lung tissue concentrations of tulathromycin in swine. Journal of Veterinary Pharmacology and Therapeutics, 27(4), 203–210. doi: https://doi.org/10.1111/j.1365-2885.2004.00586.x
- Berrada, H., Borrull, F., Font, G., & Marcé, R. M. (2008). Determination of macrolide antibiotics in meat and fish using pressurized liquid extraction and liquid chromatography-mass spectrometry. Journal of Chromatography A, 1208(1-2), 83–89. doi: https://doi.org/10.1016/j.chroma.2008.08.107
- Cao, S., Song, S., Liu, L., Kong, N., Kuang, H., & Xu, C. (2015). Comparison of an enzyme-linked immunosorbent assay with an immunochromatographic assay for detection of lincomycin in milk and honey. Immunological Investigations, 44(5), 438–450. doi: https://doi.org/10.3109/08820139.2015.1021354
- Charles, L., & Segreti, J. (1997). Choosing the right macrolide antibiotic – A guide to selection. Drugs, 53(3), 349–357. doi: https://doi.org/10.2165/00003495-199753030-00002
- Chen, Y., Liu, L., Xu, L., Song, S., Kuang, H., Cui, G., & Xu, C. (2017). Gold immunochromatographic sensor for the rapid detection of twenty-six sulfonamides in foods. Nano Research, 10(8), 2833–2844. doi: https://doi.org/10.1007/s12274-017-1490-x
- Chen, X., Xu, L., Ma, W., Liu, L., Kuang, H., Wang, L., & Xu, C. (2014). General immunoassay for pyrethroids based on a monoclonal antibody. Food and Agricultural Immunology, 25(3), 341–349. doi: https://doi.org/10.1080/09540105.2013.794328
- Fedeniuk, R. W., McKenzie, D., Mizuno, M., Neiser, C., O’Byrne, C., & Shurmer, B. (2015). Development and validation of determinative and confirmatory LC-MS/MS methodologies for total florfenicol and tulathromycin residues in bovine, equine and porcine kidney, liver and muscle tissues. Journal of Chromatography B, 983-984, 1–9. doi: https://doi.org/10.1016/j.jchromb.2014.12.035
- Gajda, A., Posyniak, A., & Bladek, T. (2013). Analytical procedure for the determination of tulathromycin in swine plasma. Bulletin of the Veterinary Institute in Pulawy, 57(2), 191–195. doi: https://doi.org/10.2478/bvip-2013-0035
- Gáler, D., Hessong, S., Beato, B., Risk, J., Inskeep, P., Weerasinghe, C., … Nowakowski, M. A. (2004). An analytical method for the analysis of tulathromycin, an equilibrating triamilide, in bovine and porcine plasma and lung. Journal of Agricultural and Food Chemistry, 52(8), 2179–2191. doi: https://doi.org/10.1021/jf0351624
- Gu, H., Liu, L., Song, S., Kuang, H., & Xu, C. (2016). Development of an immunochromatographic strip assay for ractopamine detection using an ultrasensitive monoclonal antibody. Food and Agricultural Immunology, 27(4), 471–483. doi: https://doi.org/10.1080/09540105.2015.1126808
- Hoogenboom, L. A. P., Bokhorst, J. G., Northolt, M. D., de Vijver, L. P. L. v., Broex, N. J. G., Mevius, D. J., … Van der Roest, J. (2008). Contaminants and microorganisms in Dutch organic food products: A comparison with conventional products. Food Additives and Contaminants Part A-Chemistry Analysis Control Exposure & Risk Assessment, 25(10), 1195–1207.
- Hu, F.-Y., He, L.-M., Yang, J.-W., Bian, K., Wang, Z.-N., Yang, H.-C., & Liu, Y.-H. (2014). Determination of 26 veterinary antibiotics residues in water matrices by lyophilization in combination with LC-MS/MS. Journal of Chromatography B-Analytical Technologies in the Biomedical and Life Sciences, 949, 79–86. doi: https://doi.org/10.1016/j.jchromb.2014.01.008
- Huang, X.-h., Zhao, Y.-d., He, L.-m., Liang, Z.-s., Guo, L.-l., Zeng, Z.-l., … Fang, B.-h. (2012). Development of high performance liquid chromatography-tandem mass spectrometry method for the detection of tulathromycin in swine plasma. Journal of Integrative Agriculture, 11(3), 465–473. doi: https://doi.org/10.1016/S2095-3119(12)60032-X
- Hurd, H. S. (2004). “Public health consequences of macrolide use in food animals: A deterministic risk assessment,” – A comment on: J. Food Prot. 67(5): 980–992 (2004) – Response. Journal of Food Protection, 67(11), 2370–2374. doi: https://doi.org/10.4315/0362-028X-67.11.2370
- Isanga, J., Mukunzi, D., Chen, Y., Suryoprabowo, S., Liu, L., & Kuang, H. (2017a). Development of a monoclonal antibody assay and immunochromatographic test strip for the detection of amikacin residues in milk and eggs. Food and Agricultural Immunology, 28(4), 668–684. doi: https://doi.org/10.1080/09540105.2017.1309361
- Isanga, J., Mukunzi, D., Chen, Y., Suryoprabowo, S., Liu, L., Kuang, H., & Xu, C. (2017b). Development of a monoclonal antibody assay and a lateral flow strip test for the detection of paromomycin residues in food matrices. Food and Agricultural Immunology, 28(3), 355–373. doi: https://doi.org/10.1080/09540105.2016.1272551
- Khaemba, G. W., Tochi, B. N., Mukunzi, D., Joel, I., Guo, L., Suryobrobowo, S., … Xu, C. (2016). Development of monoclonal antibody and lateral test strip for sensitive detection of clenbuterol and related β2-agonists in urine samples. Food and Agricultural Immunology, 27(1), 111–127. doi: https://doi.org/10.1080/09540105.2015.1079598
- Liu, L. Q., Luo, L. J., Suryoprabowo, S., Peng, J., Kuang, H., & Xu, C. L. (2014). Development of an immunochromatographic strip test for rapid detection of ciprofloxacin in milk samples. Sensors, 14(9), 16785–16798. doi: https://doi.org/10.3390/s140916785
- Liu, L., Suryoprabowo, S., Zheng, Q., Song, S., & Kuang, H. (2017). Rapid detection of aldicarb in cucumber with an immunochromatographic test strip. Food and Agricultural Immunology, 28(3), 427–438. doi: https://doi.org/10.1080/09540105.2017.1293015
- Peng, J., Liu, L., Kuang, H., Cui, G., & Xu, C. (2017). Development of an icELISA and immunochromatographic strip for detection of norfloxacin and its analogs in milk. Food and Agricultural Immunology, 28(2), 288–298. doi: https://doi.org/10.1080/09540105.2016.1263987
- Scheuch, E., Spieker, J., Venner, M., & Siegmund, W. (2007). Quantitative determination of the macrolide antibiotic tulathromycin in plasma and broncho-alveolar cells of foals using tandem mass spectrometry. Journal of Chromatography B, 850(1-2), 464–470. doi: https://doi.org/10.1016/j.jchromb.2006.12.034
- Shan, G. M., Stoutamire, D. W., Wengatz, I., Gee, S. J., & Hammock, B. D. (1999). Development of an immunoassay for the pyrethroid insecticide esfenvalerate. Journal of Agricultural and Food Chemistry, 47(5), 2145–2155. doi: https://doi.org/10.1021/jf981210m
- Villarino, N., Lesman, S., Fielder, A., Garcia-Tapia, D., Cox, S., Lucas, M., … Martin-Jimenez, T. (2013). Pulmonary pharmacokinetics of tulathromycin in swine. Part I: Lung homogenate in healthy pigs and pigs challenged intratracheally with lipopolysaccharide of Escherichia coli. Journal of Veterinary Pharmacology and Therapeutics, 36(4), 329–339. doi: https://doi.org/10.1111/jvp.12016