
ABSTRACT
Rapid non-laboratory screening of plants for pathogenic viruses crucially influences crop yields in modern agricultural technologies. The aim of this study was to develop a highly-sensitive lateral flow immunoassay (LFIA) for rapid detection of potato leafroll virus (PLRV), an infectious agent of one of the most widespread potato diseases. The proposed LFIA combines the formation of sandwich immune complexes with gold nanoparticles (GNP) as labels and silver enhancement. The enhancement stage was realized using mixture of silver lactate and hydroquinone and subsequent addition of chloride-containing buffer to stop silver reduction. LFIA with silver enhancement was 15 times more sensitive (detection limit 0.2 ng/mL; 15 min) compared with conventional LFIA (detection limit 3 ng/mL; 10 min). The enhanced LFIA detected PLRV in leaves’ extracts of infected potato in dilutions higher than enzyme-linked immunosorbent assay.
1. Introduction
Viral and bacterial infections are among the main causes of crop yield loss (Narayanasamy, Citation2011a, Citation2011b; Sanfacon, Citation2017). Rapid assessment of a phytopathological situation requires analytical methods that can be implemented in non-laboratory conditions, with minimal costs and without the involvement of highly qualified personnel (Sharma & Sharma, Citation2016).
One of the most suitable methods for addressing this need is lateral flow immunoassay (LFIA), also called immunochromatographic assay. Key advantages of the LFIA are short analysis time (10–15 min), easy sample preparation, and the fact that there is no requirement for expensive stationary equipment. Because of this, LFIA is currently one of the leading techniques for routine detection of various compounds (Bahadir & Sezginturk, Citation2016; Dzantiev, Byzova, Urusov, & Zherdev, Citation2014; Quesada-Gonzalez & Merkoci, Citation2015). LFIA is also a priority method for on-site detection of pathogens (Danks & Barker, Citation2000; Jones, Citation2014; Khater, de la Escosura-Muniz, & Merkoci, Citation2017). Moreover, LFIAs are included in functioning national and international regulations for agricultural control (EPPO, Citation2014). The only limiting factor for LFIA expansion is its moderate sensitivity. The known approaches for improving LFIA sensitivity are extremely diverse (Chen et al., Citation2015; Gao et al., Citation2016; Peng et al., Citation2017; Shan, Lai, Xiong, Wei, & Xu, Citation2015; Song, Zou, Zhu, Liu, & Kuang, Citation2017; Xing et al., Citation2015) and may be based on the use of alternate labels, catalytic enhancement or aggregation processes. There is no one accepted method of amplification that can be unambiguously recommended as the optimal method for all LFIAs.
This article presents the development of a highly-sensitive, enhanced technique for LFIA of potato leafroll virus (PLRV). PLRV (genus Polerovirus, family Luteoviridae) is an aphid-transmitted potato virus with the highest economic impact on seed potato production worldwide (Li et al., Citation2013; Rajabaskar, Ding, Wu, & Eigenbrode, Citation2013). PLRV infection induces pallor or reddening of leaf tips, stunting of shoots, upward rolling of leaflets, reduction in tuber number and size, and net necrosis in tubers (Cox & Jones, Citation2012; Marsh et al., Citation1998; Marsh, Huffaker, & Long, Citation2000). Potato leafroll disease is one of the main factors limiting production and quality of potatoes. Planting of PLRV-infected seeds may result in a yield loss up to 90% (Radcliffe & Ragsdale, Citation2002; Ragsdale, Radcliffe, & DiFonzo, Citation2001). The effective prevention of PLRV infection requires isolation of infected potato crops and use of virus-free seed potatoes. Considering risks of rapid transmission of infection by aphids, regular non-laboratory monitoring of an infection is necessary. Besides, PLRV is a phloem-limited virus and its concentration in infected leaves is low (Peter, Palukaitis, Gildow, & Gray, Citation2008; Radcliffe & Ragsdale, Citation2002; Vandenheuvel, Deblank, Peters, & Vanlent, Citation1995). This could be the reason for the small number of commercial LFIAs for PLRV. Only one test kit, Bioreba AG (Switzerland), is available for PLRV detection, and its application should be integrated with the use of additional devices for magnetic concentration. This situation differs significantly from the detection of other potato pathogens, in which a large number of commercial LFIAs are available (e.g. Agdia, USA; Loewe Biochemica, Germany; Bioreba AG, Switzerland; Pocket Diagnostic, UK; AC Diagnostic, USA).
We have proposed the use of silver enhancement to detect low concentrations of PLRV by LFIA. The silver enhancement is based on the reduction of silver ions on the surface of gold nanoparticles (GNP), and provides a significant increase of initial GNP-caused coloration. This approach was previously used successfully in other LFIAs (Byzova, Zherdev, Sveshnikov, Sadykhov, & Dzantiev, Citation2015; Drygin et al., Citation2012; Gupta, Huda, Kilpatrick, & Velev, Citation2007; Panferov et al., Citation2016; Rodriguez, Covian, Garcia, & Blanco-Lopez, Citation2016), but it has not been combined with PLRV immunodetection. Because the possibility of nonspecific background coloration is indicated as an important risk factor in silver enhancement, this assay procedure was modified to limit this process.
The presented investigation includes the production and characterization of modified immunoreactants for LFIA; choice of the LFIA optimal regime, including the stage of silver enhancement; comparison with conventional LFIA without enhancement; and the application of the developed tests for PLRV detection in potato plants.
2. Materials and methods
2.1. Reagents
PLRV was propagated in Datura stramonium and purified from infected leaves (Rowhani & Stacesmith, Citation1979). Polyclonal antibodies (fraction of IgG) specific to PLRV described by Safenkova et al. (Citation2016) were used in the experiments. Tris(hydroxymethyl)aminomethane (Tris), Triton X-100, 3,3′,5,5′-tetramethylbenzidine dihydrochloride (TMB), sodium azide, biotinamidohexanoic acid N-hydroxysuccinimide ester, dimethyl sulfoxide (DMSO), and chloroauric acid were purchased from Fluka (Germany); staphylococcal protein A was obtained from Imtek (Russia); streptavidin–polyperoxidase conjugate, bovine serum albumin (BSA), sodium citrate, silver lactate, hydroquinone, and sucrose were obtained from Sigma-Aldrich (USA); glycerol, NaCl, and K2CO3 were obtained from DiaM (Russia); and Na2CO3, NaHCO3, KH2PO4, and KOH were obtained from Khimmed (Russia). All the chemicals were of analytical reagent or chemical reagent grade. All solutions were prepared using water deionized by a Milli-Q system by Millipore (USA).
2.2. Atomic force microscopy (AFM)
PLRV solutions (10 μL, 10 μg/mL) in 0.05 M potassium phosphate buffer (pH 7.4, with 0.1 M NaCl (PBS)) were immobilized on freshly-cleaved mica (SPI Supplies, USA) and left for 10 min to facilitate physical adsorption of the viral particles. The excess liquid was carefully removed using filter paper, and the mica was dried by air flow.
AFM experiments were performed with a SmartSPM-1000 atomic force microscope (AIST-NT, Russia) in a tapping mode on air using fpN01HAR cantilevers with a tip curvature radius of 10 nm and a resonant frequency of 118–190 kHz (Nanotuning, Russia). The results were analyzed with Gwyddion software (Czech Metrology Institute, Czech Republic).
2.3. Biotinylation of antibodies
Antibodies were biotinylated as described by Hermanson (Citation2013). Biotin amidohexanoyl-6-aminohexanoic acid NHS ester was used to attach the amine groups of the antibodies. The mixture of biotin reagents and antibodies at a molar ratio of 15:1 was incubated for 1 h at room temperature with continuous mixing. Following this, dialysis was performed in 1000-fold of PBS for 4 h at room temperature to remove the unreacted biotin reagent.
2.4. Preparation of samples containing PLRV
For the calibration curve, PLRV was added to PBS containing 0.05% Triton X-100 (PBST) reaching final concentrations from 0.1 to 100 ng/mL. For the calibration curve in the leaf extracts, the leaves of healthy potatoes (in vitro virus-free culture of plants) were thoroughly homogenized in PBST (1 g of leaves per 10 mL of PBST) in a porcelain mortar. After this, PLRV was added at the same range of concentrations. To test the potato samples, extracts of infected potato leaves were prepared as described above.
2.5. Sandwich ELISA
Anti-PLRV antibodies (100 μL, 2.0 μg/mL, in PBS) were immobilized in microplate wells (Costar 9018, Corning Costar, USA) at 37°С for 2 h. The wells were then washed four times with PBST. PLRV solution (100 μL in PBST) or leaf extract was then added. The microplate was incubated at 37°С for 1 h and washed as described above. Next, 100 μL of biotinylated antibodies (2 μg/mL in PBST) were added, and the microplate was incubated and washed as described above. Then, 100 μL of the streptavidin-polyperoxidase conjugate (1:5000 dilution in PBST) was added. The microplate was incubated and washed as described above. The peroxidase activity was finally determined. The substrate (100 μL of 0.4 mM TMB solution in 40 mM sodium citrate buffer, pH 4.0, containing 3 mM H2O2) was added to each well. After incubation for 15 min at room temperature, the reaction was terminated by the addition of 1 M H2SO4 (50 μL), and absorbance at 450 nm (A450) was measured. ELISA was performed with a Thermo Electron WellWash 4 MK2 washer (Fisher Scientific, USA), and the results were registered with a Zenyth 3100 microplate reader (Anthos Labtec Instruments, Austria).
Calibration curves were obtained by plotting the mean A450 (n = 3) versus the logarithm of the PLRV concentration using Origin 9.5 software (OriginLab, USA). The instrumental limit of detection (LOD) of PLRV was determined using linear approximation and the three-sigma method proposed by the International Union of Pure and Applied Chemistry (Currie, Citation1999).
2.6. Synthesis of GNPs
The GNPs were synthesized using the Frens method (Frens, Citation1973) with modifications (Safenkova, Zherdev, & Dzantiev, Citation2010). One millilitre of 1% HAuСl4 solution was added to 95 mL of deionized water; then, 4 mL of 1% sodium citrate was added under continuous stirring. The solution was suspended over heat, boiled for 25 min, cooled, and stored at 4°C.
2.7. Synthesis of GNP–antibody conjugates
The GNP–antibody conjugates were synthesized according to Safenkova, Zherdev, and Dzantiev (Safenkova, Zherdev, & Dzantiev, Citation2012). The antibodies were dialyzed against a 1000-fold volume of 10 mM Tris-HCl (pH 9.0) at 4°C for 2 h. The pH of the GNP preparation was adjusted to 9.0 with 0.2 M K2CO3, and the GNPs were then added to the antibodies (12 μg/mL). The mixture was stirred at room temperature for 1 h, and BSA was added to a final concentration of 0.25%. The GNPs with immobilized antibodies were separated by centrifugation at 20,000 g for 30 min and resuspended in 0.05 M Tris buffer (pH 7.4) containing 0.25% BSA, 0.25% Tween-20, and 1% sucrose. For long-term storage, NaN3 was added to a final concentration of 0.02%.
2.8. Dynamic light scattering (DLS)
DLS measurements were performed with Malvern Zetasizer Nano (Malvern, UK) using a disposable 80 mL cuvette. The scattering angle was 173°, and the temperature was stabilized at 25°С. Malvern Software ver. 7.11 (Malvern, UK) was used for data analysis.
2.9. Preparation of test strips
Test strips for sandwich LFIA of PLRV (A) were prepared using membranes produced by Advanced Microdevices (India): a nitrocellulose membrane CNPC-10μ, conjugate release matrix PT-R5, a sample pad GFB-R4 (0.35), and absorbent pad AP045. Test and control zones were formed on the nitrocellulose membrane by anti-PLRV antibodies (1.0 mg/mL) and protein A (0.4 mg/mL), respectively. The reagents were dispensed by an IsoFlow dispenser (Imagene Technology, USA) at a membrane width of 0.15 µL/mm in PBS with 5% glycerol and 0.03% NaN3. The GNP–antibody conjugate solutions with A520 equal to 3, 4, or 5 were dispensed onto the conjugate release matrix (1.6 µL/mm). Both membranes were dried at 37°C for 8 h and then assembled including sample and absorbent pads. The obtained composite was cut into 3.5-mm-wide strips using an Index Cutter-1 (A-Point Technologies, USA). The strips were hermetically sealed in laminated aluminum foil bags containing silica gel desiccant, using an FR-900 continuous band sealer (Wenzhou Dingli Packing Machinery, China). Cutting and packing were carried out at 20–22°C in a separate room, with relative humidity not exceeding 30%.
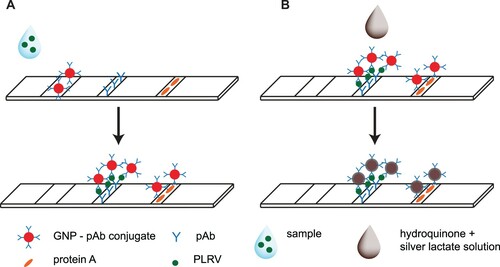
Figure 1. Schemes of the test strip used and LFIAs in conventional sandwich format (A) and silver-enhanced sandwich format (B).
2.10. Lateral flow immunoassay
The assay was performed at room temperature. The test strip was vertically submerged in the tested sample for 1.5 min before it was removed and placed on a horizontal surface. The formations of coloured zones were visually detected 10 min after test strip immersion. The visual LOD of the LFIA was defined by PLRV concentration when the test line appeared.
For quantitative analysis, the test strips were scanned using a Canon 9000F Mark II scanner (Canon, Japan), and digital images were analyzed with a TotalLab TL120 software (Nonlinear Dynamics, UK). Linear approximations for the initial sections of the dependence of the colour intensity of the LFIA test line on the PLRV concentration were plotted. The instrumental LOD was determined using the three-sigma method.
2.11. Silver enhancement of LFIA test strips
After the described assay, the strips were washed three times under a stream of distilled water to remove chloride ions. The enhancement was conducted using silver lactate (0.3% in water) and hydroquinone (3% in 10 mM citric buffer, pH 4.0) solutions according to Byzova et al. (Citation2015). The hydroquinone (20 µL) and silver lactate (20 µL) were dropped on the test zone as proposed previously (Anfossi, Di Nardo, Giovannoli, Passini, & Baggiani, Citation2013; Panferov et al., Citation2016) (see B). The reaction was carried out in darkness for 5 min. Then PBST (20 µL) was added to stop the reaction.
3. Results and discussion
3.1. Virus and antibody characterization
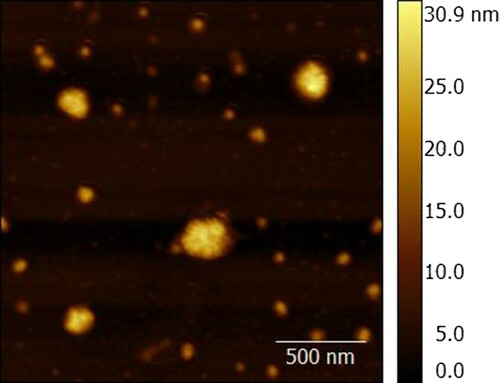
For the planned realization of ELISA and LFIA in sandwich formats, the integrity of PLRV virions in the standard preparation require confirmation. The AFM technique was applied to characterize PLRV. The typical AFM image is presented in . The figure shows the isometric shape of PLRV particles and the average particle height in the range from 24 to 25 nm, which corresponds with existing data (Taliansky, Mayo, & Barker, Citation2003). Therefore, assembly of triple immune complexes with PLRV preparation is possible.
Figure 2. AFM image of PLRV preparation.
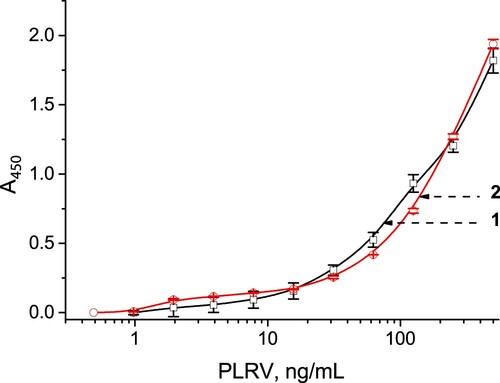
The antigen-binding capacity of anti-PLRV antibodies was confirmed by sandwich ELISA with the same polyclonal antibodies as capture and detection reactants (see Section 2.5). Calibration curves for PLRV are shown in ; they did not differ in buffer and leaf extract. The LOD value was 3 ng/mL.
Figure 3. Curves for sandwich ELISA of PLRV: plots of registered absorbance (A450) versus concentration of PLRV added to buffer (1) and extracts of healthy potato leaves (2).
3.2. Synthesis and characterization reagents for LFIA
GNPs were synthesized using the citrate reduction method (see Section 2.6). Their size was characterized by the DLS technique; the average diameter was 18 ± 4 nm ((1)). UV-VIS spectrophotometry of the GNP solution demonstrates the absorption maximum at 522 nm (Figure S1) that corresponds to the literature data for GNP of such size. The synthesized GNPs were monodisperse (no aggregates were observed) and stable under storage. This allowed their usage for conjugation with antibodies.
Figure 4. DLS data of the distribution of hydrodynamic diameters of GNP (1) and GNP-antibody conjugates (2).
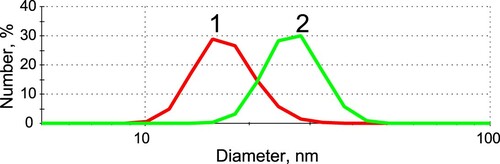
The antibodies were conjugated with GNP by physical adsorption (see Section 2.7). The concentration of anti-PLRV antibodies equal to 12 µg/mL was chosen as stabilizing one on the basis of flocculation experiments (data not shown). According to DLS data, the diameter of the conjugate was enlarged to 29 ± 4 nm (see (2)), and the averaged diameter of IgG is approximately 7–10 nm (data from Protein Data Bank); the addition of 11 nm can be interpreted as the formation of not more than an antibody monolayer on the GNP surface at the immobilization conditions. The absorption maximum of the conjugates was shifted to 525 nm (Figure S1.2) in accordance with existing data (Boulos et al., Citation2013; Wang & Ni, Citation2014).
3.3. Optimization of LFIA conditions
The formation of a detected coloured complex at the test zone of test strip was characterized for different concentrations of the GNP-antibody conjugate in LFIA with and without silver enhancement. To exclude non-specific coloration, we abandoned the previously-described protocols (Anfossi et al., Citation2013; Panferov et al., Citation2016). After 5 min of incubation with hydroquinone and silver lactate, we added 20 µL of PBST as a terminating reagent. The experimental results are presented in .
Figure 5. Dependences of the colour intensity in the test zone on the GNP-antibody conjugate and PLRV concentrations. Black bars correspond to LFIA without enhancement, and grey bars to LFIA with silver enhancement.
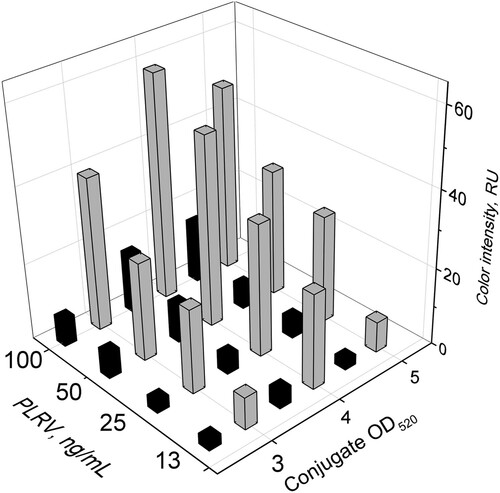
For all tested PLRV concentrations and for both LFIA regimes the conjugate with A520 = 4 gave the highest colour intensity compared with other conjugate preparations with A520 = 3 or 5. The silver-enhanced LFIA gave a 3-to-7-times higher level of coloration in the test zone. Similar effects of silver enhancement were also obtained for the control zone (data not shown). Thus, the concentration of the GNP-antibody conjugate corresponding to A520 = 4 was chosen for further experiments.
The LFIA specificity was confirmed using six main potato viruses: X, M, A, S, ordinary, and necrotic types of potato virus Y. The binding in the test zone was not observed for concentrations up to 1000 ng/mL.
3.4. Comparison of LFIAs without enhancement and with silver enhancement
To characterize the effects of silver enhancement, we conducted LFIAs for the same PLRV concentrations. Buffer solutions and leaf extracts containing PLRV in a range from 0.1 to 100 ng/mL were tested in LFIAs with and without silver enhancement. It was found that the components of the potato leaf extracts did not affect binding in the test zone. For equal concentrations of PLRV, there were no significant differences in coloration intensity. The corresponding experimental results (appearance of the strips and calibration curves) for extracts are given in and for buffer in Figure S2.
Figure 6. Results of LFIA for PLRV in extracts of healthy potato leaves: (А) Appearance of the test strips after conventional LFIA (CZ, control zone; TZ, test zone). The number above the strip denotes PLRV concentration (ng/mL). (В) Appearance of the test strips after LFIA with silver enhancement. The notations are the same as in (A). (C) Colour intensity of the test zone depending on PLRV concentration. Curves 1 and 2 correspond to the tests strips presented in (A) and (B), respectively.
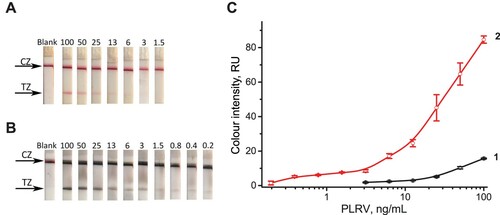
The visual LOD of LFIA without enhancement is 3 ng/mL, similar to the LOD of ELISA (see Section 3.1). After the silver enhancement colour changed from red to black (see A-B) and colour intensity increased significantly (see C). The silver enhancement reduced the LOD 15-fold. This way, up to 0.2 ng/mL of PLRV can be detected with the naked eye. This improvement is accomplished by very small increase in the assay time, from 10 to 15 min.
The obtained 15-fold improvement of LFIA sensitivity is superior compared with the variants of silver enhancement reported in previous works: 10-fold increase for ochratoxin A (Anfossi et al., Citation2013), Helicobacter pylori (Byzova et al., Citation2015), and Ralstonia solanacearum (Panferov et al., Citation2016); 4-fold increase for cadmium (Xing et al., Citation2014); 3-fold increase for prostate-specific antigen (Rodriguez et al., Citation2016); 2.5-fold increase for fumonisin B1; and 2-fold increase for deoxynivalenol (Yu et al., Citation2015).
Compared to other techniques of PLRV detection, the proposed silver-enhanced LFIA is more sensitive than previously-described LFIAs in conventional format with an LOD of 30 ng/mL (Kondakova, Butenko, Skurat, & Drygin, Citation2016) and more rapid than tissue print immunoassay with a duration of 4–5 h (Samsatly, Jawhari, Najjar, Sobh, & Abou-Jawdah, Citation2014). Moreover, due to possibility of on-site application, this LFIA is a good alternative for PLRV assays based on reverse transcription polymerase chain reactions (Cating, Funke, Kaur, Hamm, & Frost, Citation2015; Ju, Citation2011; Zhang et al., Citation2017) or loop-mediated isothermal amplification (Ahmadi, Almasi, Fatehi, Struik, & Moradi, Citation2013; Almasi, Manesh, Jafary, & Dehabadi, Citation2013).
3.5. Analysis of infected potato leaves
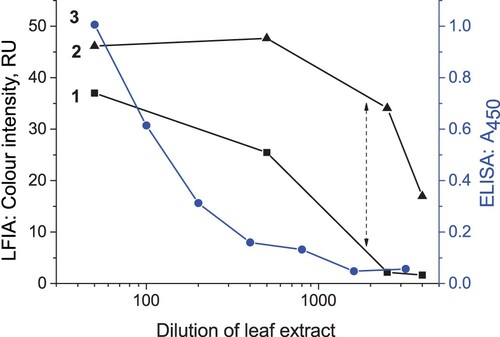
The conventional and silver-enhanced LFIAs were used to detect PLRV in leaves of infected potato plants (n = 3). presents typical results of measurements for different dilutions of leaf extract by these two LFIAs and by ELISA based on the same antibodies. The enhanced LFIA detects PLRV in high dilutions, up to 4000, substantially exceeding conventional LFIA and ELISA. All data about work with infected plants are presented in Table S1.
Figure 7. Plots of the colour intensity (LFIA) and A450 (ELISA) vs. the dilution of infected leaf extract. Curves 1, 2, and 3 represent conventional LFIA, silver-enhanced LFIA, and ELISA, respectively. Arrows indicate the different colour intensities between conventional and silver-enhanced LFIAs.
4. Conclusions
Silver-enhanced LFIA of PLRV was successfully developed. The enhancement was realized by the addition of a drop of silver-lactate-and-hydroquinone mixture. For the stopping of silver reduction, an original terminated reagent, phosphate buffer containing chloride ions, is proposed. It was found that the LFIA of PLRV with silver enhancement was 15 times more sensitive in comparison with conventional LFIA; the LOD was changed from 3 to 0.2 ng/mL. The developed silver-enhanced LFIA allows quick and accurate on-site primary screening control of PLRV. This could be a tool for planting virus-free potatoes and increasing potato yields.
Supplementary_material.pdf
Download PDF (191.3 KB)Disclosure statement
No potential conflict of interest was reported by the authors.
ORCID
Irina V. Safenkova http://orcid.org/0000-0002-3621-4321
Additional information
Funding
Related Research Data
References
- Ahmadi, S., Almasi, M. A., Fatehi, F., Struik, P. C., & Moradi, A. (2013). Visual detection of potato leafroll virus by one-step reverse transcription loop-mediated isothermal amplification of DNA with hydroxynaphthol blue dye. Journal of Phytopathology, 161(2), 120–124. doi: https://doi.org/10.1111/jph.12037
- Almasi, M. A., Manesh, M. E., Jafary, H., & Dehabadi, S. M. H. (2013). Visual detection of potato leafroll virus by loop-mediated isothermal amplification of DNA with the GeneFinder™ dye. Journal of Virological Methods, 192(1-2), 51–54. doi: https://doi.org/10.1016/j.jviromet.2013.04.014
- Anfossi, L., Di Nardo, F., Giovannoli, C., Passini, C., & Baggiani, C. (2013). Increased sensitivity of lateral flow immunoassay for ochratoxin A through silver enhancement. Analytical and Bioanalytical Chemistry, 405(30), 9859–9867. doi: https://doi.org/10.1007/s00216-013-7428-6
- Bahadir, E. B., & Sezginturk, M. K. (2016). Lateral flow assays: Principles, designs and labels. TrAC Trends in Analytical Chemistry, 82, 286–306. doi: https://doi.org/10.1016/j.trac.2016.06.006
- Boulos, S. P., Davis, T. A., Yang, J. A., Lohse, S. E., Alkilany, A. M., Holland, L. A., & Murphy, C. J. (2013). Nanoparticle-protein interactions: A thermodynamic and kinetic study of the adsorption of bovine serum albumin to gold nanoparticle surfaces. Langmuir, 29(48), 14984–14996. doi: https://doi.org/10.1021/la402920f
- Byzova, N. A., Zherdev, A. V., Sveshnikov, P. G., Sadykhov, E. G., & Dzantiev, B. B. (2015). Development of an immunochromatographic test system for the detection of Helicobacter pylori antigens. Applied Biochemistry and Microbiology, 51(5), 608–617. doi: https://doi.org/10.1134/S000368381505004X
- Cating, R. A., Funke, C. N., Kaur, N., Hamm, P. B., & Frost, K. E. (2015). A multiplex reverse transcription (RT) high-fidelity PCR protocol for the detection of six viruses that cause potato tuber necrosis. American Journal of Potato Research, 92(4), 536–540. doi: https://doi.org/10.1007/s12230-015-9457-5
- Chen, M. H., Yu, Z. B., Liu, D. F., Peng, T., Liu, K., Wang, S. Y., … Lai, W. H. (2015). Dual gold nanoparticle lateflow immunoassay for sensitive detection of Escherichia coli O157:H7. Analytica Chimica Acta, 876, 71–76. doi: https://doi.org/10.1016/j.aca.2015.03.023
- Cox, B. A., & Jones, R. A. C. (2012). Effects of tissue sampling position, primary and secondary infection, cultivar, and storage temperature and duration on the detection, concentration and distribution of three viruses within infected potato tubers. Australasian Plant Pathology, 41(2), 197–210. doi: https://doi.org/10.1007/s13313-011-0108-0
- Currie, L. A. (1999). Detection and quantification limits: Origins and historical overview. Analytica Chimica Acta, 391(2), 127–134. doi: https://doi.org/10.1016/S0003-2670(99)00105-1
- Danks, C., & Barker, I. (2000). On-site detection of plant pathogens using lateral-flow devices. EPPO Bulletin, 30(3-4), 421–426. doi: https://doi.org/10.1111/j.1365-2338.2000.tb00922.x
- Drygin, Y. F., Blintsov, A. N., Grigorenko, V. G., Andreeva, I. P., Osipov, A. P., Varitzev, Y. A., … Atabekov, J. G. (2012). Highly sensitive field test lateral flow immunodiagnostics of PVX infection. Applied Microbiology and Biotechnology, 93(1), 179–189. doi: https://doi.org/10.1007/s00253-011-3522-x
- Dzantiev, B. B., Byzova, N. A., Urusov, A. E., & Zherdev, A. V. (2014). Immunochromatographic methods in food analysis. TrAC Trends in Analytical Chemistry, 55, 81–93. doi: https://doi.org/10.1016/j.trac.2013.11.007
- EPPO. (2014). Diagnostic protocols for regulated pests, EPPO standard PM 7, in EPPO standards: General phytosanitary measures EPPO. Paris: Blackwell Publishing Ltd.
- Frens, G. (1973). Controlled nucleation for the regulation of the particle size in monodisperse gold suspensions. Nature Physical Science, 241(105), 20–22. doi: https://doi.org/10.1038/physci241020a0
- Gao, X. F., Xu, L. P., Wu, T. T., Wen, Y. Q., Ma, X. L., & Zhang, X. J. (2016). An enzyme-amplified lateral flow strip biosensor for visual detection of MicroRNA-224. Talanta, 146, 648–654. doi: https://doi.org/10.1016/j.talanta.2015.06.060
- Gupta, S., Huda, S., Kilpatrick, P. K., & Velev, O. D. (2007). Characterization and optimization of gold nanoparticle-based silver-enhanced immunoassays. Analytical Chemistry, 79(10), 3810–3820. doi: https://doi.org/10.1021/ac062341m
- Hermanson, G. T. (2013). Bioconjugate techniques (3rd ed.). Boston, MA: Academic Press.
- Jones, R. A. C. (2014). Trends in plant virus epidemiology: Opportunities from new or improved technologies. Virus Research, 186, 3–19. doi: https://doi.org/10.1016/j.virusres.2013.11.003
- Ju, H. J. (2011). Simple and rapid detection of potato leafroll virus by reverse transcription loop-mediated isothermal amplification. The Plant Pathology Journal, 27(4), 385–389. doi: https://doi.org/10.5423/PPJ.2011.27.4.385
- Khater, M., de la Escosura-Muniz, A., & Merkoci, A. (2017). Biosensors for plant pathogen detection. Biosensors and Bioelectronics, 93, 72–86. doi: https://doi.org/10.1016/j.bios.2016.09.091
- Kondakova, O. A., Butenko, K. O., Skurat, E. V., & Drygin, Y. F. (2016). Molecular diagnostics of potato infections with PVY and PLRV by immunochromatography. Moscow University Biological Sciences Bulletin, 71(1), 39–44. doi: https://doi.org/10.3103/S0096392516010041
- Li, J. W., Wang, B., Song, X. M., Wang, R. R., Chen, L., Zhang, H., … Wang, Q. C. (2013). Potato leafroll virus (PLRV) and potato virus Y (PVY) influence vegetative growth, physiological metabolism, and microtuber production of in vitro-grown shoots of potato (Solanum tuberosum L.). Plant Cell, Tissue and Organ Culture (PCTOC), 114(3), 313–324. doi: https://doi.org/10.1007/s11240-013-0327-x
- Marsh, T. L., Huffaker, R. G., & Long, G. E. (2000). Optimal control of vector-virus-plant interactions: The case of potato leafroll virus net necrosis. American Journal of Agricultural Economics, 82(3), 556–569. doi: https://doi.org/10.1111/0002-9092.00046
- Marsh, T. L., Huffaker, R. G., Mittelhammer, R. C., Folwell, R. J., Long, G. E., Horton, D. R., & Toba, H. H. (1998). Potato leafroll virus net necrosis: Identifying pest management tradeoffs among inoculation interval, storage length, and tuber weight. Journal of Economic Entomology, 91(4), 923–932. doi: https://doi.org/10.1093/jee/91.4.923
- Narayanasamy, P. (2011a). Diagnosis of bacterial diseases of plants. In Microbial plant pathogens-detection and disease diagnosis (pp. 233–246). Springer.
- Narayanasamy, P. (2011b). Diagnosis of viral and viroid diseases of plants. In Microbial plant pathogens-detection and disease diagnosis (pp. 295–312). Springer.
- Panferov, V. G., Safenkova, I. V., Varitsev, Y. A., Drenova, N. V., Kornev, K. P., Zherdev, A. V., & Dzantiev, B. B. (2016). Development of the sensitive lateral flow immunoassay with silver enhancement for the detection of Ralstonia solanacearum in potato tubers. Talanta, 152, 521–530. doi: https://doi.org/10.1016/j.talanta.2016.02.050
- Peng, X., Kang, L., Pang, F., Li, H., Luo, R., Luo, X., & Sun, F. (2017). A signal-enhanced lateral flow strip biosensor for ultrasensitive and on-site detection of bisphenol A. Food and Agricultural Immunology, 1–12. doi:10.1080/09540105.2017.1365822 doi: https://doi.org/10.1080/09540105.2017.1354357
- Peter, K., Palukaitis, P., Gildow, F., & Gray, S. (2008). Phloem limitation of potato leafroll virus is an asset not a liability. Phytopathology, 98(6), S124–S125.
- Quesada-Gonzalez, D., & Merkoci, A. (2015). Nanoparticle-based lateral flow biosensors. Biosensors and Bioelectronics, 73, 47–63. doi: https://doi.org/10.1016/j.bios.2015.05.050
- Radcliffe, E. B., & Ragsdale, D. W. (2002). Aphid-transmitted potato viruses: The importance of understanding vector biology. American Journal of Potato Research, 79(5), 353–386. doi: https://doi.org/10.1007/BF02870173
- Ragsdale, D. W., Radcliffe, E. B., & DiFonzo, C. D. (2001). Epidemiology and field control of PVY and PLRV. In G. Loebenstein, P. H. Berger, A. A. Brunt, & R. H. Lawson (Eds.), Virus and virus-like diseases of potatoes and production of seed-potatoes (pp. 237–270). Dordrecht: Springer.
- Rajabaskar, D., Ding, H., Wu, Y., & Eigenbrode, S. D. (2013). Different reactions of potato varieties to infection by potato leafroll virus, and associated responses by its vector, Myzus persicae (Sulzer). Journal of Chemical Ecology, 39(7), 1027–1035. doi: https://doi.org/10.1007/s10886-013-0311-2
- Rodriguez, M. O., Covian, L. B., Garcia, A. C., & Blanco-Lopez, M. C. (2016). Silver and gold enhancement methods for lateral flow immunoassays. Talanta, 148, 272–278. doi: https://doi.org/10.1016/j.talanta.2015.10.068
- Rowhani, A., & Stacesmith, R. (1979). Purification and characterization of potato leafroll virus. Virology, 98(1), 45–54. doi: https://doi.org/10.1016/0042-6822(79)90523-3
- Safenkova, I. V., Pankratova, G. K., Zaitsev, I. A., Varitsev, Y. A., Vengerov, Y. Y., Zherdev, A. V., & Dzantiev, B. B. (2016). Multiarray on a test strip (MATS): Rapid multiplex immunodetection of priority potato pathogens. Analytical and Bioanalytical Chemistry, 408(22), 6009–6017. doi: https://doi.org/10.1007/s00216-016-9463-6
- Safenkova, I. V., Zherdev, A. V., & Dzantiev, B. B. (2010). Correlation between the composition of multivalent antibody conjugates with colloidal gold nanoparticles and their affinity. Journal of Immunological Methods, 357(1-2), 17–25. doi: https://doi.org/10.1016/j.jim.2010.03.010
- Safenkova, I. V., Zherdev, A. V., & Dzantiev, B. B. (2012). Factors influencing the detection limit of the lateral-flow sandwich immunoassay: A case study with potato virus X. Analytical and Bioanalytical Chemistry, 403(6), 1595–1605. doi: https://doi.org/10.1007/s00216-012-5985-8
- Samsatly, J., Jawhari, M., Najjar, C., Sobh, H., & Abou-Jawdah, Y. (2014). Modification of serological techniques and their evaluation for detection of potato viruses in seed certification related activities. Crop Protection, 61, 51–57. doi: https://doi.org/10.1016/j.cropro.2014.03.007
- Sanfacon, H. (2017). Grand challenge in plant virology: Understanding the impact of plant viruses in model plants, in agricultural crops, and in complex ecosystems. Frontiers in Microbiology, 8, doi:10.3389/fmicb.2017.00860.
- Shan, S., Lai, W. H., Xiong, Y. H., Wei, H., & Xu, H. Y. (2015). Novel strategies to enhance lateral flow immunoassay sensitivity for detecting foodborne pathogens. Journal of Agricultural and Food Chemistry, 63(3), 745–753. doi: https://doi.org/10.1021/jf5046415
- Sharma, P., & Sharma, S. (2016). Paradigm shift in plant disease diagnostics: A journey from conventional diagnostics to nano-diagnostics. In P. Kumar, V. K. Gupta, A. K. Tiwari, & M. Kamle (Eds.), Current trends in plant disease diagnostics and management practices (pp. 237–264). New York, NY: Springer.
- Song, S., Zou, S., Zhu, J., Liu, L., & Kuang, H. (2017). Immunochromatographic paper sensor for ultrasensitive colorimetric detection of cadmium. Food and Agricultural Immunology, 85, 1–11. doi:10.1080/09540105.2017.1354358.
- Taliansky, M., Mayo, M. A., & Barker, H. (2003). Potato leafroll virus: A classic pathogen shows some new tricks. Molecular Plant Pathology, 4(2), 81–89. doi: https://doi.org/10.1046/j.1364-3703.2003.00153.x
- Vandenheuvel, J. F. J. M., Deblank, C. M., Peters, D., & Vanlent, J. W. M. (1995). Localization of potato leafroll virus in leaves of secondarily-infected potato plants. European Journal of Plant Pathology, 101(5), 567–571. doi: https://doi.org/10.1007/BF01874482
- Wang, Y., & Ni, Y. N. (2014). Combination of UV-vis spectroscopy and chemometrics to understand protein-nanomaterial conjugate: A case study on human serum albumin and gold nanoparticles. Talanta, 119, 320–330. doi: https://doi.org/10.1016/j.talanta.2013.11.026
- Xing, C. R., Kuang, H., Hao, C. L., Liu, L. Q., Wang, L. B., & Xu, C. L. (2014). A silver enhanced and sensitive strip sensor for cadmium detection. Food and Agricultural Immunology, 25(2), 287–300. doi: https://doi.org/10.1080/09540105.2013.781140
- Xing, C. R., Liu, L. Q., Song, S. S., Feng, M., Kuang, H., & Xu, C. L. (2015). Ultrasensitive immunochromatographic assay for the simultaneous detection of five chemicals in drinking water. Biosensors and Bioelectronics, 66, 445–453. doi: https://doi.org/10.1016/j.bios.2014.12.004
- Yu, Q., Li, H., Li, C., Zhang, S., Shen, J., & Wang, Z. (2015). Gold nanoparticles-based lateral flow immunoassay with silver staining for simultaneous detection of fumonisin B1 and deoxynivalenol. Food Control, 54, 347–352. doi: https://doi.org/10.1016/j.foodcont.2015.02.019
- Zhang, W., Zhang, Z. X., Fan, G. Q., Gao, Y. L., Wen, J. Z., Bai, Y. J., … Meng, X. X. (2017). Development and application of a universal and simplified multiplex RT-PCR assay to detect five potato viruses. Journal of General Plant Pathology, 83(1), 33–45. doi: https://doi.org/10.1007/s10327-016-0688-1