
ABSTRACT
Zearalenone (ZEN) is a mycotoxin produced by fungal species which are widespread in nature and commonly contaminate many cereal grains, such as wheat, maize, corn, barley, and other cereal grains. An immunochromatographic (ICA) test strip was developed for the rapid simultaneous detection of ZEN and its metabolite in corn flour samples. For the ICA test, antigen (ZEN-BSA) and goat anti-mouse IgG were, respectively, drawn on nitrocellulose membrane as control line and test line. Under the optimized condition, the cut-off limits of test strips for ZEN, α-ZAL, and β-ZAL were found to be 0.5 ng/mL in 0.01 M PBS and 50 ng/mL in corn flour samples, meanwhile α-ZOL, β-ZOL, and ZEA were found to be 1 ng/mL in 0.01 M PBS and 75 ng/mL in corn flour samples. Our data indicate that the ICA is sensitive, rapid, cost-effective, and specific on-site screening for ZEN and its metabolite.
Introduction
Mycotoxins are toxic metabolites produced under particular environmental conditions by fungi and contaminate a large variety of grains and feedstuffs worldwide (Anater et al., Citation2016; Serrano, Font, Maes, & Ferrer, Citation2016). Infection occurs through ingestion, inhalation, or skin contact with fungi. Cereal grains can be infected by mycotoxigenic fungi at pre-harvest or post-harvest. These grains can be consumed by humans leading to contamination of plant origin food (cereal grain) (Glenn, Citation2007). It is estimated that approximately 25% of the world’s crop production is contaminated with mycotoxins, which can result in the reduction of livestock production, pose a great potential health risk to consumers, and will lead to tremendous economic losses (Chen et al., Citation2016; Sirot, Fremy, & Leblanc, Citation2013)
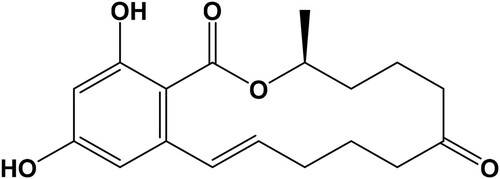
Zearalenone (, ZEN), a non-steroidal β-resorcyclic acid lactone with the systematic name of 3, 4, 5, 6, 9, 10-hexalydro-14, 16-dihydroxy-3-methyl-[S-(E)]-1H-2-benzoxacyl-otetradecin-1, 7(8H)-dione, mainly produced by several Fusarium species, such as Fusarium graminearum (Gibberella zeae), Fusarium culmorum, Fusarium cerealis, Fusarium equiseti, Fusarium crookwellense, and Fusarium semitectum, which are widespread in nature and commonly contaminate many cereal grains, such as wheat, maize, corn, barley, and other cereal grains (Cetin & Bullerman, Citation2006). ZEN shows only a low acute toxicity and there is limited evidence for its carcinogenicity and was proposed to be better fit the classification of a non-steroidal oestrogen or a myco-oestrogen. Because of the potential health risk, the provisional maximum tolerable daily intake (PMTDI) was 0.5 µg/kg body weight per day for ZEN. To reduce the intake ZEN maximum limits (MLs) for ZEN, it has been regulated in many countries and global commissions ranging from 20 to 3000 µg/kg in various food and feed stuffs (Briones-Reyes, Gomez-Martinez, & Cueva-Rolon, Citation2007; Chang et al., Citation2017; Liu et al., Citation2012; Meneely et al., Citation2010)
Figure 1. Chemical structure of zearalenone.
Due to the potential impact on human health and economical aspects, the development of a simple, rapid, and low-cost analytical methods of ZEN and its metabolite was urgently in need. The most common analytical techniques include thin-layer chromatography (TLC) (Swanson, Corley, White, & Buck, Citation1984), high-performance liquid chromatography (Chen, Luan, Wang, Wang, & Shao, Citation2017; Ok, Choi, Kim, & Chun, Citation2014; Sadeghi et al., Citation2016), and liquid chromatography-tandem mass spectrometry (LC-MS/MS) (De Santis et al., Citation2017; Kim et al., Citation2017). TLC is now rarely used because of its low sensitivity and specificity (Khaemba et al., Citation2016; Suryoprabowo, Liu, Peng, Kuang, & Xu, Citation2015). HPLC and LC-MS/MS are the methods that are most frequently used due to high sensitivity and accuracy, but these methods have disadvantages as they are complex, time-consuming, and labour intensive (Isanga et al., Citation2017; Ding, Liu, Song, Kuang, & Xu, Citation2017; Kong et al., Citation2017; Liu, Suryoprabowo, Zheng, Song, & Kuang, Citation2017b).
A variety of immunoassay methods used for ZEN detection have recently been described, including enzyme-linked immunosorbent assay (ELISA) (Bolechova et al., Citation2015; Du et al., Citation2014; Huang et al., Citation2014; Pei et al., Citation2013). The ELISA has high specificity, is applicable for high-throughput applications, requires simple sample preparation steps, and is cost-effective (Kong, Liu, Song, Kuang, & Xu, Citation2016; Peng, Liu, Kuang, Cui, & Xu, Citation2017; Suryoprabowo et al., Citation2015). However, the lateral-flow immunochromatographic assay (ICA) is increasingly popular because it is simple, rapid, specific, and sensitive. The ICA method has advantage that all the reagents are included in the strip and the results can be obtained within 5–10 min (Liu et al., Citation2014; Liu, Suryoprabowo, Zheng, Song, & Kuang, Citation2017a; Mukunzi, Isanga, Suryoprabowo, Liu, & Kuang, Citation2017).
Development of ZEN residues in wheat and maize (Huang et al., Citation2012), agro-food (Li et al., Citation2013; Majdinasab et al., Citation2015), and three mycotoxins in corn, rice, and peanut (Chen et al., Citation2016) have been detected using the ICA assay. However, no studies have used the ICA method to determine ZEN and its metabolites, such as α-zearalanol (α-ZAL), β-zearalanol (β-ZAL), α-zearalenol (α-ZOL), β-zearalenol (β-ZOL), and zearalanone (ZEA) in corn flour.
Material and methods
Chemicals and reagents
ZEN, α-ZAL, β-ZAL, α-ZOL, β-ZOL, and ZEA standards were obtained from Sigma (St. Louis, MO, USA). Goat anti-mouse immunoglobin (IgG) antibody was purchased from Jackson ImmunoResearch Laboratories (PA, USA). QuickAntibody-Mouse 5W was obtained from Biodragon-Immunotech Co., Ltd. (Beijing, China). Gelatin was obtained from Beijing Biodee Biotechnology Co., Ltd. (Beijing, China). Tetramethylbenzidine (TMB) and horseradish peroxidase (HRP) were purchased from Aladdin Chemistry Co., Ltd. (Shanghai, China). All reagents used for cell fusion were from Sunshine Biotechnology Co., Ltd. (Nanjing, China). Bovine serum albumin (BSA) and keyhole-limpet haemocyanin (KLH) were obtained from Solarbio Science & Technology, Co, Ltd. (Beijing, China). All other reagents and chemicals were obtained from the National Pharmaceutical Group Chemical Reagent Co, Ltd. (Shanghai, China).
Nitrocellulose (NC) high-flow plus membranes (Pura-bind RP) were obtained from Whatman-Xinhua Filter Paper Co., Ltd. (Hangzhou, China). Glass fibre membrane (CB-SB08) used for the sample pad, polyvinylchloride (PVC) backing material and absorbance pad (SX18) were supplied by Goldbio Tech Co., Ltd. (Shanghai, China). A BioDot TSR 3000 Membrane Strip Reader (Gene Company Limited, Shanghai Branch, Shanghai (China)) was used to test the colour intensities of colloidal gold in the test zone. The complete Freund’s adjuvant (FCA), incomplete Freund’s adjuvant (FIA), and enzyme immunoassay-grade HRP-labeled goat anti-mouse immunoglobulin were obtained from Sigma (St. Louis, MO, USA). BSA and specific monoclonal antibodies (anti-ZEN monoclonal antibody (mAb), No. #3) were generated in our laboratory.
All buffer solutions were prepared using ultrapure water (Milli-Q purification system, Millipore Co., Bedford, MA, USA). The strip cutting instrument was CM 4000 (Gene, Shanghai, China). The Airjet Quanti 3000™ and Biojet Quanti 3000™ (XinqidianGene-Technology Co., Ltd., Beijing, China) were used as dispensers.
Preparation and characterization of monoclonal anti-ZEA antibody
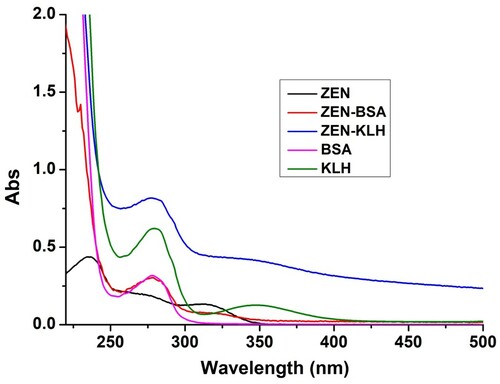
ZEA was initially derived using carboxymethoxylamine (CMO) () with protein and then the ZEA-CMO-BSA or ZEA-CMO-KLH was synthesized by the active ester method (Kong, Liu, Song, Suryoprabowo, et al., Citation2016; Suryoprabowo et al., Citation2015). Briefly, a mixture of ZEN-CMO, carboxyl-reactive carbodiimide cross linker (1-ethyl-3-[3-dimethylaminopropyl]carbodiimide hydrochloride) (EDC), and N-hydroxysuccinimide (NHS) was added to N,N-dimethyl formamide (DMF) and incubated for 24 h (solution 1). KLH or BSA was mixed with 0.05 mol/L NaHCO3 (solution 2). Solution 1 was slowly added to solution 2 with stirring and the mixture was then stirred continuously for 8 h at room temperature. The conjugates were dialysed against distilled water for 3 days and subsequently with 0.01 M PBS for a further 3 days. Ultraviolet absorption was used to check the conjugation of protein and ZEN ().
Figure 2. Oximation of zearalenone.
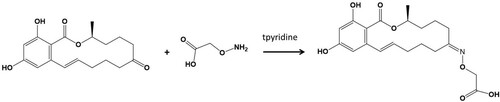
Figure 3. The UV spectra characterization for ZEN-KLH, ZEN-BSA, ZEN, KLH, and BSA.
We used FCA in the first immunization and FIA was used in the subsequent booster injections. The mice were immunized with ZEN-KLH every three weeks with 100 µg (first immunization) and 50 µg (subsequent injections; two to five times). We analysed the antibodies in blood samples of mice using ELISA. The mouse with the highest titre was sacrificed and its splenocytes were fused with Sp 2/0 murine myeloma cells. The resulting hybridomas were screened using indirect ELISA. The selected hybridoma cells were expanded and injected into BALB/c mice to produce mAbs. The ascites were harvested and purified by the caprylic acid-ammonium sulphate precipitation method (Chen et al., Citation2014), and the purified mAbs were stored at −20°C.
Development of the immunochromatographic strip
Preparation of colloidal gold nanoparticles
All the solvents were prepared with ultrapure water and passed through a 0.22 µm filter membrane. Chlorauric acid (0.1 g/L, 25 mL) was heated to boiling under constant stirring. Following the addition of 1.0 mL of 1% w/v sodium citrate tribasic dehydrate, the mixture was stirred for 30 min. When the colour of the solution turned wine-red, it was allowed to cool to room temperature, and stored at 4°C. Observations by transmission electron microscopy (TEM) revealed that the gold nanoparticles (GNPs) had a nearly uniform particle size of 15 nm.
Preparation of colloidal gold-labelled mAb
We used anti-ZEN mAb (no. #3) with a half-maximal inhibitory concentration (IC50) of 0.1 ng/mL. Colloidal GNP solution (10 mL) was adjusted to pH 7.0 with 0.1 M K2CO3 (40 µL). Briefly, mAbs (0.50 mL) were added to colloidal GNP solution dropwise. After 35 min, 1 mL of 10% (w/v) BSA was added, and the mixture was stirred for 2 h. The product was centrifuged at 8000 rpm for 45 min to remove any gold aggregates. The solution was separated into two layers; the lower layer (gold-labelled mAbs) was rinsed with 0.02 M phosphate buffer containing 5% sucrose, 1% BSA, and 0.5% polyethylene glycol (PEG) 6000 (pH 7.4). The conjugation products were reconstituted to 1 mL using gold-labeling resuspension buffer (0.02 M PBS, 5% sucrose, 2% sorbitol, 1% mannitol, 0.1% PEG, 0.1% tween, and 0.04% NaN3) and stored at 4°C.
Test procedure and principle
Prior to the test, 50 µL of gold-labelled mAbs is mixed with 150 µL of the sample solution, allowed to react for about 5 min, and added onto the sample pad. The solution migrates to the absorbent pad, and the test results are visualized within 5 min. In ZEN-positive samples, ZEN competes with ZEN-BSA conjugates embedded in the test (T) line for the finite amount of anti-ZEN mAb. When a sufficient amount of ZEN is present, free ZEN binds to gold-labelled mAb, preventing mAb from binding to ZEN-BSA in the T line. Therefore, the higher the ZEN contents in the sample, the weaker the colour of the T line. In ZEN-negative samples, the limited amount of colloidal gold-labelled mAb is trapped by the immobilized ZEN-BSA conjugate, and a clearly visible red T line appears.
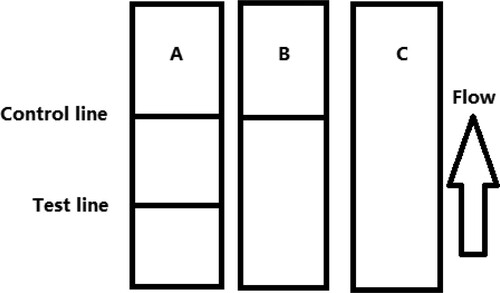
The sample must reach the control (C) line, which contains goat anti-mouse IgG antibody. Therefore, the C line must always appear in a successful test, whereas the T line will only appear when the sample is negative ((A)). The appearance of the C line alone is indicative that ZEN is present ((B)), whereas if neither the C line nor the T line appears ((C)), the test procedure is incorrect or the strip is invalid, indicating that the test should be repeated with a new strip.
Figure 4. Illustration of typical strip test results. If the sample is negative (A), a positive result could be indicated only if the control line appears (B), and if the control and test line does not appear (invalid) (C).
Determination of performance
Sensitivity of the test strip
The sensitivity of the test strip was determined by testing ZEN, α-ZAL, β-ZAL, α-ZOL, β-ZOL, and ZEA-containing samples. ZEN, α-ZAL, and β-ZAL standard was diluted to 0, 0.01, 0.025, 0.05, 0.1, 0.25, and 0.5 ng/mL, meanwhile α-ZOL, β-ZOL, and ZEA standard was diluted to 0, 0.05, 0.1, 0.25, 0.5, and 1 ng/mL in 0.01 M PBS (pH 7.4) and the detection limit was determined. The sample solution (150 µL) was mixed with 50 µL gold-labelled mAb, allowed to react for 5 min, and added onto the sample pad. After 5 min, the test strip reader was used to measure the colour intensities. The lowest detection limit (LDL) that could be detected by the naked eye was defined as the amount of ZEN, α-ZAL, β-ZAL, α-ZOL, β-ZOL, and ZEA that produced a colour reaction on the strip that was visibly different in intensity from that obtained from negative (0 ng/mL). Six replicates for each concentration were analysed on the same day.
Detection of ZEN, α-ZAL, β-ZAL, α-ZOL, β-ZOL, and ZEA in corn flour
We obtained corn flour from a local market at Wuxi, China. Corn flour (2 g) was mixed with 5 mL of 60% methanol/water (60:40, v/v). The solution was centrifuged at 4000 G for 5 min. After centrifugation, 1 mL of the supernatant was mixed with 4 mL 0.01 M PBS containing 0.1% tween (PBST). one hundred and fifty microlitres of the sample solution was obtained as the matrix for detection. The ZEN, α-ZAL, and β-ZAL concentrations in corn flour were 0 (control), 2.5, 5, 10, 25, and 50 ng/mL, meanwhile α-ZOL, β-ZOL, and ZEA concentrations were 2.5, 5, 10, 25, 50, and 75 ng/mL. Six replicates for each concentration were analysed using the test strips.
Results and discussion
Preparation of antibody-AuNPs (mAb-GNPs) conjugate
In the production of AuNPs, the particle size is inversely proportional to the sodium citrate volume. In this study, we choose 1 mL of 10% sodium citrate. The colour of HAuCl4 changed from yellow to wine-red. Colloidal GNPs with a diameter 15 nm were selected because of their stability, simplicity, and bright colour. The GNPs with size 5 nm do not have the bright red colour, hence they give only a very weak to no signal at the detection line. Amount of 0.1 M KC2CO3 was added into the AuNPs solution to ensure the AuNPs solutions are stable.
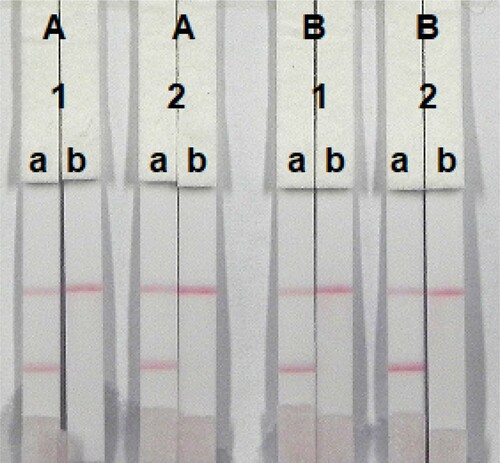
The concentration of mAbs in GNPs of the coating antigen affects the sensitivity of the assay. In this study, two different concentrations of mAbs (8 and 10 µg/mL) were allowed to react with ZEN-negative (0 ng/mL) and ZEN-positive spiked in 0.01 M PBS (1 ng/mL). Based on , there were significant differences in colour intensity between 8 and 10 µg/mL. We observed that the optimum concentration of mAb in GNP was 10 µg/mL. Additionally, there was a significant difference in the colour intensity at 0.05 and 0.1 mg/mL. It was found that the coating antigen with a concentration of 0.05 mg/mL had a weaker colour intensity than at 0.1 mg/mL, suggesting that more sensitive detection could be achieved at 0.1 mg/mL. Therefore, the optimum conditions for our developed assay consisted of 0.1 mg/mL coating antigen and 8 µg/mL.
Figure 5. Optimization of the immunochromatographic strip. Concentration of coating antigen (A) 0.05 mg/mL; (B) 0.1 mg/mL. The dosage of the mAb that add in GNP: (1) 8 µg/L; (2) 10 µg/L. The standard concentration: (a) 0 ng/mL and (b) 1 ng/mL.
Optimization of the strip test
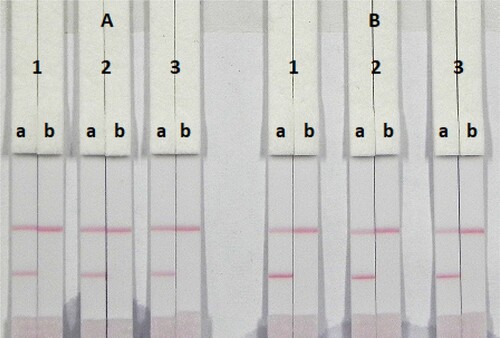
The coating antigen and surfactants were optimized. The strip materials must be hydrophilic and have consistent flow characteristics in the immunochromatographic assay. NC must be hydrophobic. ICA with different coating concentrations (0.05 and 0.1 mg/mL) on the T line were evaluated with 0.01 M PBS (pH 7.4) containing negative (0 ng/mL) or positive (0.5 ng/mL). shows that T red lines appeared with different colour intensities at 0.05 and 0.1 mg/mL. At 0.1 mg/mL the T red lines had a deeper colour intensity than 0.05 mg/mL, suggesting that a more sensitive detection could be achieved at 0.1 mg/mL coating antigen. It is important to choose the appropriate surfactant when developing these assays because not every protein is compatible with every surfactant. In this study, suspension buffer (0.02 M PBS, 5% sucrose, 2% sorbitol, 1% mannitol, 0.1% PEG, 0.1% tween, and 0.04% NaN3) was mixed with two reagents including polyvinylpyrrolidone (PVP) and PEG. Based on , the suspension buffer mix with 5% PEG gave best signal colour on the T line. Therefore, the optimum conditions of our developed assay consisted of 0.1 mg/mL coating antigen and suspension buffer mixed with 5% PEG was carried out in the ICA assay.
Figure 6. Optimization of the ICA test. (A) Coating antigen concentration (0.05 mg/mL) and (B) coating antigen concentration (0.1 mg/mL). (1) suspension buffer; (2) PVP and (3) PEG. (a) Negative (0 ng/mL) and (b) positive (0.5 ng/mL).
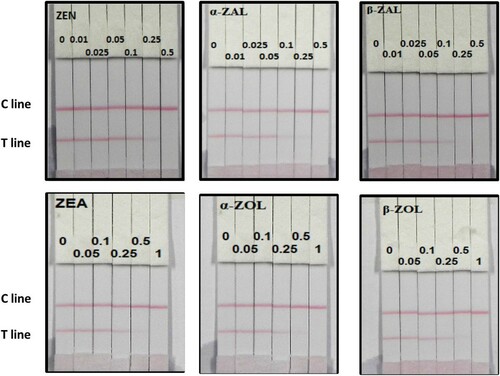
We investigated the sensitivity of the assay using a series of ZEN, α-ZAL, β-ZAL, α-ZOL, β-ZOL, and ZEA standards diluted in 0.01 M PBS (pH 7.4). The LDL was defined as the amount of ZEN, α-ZAL, β-ZAL, α-ZOL, β-ZOL, and ZEA that produced a colour reaction on the strip that was visibly different in intensity from that obtained from ZEN, α-ZAL, β-ZAL, α-ZOL, β-ZOL, and ZEA-negative samples. shows that the signal colour on the T lines changed from strong (0 ng/mL) to weak and completely disappeared at 0.5 ng/mL ZEN, α-ZAL, and β-ZAL, meanwhile 1 ng/mL α-ZOL, β-ZOL, and ZEA.
Figure 7. Colloidal gold immunochromatography assay for ZEN, α-ZAL, β-ZAL, α-ZOL, β-ZOL, and ZEA in 0.01 M PBS (pH 7.4). C line: control line; T line: test line.
Detection of ZEN, α-ZAL, β-ZAL, α-ZOL, β-ZOL, and ZEA in corn flour
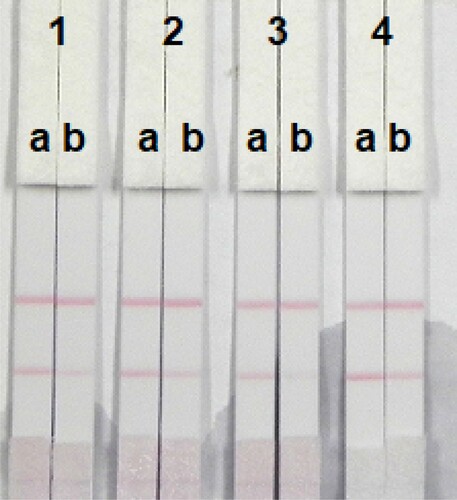
One of the main effects to be considered in developing these assays is the choice of surfactant reagents because the correct reagent is required for the success of the test. In this study, suspension buffer (0.02 M PBS, 5% sucrose, 2% sorbitol, 1% mannitol, 0.1% PEG, 0.1% tween, and 0.04% NaN3) was added to four kinds of reagents, tween-20, brij-35, triton X-100, and Rhodasurf® On-870 (an ethoxylated oleyl alcohol). As shown in , triton X-100 which produced good and stable colour reactions was used for subsequent experiments.
Figure 8. Result of using four kinds of reagent. (1) tween-20; (2) Brij-35; (3) Triton X-100; and (4) On-870. (a) negative (0 ng/mL); (b) positive (20 ng/mL).
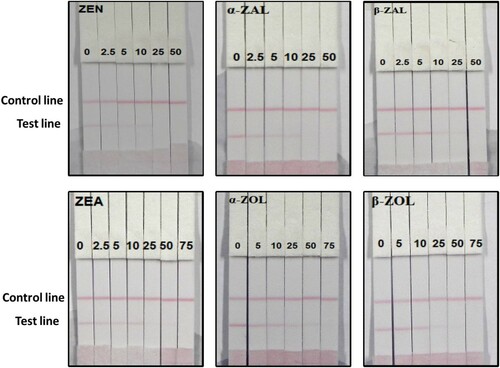
In this study, we determined the matrix effects using corn flour. One of the major advantages of the immunochromatographic strip assay is its rapidity and ease of use. The samples were spiked with ZEN, α-ZAL, β-ZAL, α-ZOL, β-ZOL, and ZEA standard solution (10 µg/mL, prepared with 0.01 M acetonitrile pH 7.4) at final ZEN, α-ZAL, and β-ZAL concentrations of 2.5, 5, 10, 25, and 50 ng/mL, meanwhile, ZEA concentrations of 2.5, 5, 10, 25, 50, and 75 ng/mL, and α-ZOL and β-ZOL concentrations of 5, 10, 25, 50, and 75 ng/mL. Six replicates were determined at each concentration. shows that the colour intensity decreased with an increase in the standard concentrations.
Figure 9. Result of ZEN, α-ZAL, β-ZAL, α-ZOL, β-ZOL, and ZEA in corn flour sample.
Conclusions
A simple and rapid analytical method for simultaneous determination of ZEN, α-ZAL, β-ZAL, α-ZOL, β-ZOL, and ZEA was developed by the lateral-flow immunochromatography assay. Our results demonstrate that quantitative and semi-quantitative utility of the immunochromatography strip assay, with cut-off limits for the semi-quantitative test strip as low as 0.5 ng/mL in 0.01 M PBS (pH 7.4) and 50 ng/mL in corn flour samples for ZEN, α-ZAL, β-ZAL, meanwhile 1 ng/mL in 0.01 M PBS (pH 7.4) and 75 ng/mL in corn flour samples for α-ZOL, β-ZOL, and ZEA and 50 ng/mL. The results were obtained in 10 min. The lateral-flow immunochromatographic assay represents a sensitive and rapid detection method of ZEN, α-ZAL, β-ZAL, α-ZOL, β-ZOL, and ZEA in corn flour.
Disclosure statement
No potential conflict of interest was reported by the authors.
Additional information
Funding
Related Research Data
References
- Anater, A., Manyes, L., Meca, G., Ferrer, E., Luciano, F. B., Pimpao, C. T., & Font, G. (2016). Mycotoxins and their consequences in aquaculture: A review. Aquaculture, 451, 1–10. doi: https://doi.org/10.1016/j.aquaculture.2015.08.022
- Bolechova, M., Benesova, K., Belakova, S., Caslavsky, J., Pospichalova, M., & Mikulikova, R. (2015). Determination of seventeen mycotoxins in barley and malt in the Czech Republic. Food Control, 47, 108–113. doi: https://doi.org/10.1016/j.foodcont.2014.06.045
- Briones-Reyes, D., Gomez-Martinez, L., & Cueva-Rolon, R. (2007). Zearalenone contamination in corn for human consumption in the state of Tlaxcala, Mexico. Food Chemistry, 100(2), 693–698. doi: https://doi.org/10.1016/j.foodchem.2005.10.027
- Cetin, Y., & Bullerman, L. B. (2006). Confirmation of reduced toxicity of deoxynivalenol in extrusion-processed corn grits by the MTT bioassay. Journal of Agricultural and Food Chemistry, 54(5), 1949–1955. doi: https://doi.org/10.1021/jf052443y
- Chang, H., Kim, W., Park, J.-H., Kim, D., Kim, C.-R., Chung, S., & Lee, C. (2017). The occurrence of zearalenone in South Korean feedstuffs between 2009 and 2016. Toxins, 9(7). doi:10.3390/toxins9070223
- Chen, Y., Chen, Q., Han, M., Zhou, J., Gong, L., Niu, Y., … Zhang, L. (2016). Development and optimization of a multiplex lateral flow immunoassay for the simultaneous determination of three mycotoxins in corn, rice and peanut. Food Chemistry, 213, 478–484. doi: https://doi.org/10.1016/j.foodchem.2016.06.116
- Chen, F., Luan, C., Wang, L., Wang, S., & Shao, L. (2017). Simultaneous determination of six mycotoxins in peanut by high-performance liquid chromatography with a fluorescence detector. Journal of the Science of Food and Agriculture, 97(6), 1805–1810. doi: https://doi.org/10.1002/jsfa.7978
- Chen, X., Xu, L., Ma, W., Liu, L., Kuang, H., Wang, L., & Xu, C. (2014). General immunoassay for pyrethroids based on a monoclonal antibody. Food and Agricultural Immunology, 25(3), 341–349. doi: https://doi.org/10.1080/09540105.2013.794328
- De Santis, B., Debegnach, F., Gregori, E., Russo, S., Marchegiani, F., Moracci, G., & & Brera, C. (2017). Development of a LC-MS/MS method for the multi-mycotoxin determination in composite cereal-based samples. Toxins, 9(5). doi:10.3390/toxins9050169
- Ding, X., Liu, L., Song, S., Kuang, H., & Xu, C. (2017). Rapid and ultrasensitive detection of 3-amino-2-oxazolidinone in catfish muscle with indirect competitive enzyme-linked immunosorbent and immunochromatographic assays. Food and Agricultural Immunology, 28(3), 463–475. doi: https://doi.org/10.1080/09540105.2017.1297778
- Du, H., Liu, J., Xun, Y., Liang, J., Li, S., & Chen, G. (2014). Determination of deoxynivalenol, zearalenone, aflatoxin B1, and ochratoxin by an enzyme-linked immunosorbent assay. Analytical Letters, 47(11), 1912–1920. doi: https://doi.org/10.1080/00032719.2014.891125
- Glenn, A. E. (2007). Mycotoxigenic Fusarium species in animal feed. Animal Feed Science and Technology, 137(3–4), 213–240. doi: https://doi.org/10.1016/j.anifeedsci.2007.06.003
- Huang, Y., Xu, Y., He, Q., Chu, J., Du, B., & Liu, J. (2014). Determination of zearalenone in corn based on a biotin-avidin amplified enzyme-linked immunosorbent assay. Food and Agricultural Immunology, 25(2), 186–199. doi: https://doi.org/10.1080/09540105.2012.759540
- Huang, Z.-B., Xu, Y., Li, L.-S., Li, Y.-P., Zhang, H., & He, Q.-H. (2012). Development of an immunochromatographic strip test for the rapid simultaneous detection of deoxynivalenol and zearalenone in wheat and maize. Food Control, 28(1), 7–12. doi: https://doi.org/10.1016/j.foodcont.2012.04.035
- Isanga, J., Mukunzi, D., Chen, Y., Suryoprabowo, S., Liu, L., Kuang, H., & Xu, C. (2017). Development of a monoclonal antibody assay and a lateral flow strip test for the detection of paromomycin residues in food matrices. Food and Agricultural Immunology, 28(3), 355–373. doi: https://doi.org/10.1080/09540105.2016.1272551
- Khaemba, G. W., Tochi, B. N., Mukunzi, D., Joel, I., Guo, L. L., Suryobrobowo, S., … Xu, C. L. (2016). Development of monoclonal antibody and lateral test strip for sensitive detection of clenbuterol and related beta(2)-agonists in urine samples. Food and Agricultural Immunology, 27(1), 111–127. doi: https://doi.org/10.1080/09540105.2015.1079598
- Kim, D.-H., Hong, S.-Y., Kang, J. W., Cho, S. M., Lee, K. R., An, T. K. … Chung, S. H. (2017). Simultaneous determination of multi-mycotoxins in cereal grains collected from South Korea by LC/MS/MS. Toxins, 9(3). doi:10.3390/toxins9030106
- Kong, D., Liu, L., Song, S., Kuang, H., & Xu, C. (2016). Development of ic-ELISA and lateral-flow immunochromatographic assay strip for the detection of folic acid in energy drinks and milk samples. Food and Agricultural Immunology, 27(6), 841–854. doi: https://doi.org/10.1080/09540105.2016.1183600
- Kong, D., Liu, L., Song, S., Suryoprabowo, S., Li, A., Kuang, H., … Xu, C. (2016). A gold nanoparticle-based semi-quantitative and quantitative ultrasensitive paper sensor for the detection of twenty mycotoxins. Nanoscale, 8(9), 5245–5253. doi: https://doi.org/10.1039/C5NR09171C
- Kong, D., Xie, Z., Liu, L., Song, S., Kuang, H., & Xu, C. (2017). Development of ic-ELISA and lateral-flow immunochromatographic assay strip for the detection of vancomycin in raw milk and animal feed. Food and Agricultural Immunology, 28(3), 414–426. doi: https://doi.org/10.1080/09540105.2017.1293014
- Li, X., Li, P., Zhang, Q., Li, R., Zhang, W., Zhang, Z., … Tang, X. (2013). Multi-component immunochromatographic assay for simultaneous detection of aflatoxin B-1, ochratoxin A and zearalenone in agro-food. Biosensors & Bioelectronics, 49, 426–432. doi: https://doi.org/10.1016/j.bios.2013.05.039
- Liu, G., Han, Z., Nie, D., Yang, J., Zhao, Z., Zhang, J., … Wu, A. (2012). Rapid and sensitive quantitation of zearalenone in food and feed by lateral flow immunoassay. Food Control, 27(1), 200–205. doi: https://doi.org/10.1016/j.foodcont.2012.03.023
- Liu, L. Q., Luo, L. J., Suryoprabowo, S., Peng, J., Kuang, H., & Xu, C. L. (2014). Development of an immunochromatographic strip test for rapid detection of ciprofloxacin in milk samples. Sensors, 14(9), 16785–16798. doi: https://doi.org/10.3390/s140916785
- Liu, L., Suryoprabowo, S., Zheng, Q., Song, S., & Kuang, H. (2017a). Development of an immunochromatographic strip for detection of acetamiprid in cucumber and apple samples. Food and Agricultural Immunology, 28(5), 767–778. doi: https://doi.org/10.1080/09540105.2017.1312294
- Liu, L., Suryoprabowo, S., Zheng, Q., Song, S., & Kuang, H. (2017b). Rapid detection of aldicarb in cucumber with an immunochromatographic test strip. Food and Agricultural Immunology, 28(3), 427–438. doi: https://doi.org/10.1080/09540105.2017.1293015
- Majdinasab, M., Sheikh-Zeinoddin, M., Soleimanian-Zad, S., Li, P., Zhang, Q., Li, X., … Li, J. (2015). A reliable and sensitive time-resolved fluorescent immunochromatographic assay (TRFICA) for ochratoxin A in agro-products. Food Control, 47, 126–134. doi: https://doi.org/10.1016/j.foodcont.2014.06.044
- Meneely, J., Fodey, T., Armstrong, L., Sulyok, M., Krska, R., & Elliott, C. (2010). Rapid surface plasmon resonance immunoassay for the determination of deoxynivalenol in wheat, wheat products, and maize-based baby food. Journal of Agricultural and Food Chemistry, 58(16), 8936–8941. doi: https://doi.org/10.1021/jf101517s
- Mukunzi, D., Isanga, J., Suryoprabowo, S., Liu, L., & Kuang, H. (2017). Rapid and sensitive immunoassays for the detection of lomefloxacin and related drug residues in bovine milk samples. Food and Agricultural Immunology, 28(4), 599–611. doi: https://doi.org/10.1080/09540105.2017.1306495
- Ok, H. E., Choi, S.-W., Kim, M., & Chun, H. S. (2014). HPLC and UPLC methods for the determination of zearalenone in noodles, cereal snacks and infant formula. Food Chemistry, 163, 252–257. doi: https://doi.org/10.1016/j.foodchem.2014.04.111
- Pei, S.-C., Lee, W.-J., Zhang, G.-P., Hu, X.-F., Eremin, S. A., & Zhang, L.-J. (2013). Development of anti-zearalenone monoclonal antibody and detection of zearalenone in corn products from China by ELISA. Food Control, 31(1), 65–70. doi: https://doi.org/10.1016/j.foodcont.2012.09.006
- Peng, J., Liu, L., Kuang, H., Cui, G., & Xu, C. (2017). Development of an icELISA and immunochromatographic strip for detection of norfloxacin and its analogs in milk. Food and Agricultural Immunology, 28(2), 288–298. doi: https://doi.org/10.1080/09540105.2016.1263987
- Sadeghi, E., Barkhordar, S., Mohammadi, G., Moradi, M., Asadi, F., Nesari, S., & Sharafi, K. (2016). Determination of zearalenone levels in consumed rice samples in Iran by high performance liquid chromatography (2015). Acta Medica Mediterranea, 32, 1945–1949.
- Serrano, A. B., Font, G., Maes, J., & Ferrer, E. (2016). Dispersive liquid-liquid microextraction for the determination of emerging Fusarium mycotoxins in water. Food Analytical Methods, 9(4), 856–862. doi: https://doi.org/10.1007/s12161-015-0257-9
- Sirot, V., Fremy, J.-M., & Leblanc, J.-C. (2013). Dietary exposure to mycotoxins and health risk assessment in the second French total diet study. Food and Chemical Toxicology, 52, 1–11. doi: https://doi.org/10.1016/j.fct.2012.10.036
- Suryoprabowo, S., Liu, L. Q., Peng, J., Kuang, H., & Xu, C. L. (2015). Antibody for the development of specific immunoassays to detect nadifloxacin in chicken muscles. Food and Agricultural Immunology, 26(3), 317–324. doi: https://doi.org/10.1080/09540105.2014.914469
- Swanson, S. P., Corley, R. A., White, D. G., & Buck, W. B. (1984). Rapid thin layer chromatographic method for determination of zearalenone and zearalenol in grains and animal feeds. Journal Association of Official Analytical Chemists, 67(3), 580–582.