
ABSTRACT
This study aimed to assess oxidative stress and microbiota in pigs at different stocking densities. Markers for oxidative stress were investigated and gut bacteria identified. The pigs were randomly assigned to high-, medium- or low-density groups. The results showed that the superoxide dismutase (SOD) levels in the high- and low-density groups were lower than in the medium-density group. Glutathione peroxidase (GSH-Px) activity was significantly lower in the low-density group and highest in the medium-density group. We found no discrepancies between estimators of bacterial richness across the three groups. The jejunum and ileum were mainly occupied by Firmicutes and Proteobacteria of the classes Bacilli, Clostridia, Erysipelotrichia and Gammaproteobacteria. The ceacum was mainly occupied by Bacteroidetes and Firmicutes of the classes Bacteroidetes, Clostridia and Negativicutes. The results revealed that gut flora was not affected by stocking density. However, stocking density may influence oxidative stress.
Introduction
The productivity of pigs could depend on factors such as stress from the environment and stocking density. Decreased productivity has been seen where pigs exist in large numbers in a relatively small space (Rault, Citation2017; Thomas et al., Citation2016). The post-weaning period is associated with increased stress due to competition, new environments and different types of food (Oh, Choi, Ju, Chung, & Kim, Citation2010).
Although little research has been published in this area, it is known that a high stocking density has a negative effect on the health status of pigs. The current methods for quantifying stress in pigs rely on observable markers, and are therefore not suitable for use with a large sample size (Marco-Ramell et al., Citation2016; Scollo, Gottardo, Contiero, & Edwards, Citation2014). Pigs coexisting at a density of one pig per 0.5 m2 had greater oxidation of plasma proteins and higher levels of stress markers than pigs kept at half this density (Marco-Ramell et al., Citation2011). The identification of biomarkers for stress requires further study, as this is an area in which data quality is poor (Hong, Du, Mukerji, Roper, & Appenzeller, Citation2017).
The impact of animal stocking density on gut flora has not been as widely studied as the impact on growth and wellbeing (Fu et al., Citation2016; Marco-Ramell et al., Citation2011). Gut flora has been proven to be influenced by external factors such as cleanliness at and after birth, how the young are fed, and early birth (Gibson, Crofts, & Dantas, Citation2015). High stocking density may lead to an increase in pathogens that affect the digestive tract, although this is a relatively unstudied subject (Li et al., Citation2017; Weber et al., Citation2015). In this study, we explored the effects of different stocking densities on the expression of markers for oxidative stress and the presence of commensal gut bacteria. The results provide an insight into the relationship between animal stocking density and gut flora.
Materials and methods
Animals and experimental design
The Chinese Guidelines for Animal Welfare and Experimental Protocols were adhered to in the conduct of our research. The protocols used were accepted by the Animal Care and Use Committee of the Institute of Subtropical Agriculture at the Chinese Academy of Sciences. We randomly sampled 288 Duroc × Landrace × Large White male pigs, weighing approximately 40 kg. Their housing area was 19.67 m2 (5.2 m × 3.8 m). They were penned indoors on a farm in Shaoyang, Hunan, China for 30 days at three different housing densities: low density (2.46 m2 per pig), medium density (1.23 m2 per pig) and high density (0.82 m2 per pig). The density of the medium-density group was determined by the local feeding standard. The low-, medium- and high-density pens contained 8, 16 and 24 pigs, respectively. Each density was repeated with six replications. Piglets were housed in a temperature-controlled nursery (25 ± 2°C) under a 12 h light/dark cycle. Access to food and water was kept constant throughout the study in line with NRC (2012) guidelines.
Sampling and sample collection
At the end of the study month, a single pig was chosen randomly from each stocking density so that a blood test could be performed. EDTA-K3 was used as an anticoagulant in 10 mL sampling vials to prevent the blood from coagulating after removal via cava venipuncture. Plasma was separated by centrifugal force (10 min at 2000 g under ambient temperature) and the samples were stored at −80°C until testing. Finally, to allow for the analysis of gut bacteria, the selected pigs were sacrificed after administration of 4% sodium pentobarbital (40 mg/kg BW). The contents of the jejunum, ileum and caecum were collected and stored at −80°C.
Plasma antioxidative capacity
Nanjing Jiancheng Bioengineering Institute (Nanjing, China) supplied the assay kits, and assays were carried out in line with the protocols provided. The levels of glutathione-peroxidase (GSH-Px), malondialdehyde (MDA) and superoxide dismutase (SOD) in the plasma samples were recorded Effects of microencapsulated Lactobacillus plantarum and fructooligosaccharide on growth performance, blood immune parameters, and intestinal morphology in weaned piglets (Fang et al., Citation2017; Liu et al., Citation2017).
DNA extraction and PCR amplification
Genome DNA was extracted from faecal matter with a QIAamp DNA Stool Mini Kit (Qiagen, Hilden, Germany). A NanoDrop ND-1000 spectrophotometer (260–280 nm; NanoDrop Technologies Inc., Wilmington, DE, USA) provided results with a ratio in the range of 1.8–2, indicating that the DNA was of sufficient quality. Amplicons for the high-volume sequencing of bacterial 16S ribosomal RNA were prepared from faecal DNA in solution at a dilution of 50 ng/μl. The PCR method was used to generate V4 sections with 338F (5′-ACT CCT ACG GGA GGC AGC -3′) and 806R (5′-GGA CTA CHV GGG TWT CTA AT-3′) primers as described in our previous report (Kong et al., Citation2016). Pyrosequencing was then performed using the Illumina MiSeq apparatus (Majorbio, Shanghai, China) (Magoc & Salzberg, Citation2011).
Microbial community analysis
QIIME (http://qiime.org/) (Caporaso et al., Citation2010), FLASH (Magoc & Salzberg, Citation2011) and UPARSE pipeline (http://drive5.com/uparse) were used for the analysis of operational taxonomic units (OTUs) with an accuracy of 97% (Caporaso et al., Citation2010). Taxonomic information was appointed to the OTUs via the Ribosomal Database Project (RDP) Classifier (Version 2.2, http://sourceforge.net/projects/rdpclassifier/) (Wang, Garrity, Tiedje, & Cole, Citation2007) and the Greengenes database (http://greengenes.lbl.gov/cgi-bin/nph-index.cgi). The variation in alpha values among the faecal samples was determined using a range of tools, including an abundance-based coverage estimator (ACE), bias-corrected Chao richness estimator, Shannon and Simpson indexes, and Good’s coverage, at a sequence depth of 31,460. The Bray–Curtis distance was used to conduct principal coordinate analysis (PCoA) on the OTUs (Kong et al., Citation2016).
Statistical analysis
The one-way analysis of variance (ANOVA) test was performed with SPSS v20.0 (IBM, USA); we included the standard error of the mean to assess the variation between data sets. Shapiro–Wilk and Levene tests were used to measure how normal the data was and to determine variance homogeneity. The Bray–Curtis distance was calculated to relate samples to each other using the PCoA values of bacterial diversity, which were gained via use of an un-weighted Unifrac metric.
Results
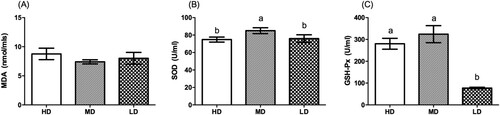
shows that the SOD levels in the low- and high-density groups were significantly lower than in the medium-density group (P < .05). GSH-Px levels were highest in the medium-density group (P < .05) and lowest in the low-density group (P < .05). There was no change in MDA across the groups.
Figure 1. Effects of stocking density on oxidative stress in different groups (n = 6). Different superscripts above the columns indicate statistical difference from each other (P < .05).
The 16S rRNA V4 section was targeted through use of 338F and 806R primers to produce amplicons. shows the production of 1956135 16S rRNA sections, which were produced from 54 samples with a mean length of 437 and 855,374,346 bases of high quality. The number of OTUs in the jejunum samples was 642,700 and 710 for the low- and high-density groups, respectively.
Table 1. Sequencing information of bacterial communities in jejunal, ileum, and caecal samples (n = 6).
Good’s coverage results for the OTUs for the low-, medium- and high-density groups were 99.80 ± 0.09%, 99.85 ± 0.07% and 99.71 ± 0.07%, respectively. Asymptotes were present in the rarefaction curves, meaning there was almost complete sampling of the group. displays the jejunum results. ACE and Chao1 were greatest in the low-density group, Shannon and Coverage were greatest in the medium-density group and Simpson was lowest in the medium-density group. The results from the ileum show that ACE and Chao1 were greatest in the medium-density group, Shannon was greatest in the high-density group, Coverage was greatest in the low-density group and Simpson was lowest in the low-density group. The results from the caecum show that ACE, Chao1 and Coverage were greatest in the medium-density group, and Shannon was highest and Simpson was lowest in the high-density group. Notably, there was no difference in microbial types within gut sections across all three groups (P > .05).
Table 2. Alpha diversity indices of bacterial communities in jejunal, ileum, and caecal samples (n = 6).
shows that in the jejunum, ileum and caecum, principal component analysis (PCA) 1 and 2 showed no separation from each other across all group densities, indicating no variation in the bacteria present. Analysis of similarities (ANOSIM) and non-metric multidimensional scaling (NMDS) tests, centred on Bray–Curtis, were used to compare bacteria types and metabolite profiles (). No differences were found in jejunum, ileum and caecum bacteria across all groups. The ANOSIM results were r = −0.0366, P = .668 for the jejunum, r = 0.0177, P = .337 for the ileum and r = 0.0292, P = .294 for the caecum.
Figure 2. Principal component analysis (PCA) of jejunal, ileum, and caecal samples of different groups (n = 6).
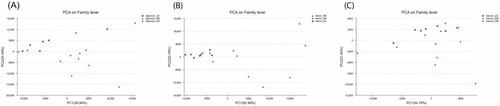
Table 3. ANOSIM analysis of bacterial communities in jejunal, ileum, and caecal samples (n = 6).
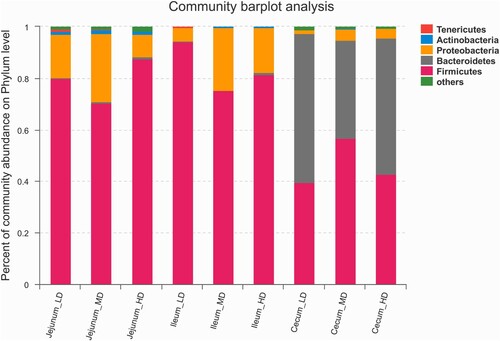
shows the bacterial make-up of each gut section. The jejunum contained predominantly Firmicutes and Proteobacteria, with Actinobacteria and Tenericutes present in lower numbers. Firmicutes and Proteobacteria were also predominant in the ileum, alongside Bacteroidetes, Actinobacteria and Tenericutes. In the caecum, Firmicutes and Proteobacteria dominated, alongside low levels of Actinobacteria and Proteobacteria.
Figure 3. Taxonomic composition of the bacterial communities at the phylum level (n = 6).
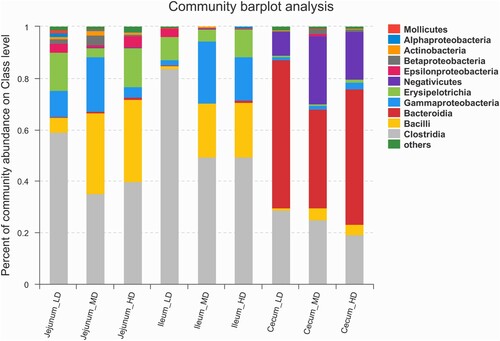
shows that samples taken from the jejunum contained the following classes of bacteria in varying quantities: Actinobacteria, Bacilli, Bacteroidia, Clostridia, Epsilonproteobacteria Erysipelotrichia, Gammaproteobacteria and Negativicutes. The samples taken from the ileum contained the following classes of bacteria in varying quantities: Clostridia, Bacilli, Gammaproteobacteria, Erysipelotrichia, Actinobacteria, Bacteroidia, Negativicutes and Epsilonproteobacteria. The samples taken from the cecum contained the following classes of bacteria in varying quantities: Bacilli, Bacteroidia, Betaproteobacteria, Clostridia, Epsilonproteobacteria, Erysipelotrichia, Gammaproteobacteria and Negativicutes.
Figure 4. Taxonomic composition of the bacterial communities at the class level of jejunal, ileum, and caecal samples (n = 6).
Clostridium sensu stricto (OTU726), Erysipelotrichaceae (OTU7), Peptostreptococcaceae (OTU695), Streptococcus (OTU691), Lactobacillus johnsonii (OTU688) and Escherichia shigella (OTU690) were found in high numbers in the jejunal sample. Clostridium sensu stricto (OTU726) and Corynebacterium (OTU696) levels were greater in the low-density group (P < .05). The medium-density group had the highest level of Escherichia shigella (OTU690) (P < .05). Erysipelotrichaceae (OTU7), Streptococcus (OTU691) and Lactobacillus johnsonii (OTU688) levels were highest in the high-density group (P < .05) ().
Figure 5. Effects of stocking density on bacterial communities at the OTU level of (A) jejunal, (B) ileum, and (C) caecal samples (n = 6).
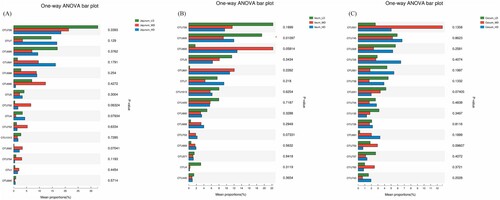
Clostridium sensu stricto (OTU726), Peptostreptococcaceae (OTU695), Escherichia shigella (OTU690), Peptostreptococcaceae (OTU5), Streptococcus (OTU691), and Erysipelotrichaceae (OTU7) were found in high numbers in the ileum samples. Levels of Clostridium sensu stricto (OTU726), Peptostreptococcaceae (OTU695) and Peptostreptococcaceae (OTU5) were greatest in the low-density group (P < .05). Levels of Escherichia shigella (OTU690) were greatest in the medium-density group (P < .05) and the level of Erysipelotrichaceae (OTU7) was greatest in the high-density group (P < .05).
Megasphaera elsdenii DSM 20460 (OTU531), Bacteroidetes S247 group (OTU475), Prevotella 9 (OTU328), Phascolarctobacterium (OTU725), Prevotella 9 OTU551, and Prevotella 9 (OTU739) were found in high numbers in the caecum samples. Levels of Prevotella 9 (OTU328) and Prevotella 9 (OTU739) were greatest in the low-density group (P < .05). Megasphaera elsdenii (OTU531) levels were greatest in the medium-density group (P < .05). Bacteroidetes S247 (OTU745), Phascolarctobacterium (OTU725) and Prevotella 9 (OTU551) levels were greatest in the high-density group (P < .05).
Discussion
Superoxide, hydrogen peroxide, nitric oxide and hydroxyl radicals can be eradicated by antioxidant enzymatic processes when present in excess (Chen, Liu, Zhu, Xu, & Li, Citation2010; Xu, Yang, Gao, Zhang, & Tao, Citation2017). These reactive oxygen species (ROS) can be “cleaned up” by SOD and GSH-Px. This antioxidant activity degrades SOD into hydrogen peroxide, which works in combination with GSH-Px to convert water through enzymatic activity (Veskoukis, Tsatsakis, & Kouretas, Citation2012; Zhang et al., Citation2013). SOD activity was lowest in the low- and high-density groups. GSH-Px levels were lowest in the low-density group and highest in the medium-density group. MDA levels are a reflection of the peroxidation of lipids, which is a result of exhausted antioxidant defences (Dutta, Nenavathu, Gangishetty, & Reddy, Citation2012; Peng, Liu, Kuang, Cui, & Xu, Citation2017). This tends to happen when ROS levels are elevated. We found no discrepancies in MDA quantities between groups. In addition, removal of ROS was observed to be greatest in the medium-density group.
Human immune system functioning and our ability to metabolize nutrients is influenced by the make-up of our gut bacteria. “Good” bacteria can help maintain a healthy gut that is free of disease (Duenas et al., Citation2015; Faith et al., Citation2013; Wang et al., Citation2017). Pigs are the best model for the human digestive system (apart from primates) as they closely reflect our physiology and nutritional needs, possess similar gut flora and are affected by some dysfunctions of the gut that are also found in humans (Heinritz, Mosenthin, & Weiss, Citation2013; Liu et al., Citation2016; Roura et al., Citation2016). Interestingly, there were no discrepancies among alpha diversity indicators, leading to the conclusion that the three gut sections investigated contained the same array of bacteria.
Up to a third of infant diarrhoea cases in pigs are a result of highly infectious gut bacteria (namely Escherichia coli) producing enterotoxins, which attach to enterocytes (Dalla-Costa, Irino, Rodrigues, Rivera, & Trabulsi, Citation1998; Duan et al., Citation2012). We found the highest levels of Escherichia shigella in the jejunum and ileum of the medium-density group, even though diarrhoea cases were equally prevalent across the three groups (data not shown).
The short-chain fatty acids generated by bacteria in the caecum provide up to a third of pigs’ energy resources (Zijlstra, Jha, Woodward, Fouhse, & van Kempen, Citation2012). Actinobacteria, Bacteroidetes, Firmicutes and Proteobacteria were all predominant in the samples taken from the caecum. Proteobacteria have been shown to be present in higher levels in the faeces of pregnant women toward the end of the pregnancy (Koren et al., Citation2012). Gastroenteritis is related to raised levels of Proteobacteria, or gut flora disequilibrium following a reaction to changes in the environment and genetics (Carvalho et al., Citation2012; Mukhopadhya, Hansen, El-Omar, & Hold, Citation2012).
Poor attention to animal welfare and ethics can have large monetary consequences. The results of this study show that a medium housing density causes the least damage by oxidative stress. Variations in density did not result in gut flora differences across groups in terms of the five main phyla identified (Actinobacteria, Bacteroidetes, Firmicutes, Proteobacteria and Tenericutes). The relationship between gut flora and antioxidant action should be investigated in more detail.
Author contributions
G.L., X.X., X.W., and Y.Y. conceived the experiments, L.L., X.L., D.W., G.L., Y.L., and X.W. conducted the experiments, L.L., S.C., G.L., and X.K. analyzed the results. L.L., S.C.,G.L., and S.W.K. prepared the manuscript. All authors reviewed the manuscript.
Disclosure statement
No potential conflict of interest was reported by the authors.
ORCID
Gang Liu http://orcid.org/0000-0002-9475-5134
Additional information
Funding
References
- Caporaso, J. G., Kuczynski, J., Stombaugh, J., Bittinger, K., Bushman, F. D., Costello, E. K., … Knight, R. (2010). QIIME allows analysis of high-throughput community sequencing data. Nature Methods, 7(5), 335–336. doi: https://doi.org/10.1038/nmeth.f.303
- Carvalho, F. A., Koren, O., Goodrich, J., Johansson, M. V., Nalbantoglu, I., Aitken, J., … Gewirtz, A. (2012). Transient inability to manage Proteobacteria promotes chronic gut inflammation in TLR5-deficient mice. Cell Host & Microbe, 12(2), 139–152. doi: https://doi.org/10.1016/j.chom.2012.07.004
- Chen, H., Liu, L.-j., Zhu, J.-j., Xu, B., & Li, R. (2010). Effect of soybean oligosaccharides on blood lipid, glucose levels and antioxidant enzymes activity in high fat rats. Food Chemistry, 119(4), 1633–1636. doi: https://doi.org/10.1016/j.foodchem.2009.09.056
- Dalla-Costa, L. M., Irino, K., Rodrigues, J., Rivera, I. N. G., & Trabulsi, L. R. (1998). Characterisation of diarrhoeagenic Escherichia coli clones by ribotyping and ERIC-PCR. Journal of Medical Microbiology, 47(3), 227–234. doi: https://doi.org/10.1099/00222615-47-3-227
- Duan, Q. D., Zhou, M., Zhu, X., Bao, W., Wu, S., Ruan, X., … Zhu, G. (2012). The flagella of F18ab Escherichia coli is a virulence factor that contributes to infection in a IPEC-J2 cell model in vitro. Veterinary Microbiology, 160(1-2), 132–140. doi: https://doi.org/10.1016/j.vetmic.2012.05.015
- Duenas, M., Muñoz-González, I., Cueva, C., Jiménez-Girón, A., Sánchez-Patán, F., Santos-Buelga, C., & Bartolomé, B. (2015). A survey of modulation of gut microbiota by dietary polyphenols. Biomed Research International, 2015, 1–15. doi: https://doi.org/10.1155/2015/850902
- Dutta, R. K., Nenavathu, B. P., Gangishetty, M. K., & Reddy, A. V. R. (2012). Studies on antibacterial activity of ZnO nanoparticles by ROS induced lipid peroxidation. Colloids and Surfaces B: Biointerfaces, 94, 143–150. doi: https://doi.org/10.1016/j.colsurfb.2012.01.046
- Faith, J. J., Guruge, J. L., Charbonneau, M., Subramanian, S., Seedorf, H., Goodman, A. L., … Gordon, J. I. (2013). The long-term stability of the human gut microbiota. Science, 341(6141), 1237439. doi: https://doi.org/10.1126/science.1237439
- Fang, J., Martínez, Y., Deng, C., Zhu, D., Peng, H., Jiang, H., & Li, A. (2017). Effects of dietary enzymolysis products of wheat gluten on the growth performance, serum biochemical, immune, and antioxidant status of broilers. Food and Agricultural Immunology, 28(6), 1155–1167.
- Fu, L. L., Li, H., Liang, T., Zhou, B., Chu, Q., Schinckel, A. P., … Huang, R. (2016). Stocking density affects welfare indicators of growing pigs of different group sizes after regrouping. Applied Animal Behaviour Science, 174, 42–50. doi: https://doi.org/10.1016/j.applanim.2015.10.002
- Gibson, M. K., Crofts, T. S., & Dantas, G. (2015). Antibiotics and the developing infant gut microbiota and resistome. Current Opinion in Microbiology, 27, 51–56. doi: https://doi.org/10.1016/j.mib.2015.07.007
- Heinritz, S. N., Mosenthin, R., & Weiss, E. (2013). Use of pigs as a potential model for research into dietary modulation of the human gut microbiota. Nutrition Research Reviews, 26(2), 191–209. doi: https://doi.org/10.1017/S0954422413000152
- Hong, B. N., Du, Y., Mukerji, P., Roper, J. M., & Appenzeller, L. M. (2017). Safety assessment of food and feed from GM crops in Europe: Evaluating EFSA’s alternative framework for the rat 90-day feeding study. Journal of Agricultural and Food Chemistry, 65(27), 5545–5560. doi: https://doi.org/10.1021/acs.jafc.7b01492
- Kong, X.-F., Ji, Y.-j., Li, H.-w., Zhu, Q., Blachier, F., Geng, M.-m., & Yin, Y.-l. (2016). Colonic luminal microbiota and bacterial metabolite composition in pregnant Huanjiang mini-pigs: Effects of food composition at different times of pregnancy. Scientific Reports, 6, 1–14. doi:10.1038/srep37224 doi: https://doi.org/10.1038/s41598-016-0001-8
- Koren, O., Goodrich, J., Cullender, T., Spor, A., Laitinen, K., Kling Bäckhed, H., … Ley, R. (2012). Host remodeling of the gut microbiome and metabolic changes during pregnancy. Cell, 150(3), 470–480. doi: https://doi.org/10.1016/j.cell.2012.07.008
- Li, J. H., Miao, Z., Tian, W., Yang, Y., Wang, J., & Yang, Y. (2017). Effects of different rearing systems on growth, small intestinal morphology and selected indices of fermentation status in broilers. Animal Science Journal, 88(6), 900–908. doi: https://doi.org/10.1111/asj.12697
- Liu, G., Guan, G., Fang, J., Martínez, Y., Chen, S., Bin, P., & Yin, Y. (2016). Macleaya cordata extract decreased diarrhea score and enhanced intestinal barrier function in growing piglets. Biomed Research International, 2016, 1–7. doi: https://doi.org/10.1155/2016/1069585
- Liu, G., Yu, L., Fang, J., Hu, C. A., Yin, J., Ni, H., … Yin, Y. (2017). Methionine restriction on oxidative stress and immune response in dss-induced colitis mice. Oncotarget, 8(27), 44511–44520.
- Magoc, T., & Salzberg, S. L. (2011). FLASH: Fast length adjustment of short reads to improve genome assemblies. Bioinformatics, 27(21), 2957–2963. doi: https://doi.org/10.1093/bioinformatics/btr507
- Marco-Ramell, A., Arroyo, L., Peña, R., Pato, R., Saco, Y., Fraile, L., … Bassols, A. (2016). Biochemical and proteomic analyses of the physiological response induced by individual housing in gilts provide new potential stress markers. Bmc Veterinary Research, 12, 1835. doi: https://doi.org/10.1186/s12917-016-0887-1
- Marco-Ramell, A., Pato, R., Peña, R., Saco, Y., Manteca, X., Ruiz de la Torre, J. L., & Bassols, A. (2011). Identification of serum stress biomarkers in pigs housed at different stocking densities. The Veterinary Journal, 190(2), e66–e71. doi: https://doi.org/10.1016/j.tvjl.2011.01.003
- Mukhopadhya, I., Hansen, R., El-Omar, E. M., & Hold, G. L. (2012). IBD—what role do Proteobacteria play? Nature Reviews Gastroenterology & Hepatology, 9(4), 219–230. doi: https://doi.org/10.1038/nrgastro.2012.14
- Oh, H. K., Choi, H. B., Ju, W. S., Chung, C. S., & Kim, Y. Y. (2010). Effects of space allocation on growth performance and immune system in weaning pigs. Livestock Science, 132(1–3), 113–118. doi: https://doi.org/10.1016/j.livsci.2010.05.009
- Peng, J., Liu, L., Kuang, H., Cui, G., & Xu, C. (2017). Development of an icELISA and immunochromatographic strip for detection of norfloxacin and its analogs in milk. Food and Agricultural Immunology, 28(2), 288–298. doi: https://doi.org/10.1080/09540105.2016.1263987
- Rault, J. L. (2017). Social interaction patterns according to stocking density and time post-mixing in group-housed gestating sows. Animal Production Science, 57(5), 896–902. doi: https://doi.org/10.1071/AN15415
- Roura, E., Koopmans, S.-J., Lallès, J.-P., Le Huerou-Luron, I., de Jager, N., Schuurman, T., & Val-Laillet, D. (2016). Critical review evaluating the pig as a model for human nutritional physiology. Nutrition Research Reviews, 29(1), 60–90. doi: https://doi.org/10.1017/S0954422416000020
- Scollo, A., Gottardo, F., Contiero, B., & Edwards, S. A. (2014). Does stocking density modify affective state in pigs as assessed by cognitive bias, behavioural and physiological parameters? Applied Animal Behaviour Science, 153, 26–35. doi: https://doi.org/10.1016/j.applanim.2014.01.006
- Thomas, L. L., Goodband, R. D., Tokach, M. D., DeRouchey, J. M., Woodworth, J. C., & Dritz, S. S. (2016). Effects of stocking density on finishing pig growth performance. Journal of Animal Science, 94, 54–54. doi: https://doi.org/10.2527/msasas2016-115
- Veskoukis, A. S., Tsatsakis, A. M., & Kouretas, D. (2012). Dietary oxidative stress and antioxidant defense with an emphasis on plant extract administration. Cell Stress and Chaperones, 17(1), 11–21. doi: https://doi.org/10.1007/s12192-011-0293-3
- Wang, W., Chen, J., Zhou, H., Wang, L., Ding, S., Wang, Y., & Li, A. (2017). Effects of microencapsulated Lactobacillus plantarum and fructooligosaccharide on growth performance, blood immune parameters, and intestinal morphology in weaned piglets. Food and Agricultural Immunology, 1–11. doi: https://doi.org/10.1080/09540105.2017.1360254
- Wang, Q., Garrity, G. M., Tiedje, J. M., & Cole, J. R. (2007). Naive Bayesian classifier for rapid assignment of rRNA sequences into the new bacterial taxonomy. Applied and Environmental Microbiology, 73(16), 5261–5267. doi: https://doi.org/10.1128/AEM.00062-07
- Weber, N., Nielsen, J. P., Jakobsen, A. S., Pedersen, L.-L., Hansen, C. F., & Pedersen, K. S. (2015). Occurrence of diarrhoea and intestinal pathogens in non-medicated nursery pigs. Acta Veterinaria Scandinavica, 57, 64. doi: https://doi.org/10.1186/s13028-015-0156-5
- Xu, W., Yang, M., Gao, J., Zhang, Y., & Tao, L. (2017). Oxidative stress and DNA damage induced by spinosad exposure in Spodoptera frugiperda Sf9 cells. Food and Agricultural Immunology, 2017, 1–11. doi: https://doi.org/10.1080/09540105.2017.1364708
- Zhang, H. Y., Piao, X. S., Zhang, Q., Li, P., Yi, J. Q., Liu, J. D., … Wang, G. Q. (2013). The effects of Forsythia suspensa extract and berberine on growth performance, immunity, antioxidant activities, and intestinal microbiota in broilers under high stocking density. Poultry Science, 92(8), 1981–1988. doi: https://doi.org/10.3382/ps.2013-03081
- Zijlstra, R. T., Jha, R., Woodward, A. D., Fouhse, J., & van Kempen, T. A. T. G. (2012). Starch and fiber properties affect their kinetics of digestion and thereby digestive physiology in pigs. Journal of Animal Science, 90, 49–58. doi: https://doi.org/10.2527/jas.53718