
ABSTRACT
A sensitive monoclonal antibody (mAb) (1H1) against fumonisin B1 (FB1) was produced in our laboratory. A rapid, simple, and an immunochromatographic strip has been developed for the ultrasensitive detection of FB1 in corn samples. Under the optimized condition, the cut-off limits of test strips for FB1 were found to be 50 ng/mL in 0.01 M PBS and 25 ng/mL in corn samples. Results could be obtained within 5 min. The results revealed that the developed method is a rapid, sensitive, and simple tool for the detection of FB1.
Introduction
Fumonisins () are a group of mycotoxins derived from many Fusarium species, mostly from Fusarium proliferatum and Fusarium verticillioides which are a structurally related group of a long carbon chain compound (Sydenham et al., Citation1996; Yoshizawa, Yamashita, & Luo, Citation1994). Fumonisin analogues have been identified and classified into fumonisin A1, A2, B1, B2, B3, and B4 based on their chemical structure. Since fumonisins are alkaloids and polar compounds, they can be dissolved in water, methanol, ethanol, and acetonitrile (Liu, Chen, Fu, & Shih, Citation2005; Muscarella, Magroa, Nardiello, Palermo, & Centonze, Citation2008)
Figure 1. Chemical structure of fumonisins: (1) fumonisin B1; (2) fumonisin B2; (3) fumonisin B3; and (4) fumonisin B4.
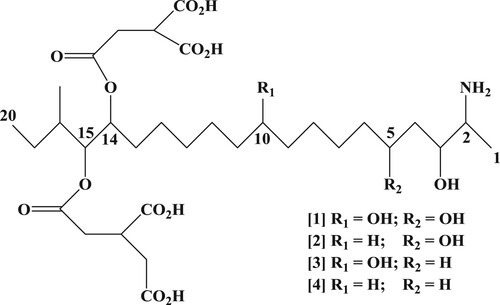
Fumonisin B1 (FB1), fumonisin B2 (FB2), and fumonisin B3 (FB3) are the most abundant naturally occurring analogues (Bacon & Nelson, Citation1994). The most investigated fumonisin is FB1 which can cause leukoencephalomalacia in horses, pulmonary oedema in pigs, nephrotoxicity, liver cancer in rats, and oesophageal cancer in humans (Nelson, Plattner, Shackelford, & Desjardins, Citation1991). Many kinds of cereals such as corn, sorghum, rice, and wheat are known to be infected by Fusarium species and produce fumonisins, particularly corn crops (Berthiller et al., Citation2017; Scott, Citation2012).
The effect on human health has been proved, the regulations for fumonisins only in America and Swiss that have recommended levels. The America advisory level for FB1, FB2, and FB3 in corn and corn products for human consumption ranges from 2 to 4 ppm; meanwhile in Swiss fumonisins in corn and corn products for human consumption is 1 ppm (Wang, Quan, Lee, & Kennedy, Citation2006; Zheng, Richard, & Binder, Citation2006).
Fumonisins contamination can be determined in a variety of ways to provide qualitative and/or quantitative data. Proper sampling procedures are a pre-requisite for obtaining reliable results because of the heterogeneous distribution of mycotoxins in grains (Whitaker et al., Citation1998). The most used chromatographic procedures include high-performance liquid chromatography (HPLC; de Oliveira, de Castro Gomes Vieira, Orlando, & Faria, Citation2017; Jaksic et al., Citation2015; Kaltner, Rampl, Rychlik, Zimmermann, & Rohe, Citation2017), thin-layer chromatography (TLC; Dupuy, Lebars, Lebars, & Boudra, Citation1993; Preis & Vargas, Citation2000), liquid chromatography tandem mass spectrometry (LC-MS; Wang, Dong, et al., Citation2016), and gas chromatography – mass spectrometry (GC; Pestka et al., Citation1994). TLC is now rarely used because of its low sensitivity and specificity (Khaemba et al., Citation2016; Suryoprabowo, Liu, Peng, Kuang, & Xu, Citation2015). HPLC and LC-MS/MS are the methods that are most frequently used due to high sensitivity and accuracy, but these methods have disadvantages as they are complex, time-consuming, and labour intensive (Isanga et al., Citation2017; Liu, Suryoprabowo, Zheng, Song, & Kuang, Citation2017).
Immunochemical methods for fumonisins based on direct and indirect competitive enzyme-linked immunosorbent assays (ELISA) have been developed (Rodriguez-Cervantes et al., Citation2013; Wang, Bao, et al., Citation2016; Zou et al., Citation2014). ELISA is very useful in cases when high amounts of samples have to be tested. It has high specificity, requires simple sample preparation steps, and is cost effective (Ding, Liu, Song, Kuang, & Xu, Citation2017; Kong et al., Citation2017; Wang et al., Citation2017; Xie, Kong, Liu, Song, & Kuang, Citation2017). However, a long analysis time is needed because of the required incubation time for enzyme–substrate reactions, which is not suitable for detection on-site.
The lateral flow immunochromatographic assay is very popular in the detection of residues because it is simple, rapid (can be performed in 5–10 min), specific, and sensitive (Liu et al., Citation2014; Mukunzi, Isanga, Suryoprabowo, Liu, & Kuang, Citation2017; Suryoprabowo, Liu, Peng, Kuang, & Xu, Citation2015). The aim of this study was to develop a lateral flow immunochromatographic test strip for the detection of FB1 in corn.
Materials and methods
Chemicals and reagents
FB1 was purchased from J&K Scientific (Shanghai, China). Complete Freund’s adjuvant (FCA), incomplete Freund’s adjuvant (FIA), and enzyme immunoassay-grade horseradish peroxidase (HRP)-labelled goat anti-mouse immunoglobulin were obtained from Sigma (St. Louis, MO, USA). Gelatin was supplied by Beijing Biodee Biotechnology Co., Ltd. (Beijing, China). Tetramethylbenzidine and HRP were acquired from Aladdin Chemistry Co., Ltd. (Shanghai, China). All reagents used for cell fusion were purchased from Sunshine Biotechnology Co., Ltd. (Nanjing, China). Bovine serum albumin (BSA) and keyhole-limpet haemocyanin (KLH) were obtained from Solarbio Science & Technology, Co, Ltd. (Beijing, China). All other reagents and chemicals were supplied by the National Pharmaceutical Group Chemical Reagent Co, Ltd. (Shanghai, China).
Nitrocellulose (NC) high-flow plus membranes (Pura-bind RP) were obtained from Whatman-Xinhua Filter Paper Co., Ltd. (Hangzhou, China). Glass fibre membrane (CB-SB08) used for the sample pad, polyvinylchloride (PVC) backing material, and absorbance pad (SX18) were supplied by Goldbio Tech Co., Ltd. (Shanghai, China). A BioDot TSR 3000 Membrane Strip Reader (Gene Company Limited, Shanghai Branch, Shanghai, China) was used to test the colour intensities of colloidal gold on the test zone. The complete Freund’s adjuvant (FCA), incomplete Freund’s adjuvant (FIA), and enzyme immunoassay-grade HRP-labelled goat anti-mouse immunoglobulin were obtained from Sigma (St. Louis, MO, USA) and specific monoclonal antibodies (anti-FB1 monoclonal antibody (mAb), 1H1) were generated in our laboratory.
All buffer solutions were prepared using ultrapure water (Milli-Q purification system, Millipore Co., Bedford, MA, USA). The strip cutting instrument was CM4000 (Gene, Shanghai, China), and the dispensers were Airjet Quanti 3000™ and Biojet Quanti 3000™ (XinqidianGene-technology Co., Ltd., Beijing, China).
Preparation and characterization of anti-FB1 monoclonal antibody
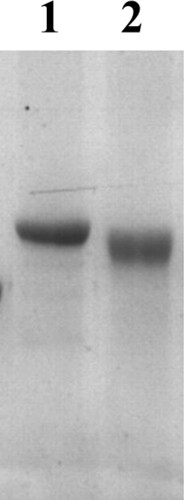
FB1 was conjugated to KLH or BSA () according to previous reports (Christensen, Yu, & Chu, Citation2000; Wang et al., Citation2014). KLH or BSA was dissolved in phosphate-buffered saline (PBS; 0.01 M, pH 7.4) into 10 mg/mL and dialysed at 4°C for 24 h in 0.01 M PBS (pH 7.4) containing 0.2% glutaraldehyde (GA) (v/v). The dialysis bag was then transferred to 0.01 M PBS overnight to remove the free GA. FB1 was added to the dialysis, stirred at 4°C overnight. Tris was then added to the mixture and stirred again for 2 h. In the end, the mixture was dialysed against 0.01 M PBS at 4°C for 3 days, and stored at −20°C. All the products were characterized by SDS-PAGE.
Figure 2. The SDS-PAGE image of FB1–BSA (1) and BSA (2).
Female BALB/c mice (6–8 weeks old) were used to produce the monoclonal antibody (mAb). The mice were immunized subcutaneously with the FB1–KLH conjugate. The first immunization using FCA and FIA was used in the subsequent boost injection. The mice were immunized every three weeks using 100 µg for the first immunization and 50 µg for the remaining (2 to 5 immunizations). We analysed the antibodies in blood samples of mice analyzed by ELISA and the mouse with the highest titre was scarified and its splenocytes were fused with Sp 2/0 murine myeloma cells, and the hybridomas were then screened with an indirect ELISA. The selected hybridoma cells were expanded and injected into BALB/c mice to produce the mAb (Deng et al., Citation2012; Suryoprabowo, Liu, Peng, Kuang, & Xu, Citation2014). The ascites was harvested and purified with the caprylic acid-ammonium sulfate precipitation method (Kuang et al., Citation2013). The purified antibody solution was stored at −20°C until further use.
Development of the immunochromatographic strip
Preparation of colloidal gold nanoparticles
All the solvents were prepared with ultrapure water and passed through a 0.22-µm filter membrane. Chloroauric acid (0.1 g/L, 25 mL) was heated to boiling under constant stirring. Following the addition of 1.0 mL of 1% w/v sodium citrate tribasic dehydrate, the mixture was stirred for 30 min. When the colour of the solution turned wine-red, it was allowed to cool to room temperature, and stored at 4°C. Observations by transmission electron microscopy revealed that the gold nanoparticles (GNPs) had a nearly uniform particle size of 15 nm.
Preparation of colloidal gold-labelled mAb
We used anti-FB1 mAb (1H1) with a half-maximal inhibitory concentration (IC50) of 5 ng/mL. Colloidal GNP solution (10 mL) was adjusted to pH 7.0 with 0.1 M K2CO3 (40 µL). Briefly, mAbs (0.40 mL) were added to colloidal GNP solution dropwise. After 35 min, 1 mL of 10% (w/v) BSA was added, and the mixture was stirred for 2 h. The product was centrifuged at 8000 rpm for 45 min to remove any gold aggregates. The solution was separated into two layers; the lower layer (gold-labelled mAbs) was rinsed with 0.02 M phosphate buffer containing 5% sucrose, 1% BSA, and 0.5% polyethylene glycol (PEG) 6000 (pH 7.4). The conjugation products were reconstituted to 1 mL using gold-labelling resuspension buffer (0.02 M PBS, 5% sucrose, 2% sorbitol, 1% mannitol, 0.1% PEG, 0.1% tween, and 0.04% NaN3) and stored at 4°C.
Test procedure and principle
Prior to the test, of gold labelled mAbs (50 µL) was mixed with sample solution (150 µL), allowed to react for about 5 min, and added onto the sample pad. The solution migrated along the absorbent pad, and the test results are visualized within 5 min. In FB1-positive samples, FB1 competes with FB1–BSA conjugates embedded in the test (T) line for the finite amount of anti-FB1 mAb. When a sufficient amount of FB1 is present, free FB1 binds to gold-labelled mAb, preventing mAb from binding to FB1–BSA in the T line. Therefore, the higher the FB1 content in the sample, the weaker the colour of the T line. In FB1-negative samples, the limited amount of colloidal gold-labelled mAb is trapped by the immobilized FB1–BSA conjugate, and a clearly visible red T line appears.
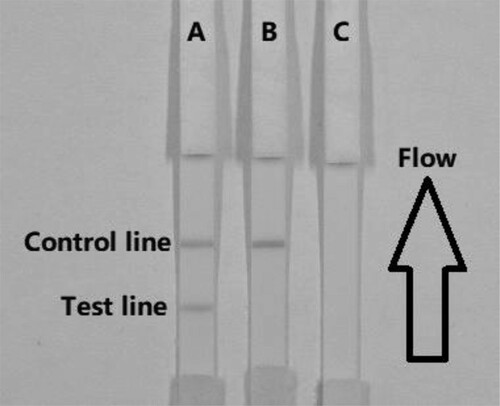
The sample must reach the control (C) line, which contains goat anti-mouse IgG antibody. Therefore, the C line must always appear in a successful test, whereas the T line will only appear when the sample is negative ((A)). The appearance of the C line alone is indicative that FB1 is present ((B)), whereas if neither the C line nor the T line appears ((C)), the test procedure is incorrect or the strip is invalid, indicating that the test should be repeated with a new strip.
Figure 3. Illustration of typical strip test results. Negative sample (A), a positive result (B), and invalid result if the control and test lines do not appear (C).
Determination of performance
Sensitivity of the test strip
The sensitivity of the test strip was determined by testing FB1-containing samples. FB1 standard was diluted to 0, 1, 2.5, 5, 10, 25, and 50 ng/mL in 0.01 M PBS (pH 7.4), and the detection limit was determined. The sample solution (150 µL) was mixed with gol-labelled mAb (50 µL), allowed to react for 5 min, and applied onto the sample pad. After 5 min, the color intensities of the different strips were recorded using a test strip reader. The lowest detection limit (LDL) that could be detected by the naked eye was defined as the amount of FB1 that produced a colour reaction on the strip that was visibly different in intensity from that obtained from 0 ng/mL FB1. Six replicates for each concentration were analysed on the same day.
Detection of FB1 in corn
We obtained corn from a local market. To 5 g of finely ground corn samples 25 mL of 70% methanol was added. The supernatant was obtained and diluted 10× with 0.01 M PBS (pH 7.4), and the samples were spiked with FB1 solution (10 µg/mL, prepared with 0.01 M PBS, pH 7.4). The FB1 concentrations in the corn sample were 0 (control), 0.5, 1, 2.5, 5, 10, and 25 ng/mL. Six replicates for each concentration were analysed using the test strips.
Results and discussion
Optimization of the strip test
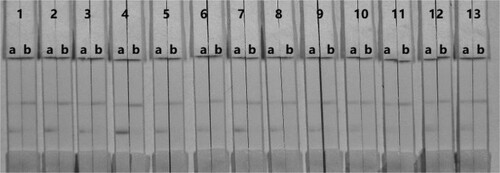
The materials for the strip test must be hydrophilic and have consistent flow characteristics in the immunochromatographic assay. NC must be hydrophobic; however, it can be rendered hydrophilic with the addition of surfactants. It is important to choose the appropriate surfactant when developing these assays because not every protein is compatible with every surfactant. In this study, suspension buffer (0.02 M PBS, 5% sucrose, 2% sorbitol, 1% mannitol, 0.1% PEG, 0.1% tween, and 0.04% NaN3) was added to 12 kinds of reagent (polyvinylpyrrolidone [PVP], polyethylene glycol [PEG], BSA, casein, sucrose, trehalose, sorbitol, mannitol, tween-20, brij-35, triton X-100, and Rhodasurf® On-870 [an ethoxylated oleyl alcohol]). As shown in , reagent BSA produced the best and most stable colour reactions and was used for the subsequent experiment.
Figure 4. Result of using 13 kinds of surfactants. 1 = suspension buffer, 2 = PVP, 3 = PEG, 4 = BSA, 5 = casein, 6 = sucrose, 7 = trehalose, 8 = sorbitol, 9 = mannitol, 10 = tween-20, 11 = Brij-35, 12 = Triton X-100, and 13 = On-870. (a) negative (0 ng/mL). (b) positive (50 ng/mL).
The concentration of mAbs in GNPs and of the coating antigen affects the sensitivity of the assay. Two different concentrations of mAbs (8 and 10 µg/L) were allowed to react with FB1-negative samples (0 ng/mL) and FB1-positive samples (5 ng/mL). shows that there were significant differences in colour intensity between 8 and 10 µg/L. We observed that the optimum concentration of mAb in GNP was 10 µg/L based on the colour intensities on both lines (FB1-positive and FB1-negative samples).
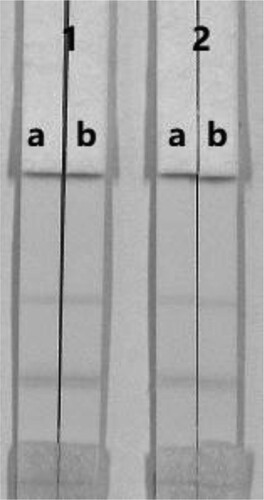
Figure 5. Optimization of the immunochromatographic strip. The dosage of the mAb that was added to the GNPs: (1) 10 µg/L; (2) 8 µg/L. (a) negative (0 ng/mL). (b) positive (5 ng/mL).
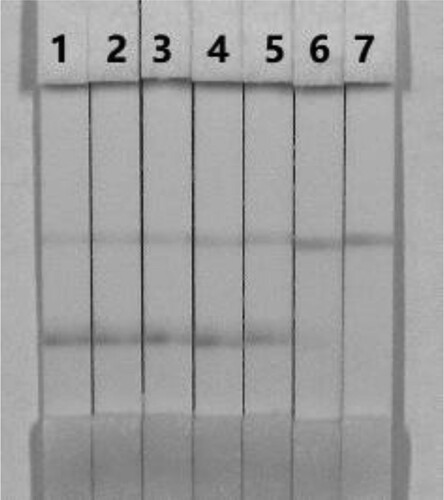
The sensitivity of the assay was investigated with a series FB1 standards diluted in using 0.01 M PBS (pH 7.4). The LDL with naked eyes was obtained at the amount of FB1 producing a significant difference in colour intensity of the test strip in comparison with negative control (no FB1 added). shows that the signal colour on the test lines changes from strong (0 ng/mL) to weak and finally disappeared completely at 50 ng/mL FB1.
Figure 6. Colloidal gold immunochromatography assay for FB1 in 0.01 M PBS (pH 7.4). FB1 concentration: 1= 0 ng/mL; 2 = 1 ng/mL; 3 = 2.5 ng/mL; 4 = 5 ng/mL; 5 = 10 ng/mL; 6 = 25 ng/mL; and 7 = 50 ng/mL.
Detection of FB1 in corn samples
Optimize the strip test
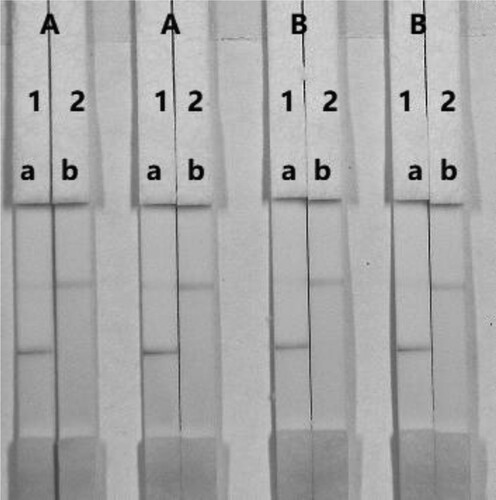
The concentration of mAbs in GNPs of the coating antigen affects the sensitivity of the assay. In this study, two different concentrations of mAbs (8 or 10 µg/mL) were allowed to react with FB1-negative (0 ng/mL) and FB1-positive spiked in the corn sample. shows that there were slight differences in colour intensity between 8 and 10 µg/mL. We observed that the optimum concentration of mAb in GNP was 8 µg/mL. Additionally, there is a significant difference in colour intensity at 0.1 and 0.25 mg/mL. It was found that the coating antigen with a concentration of 0.25 mg/mL had a deeper colour intensity than at 0.1 mg/mL, suggesting that more sensitive detection could be achieved at 0.25 mg/mL. Therefore, the optimum conditions for determination of FB1 in corn sample were 0.1 mg/mL coating antigen and the concentration of mAb in GNP was 8 µg/mL.
Figure 7. Optimization of the immunochromatographic strip. Concentration of coating antigen (A) 0.1 mg/mL; (B) 0.25 mg/mL. The dosage of the mAb that was added to the GNPs: (1) 8 µg/L; (2) 10 µg/L. The standard concentration: (a) 0 ng/mL; (b) 50 ng/mL.
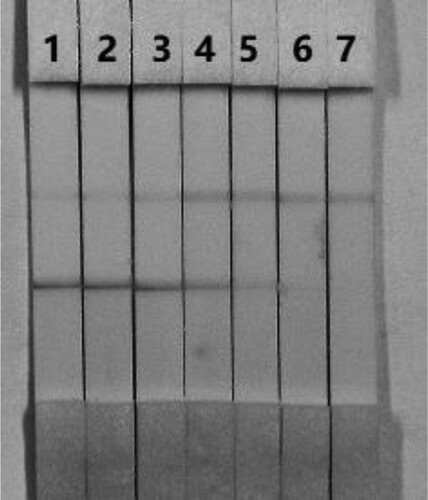
In this study, we determined the effect of matrix on our immunochromatographic assay for FB1 using corn samples. The advantages of immunochromatographic strip assay are its rapidity and ease of use. The corn samples were spiked with FB1 standard solution (10 µg/mL, prepared with 0.01 M PBS pH 7.4) at final FB1 concentrations of 0.5, 1, 2.5, 5, 10, and 25 ng/mL. Six replicates were determined at each concentration. The spiked samples were analysed using our developed method. shows that colour intensity decreased with increasing FB1 concentrations. The signal colour on the T line changed from strong to weak with increasing FB1 concentrations and completely disappeared at 25 ng/mL.
Figure 8. Result of FB1 detection with colloidal gold immunochromatographic strip assay spiked in corn samples (n = 6). 1 = 0 ng/mL, 2 = 0.5 ng/mL, 3 = 1 ng/mL, 4 = 2.5 ng/mL, 5 = 5 ng/mL, 6 = 10 ng/mL, and 7 = 25 ng/mL.
Conclusions
A sensitive anti-FB1 mAb 1H1 with a half-maximal inhibitory concentration (IC50) of 5 ng/mL and sensitive immunogen (FB1–BSA) was obtained following mouse immunization and cell fusion. A simple, rapid, and sensitive analytical method for determination of FB1 mycotoxin was developed by colloidal gold-based lateral-flow immunochromatography assay. Under optimize conditions by using BSA as reagent and 10 µL as concentration of mAb in GNP, the cut-off values in 0.01 M PBS (7.4) was 50 ng/mL. Meanwhile, the optimum conditions for determination of FB1 in corn sample were 0.1 mg/mL of coating antigen and the concentration of mAb in GNP was 8 µL. The assay has a cut-off values of 25 ng/mL spiked in corn samples and the results can be evaluated by the naked eye in 5 min. The lateral-flow immunochromatography assay represents a sensitive, simple, and rapid method to detect FB1 in 0.01 M PBS and corn samples.
Disclosure statement
No potential conflict of interest was reported by the authors.
Additional information
Funding
Related Research Data
References
- Bacon, C. W., & Nelson, P. E. (1994). Fumonisin production in corn by toxigenic strains of Fusarium moniliforme and Fusarium proliferatum. Journal of Food Protection, 57(6), 514–521. doi: https://doi.org/10.4315/0362-028X-57.6.514
- Berthiller, F., Brera, C., Iha, M. H., Krska, R., Lattanzio, V. M. T., MacDonald, S., … Tittlemier, S. A. (2017). Developments in mycotoxin analysis: An update for 2015–2016. World Mycotoxin Journal, 10(1), 5–29. doi: https://doi.org/10.3920/WMJ2016.2138
- Christensen, H. R., Yu, F. Y., & Chu, F. S. (2000). Development of a polyclonal antibody-based sensitive enzyme-linked immunosorbent assay for fumonisin B(4). Journal of Agricultural and Food Chemistry, 48(5), 1977–1984. doi: https://doi.org/10.1021/jf990973m
- Deng, X., Liu, L., Ma, W., Xu, C., Wang, L., & Kuang, H. (2012). Development and validation of a sandwich ELISA for quantification of peanut agglutinin (PNA) in foods. Food and Agricultural Immunology, 23(3), 265–272. doi: https://doi.org/10.1080/09540105.2011.617358
- de Oliveira, G. B., de Castro Gomes Vieira, C. M., Orlando, R. M., & Faria, A. F. (2017). Simultaneous determination of fumonisins B1 and B2 in different types of maize by matrix solid phase dispersion and HPLC-MS/MS. Food Chemistry, 233, 11–19. doi: https://doi.org/10.1016/j.foodchem.2017.04.091
- Ding, X., Liu, L., Song, S., Kuang, H., & Xu, C. (2017). Rapid and ultrasensitive detection of 3-amino-2-oxazolidinone in catfish muscle with indirect competitive enzyme-linked immunosorbent and immunochromatographic assays. Food and Agricultural Immunology, 28(3), 463–475. doi: https://doi.org/10.1080/09540105.2017.1297778
- Dupuy, J., Lebars, P., Lebars, J., & Boudra, H. (1993). Determination of fumonisin B-1 corn by instrumental thin-layer chromatography. Journal of Planar Chromatography-Modern TLC, 6(6), 476–480.
- Isanga, J., Mukunzi, D., Chen, Y., Suryoprabowo, S., Liu, L., Kuang, H., & Xu, C. (2017). Development of a monoclonal antibody assay and a lateral flow strip test for the detection of paromomycin residues in food matrices. Food and Agricultural Immunology, 28(3), 355–373. doi: https://doi.org/10.1080/09540105.2016.1272551
- Jaksic, S., Zivkov-Balos, M., Mihaljev, Z., Masic, Z., Jajic, I., Banic, N., & Abramovic, B. (2015). Extraction without organic solvents in the determination of fumonisins B-1, B-2, and B-3 in maize by HPLC-FLD and ELISA tests. Food Analytical Methods, 8(6), 1446–1455. doi: https://doi.org/10.1007/s12161-014-0030-5
- Kaltner, F., Rampl, C., Rychlik, M., Zimmermann, T., & Rohe, A. (2017). Development and validation of a cost-effective HPLC-FLD method for routine analysis of fumonisins B-1 and B-2 in corn and corn products. Food Analytical Methods, 10(5), 1349–1358. doi: https://doi.org/10.1007/s12161-016-0688-y
- Khaemba, G. W., Tochi, B. N., Mukunzi, D., Joel, I., Guo, L. L., Suryobrobowo, S., … Xu, C. L. (2016). Development of monoclonal antibody and lateral test strip for sensitive detection of clenbuterol and related beta(2)-agonists in urine samples. Food and Agricultural Immunology, 27(1), 111–127. doi: https://doi.org/10.1080/09540105.2015.1079598
- Kong, D., Xie, Z., Liu, L., Song, S., Kuang, H., & Xu, C. (2017). Development of IC-ELISA and lateral-flow immunochromatographic assay strip for the detection of vancomycin in raw milk and animal feed. Food and Agricultural Immunology, 28(3), 414–426. doi: https://doi.org/10.1080/09540105.2017.1293014
- Kuang, H., Xing, C., Hao, C., Liu, L., Wang, L., & Xu, C. (2013). Rapid and highly sensitive detection of lead ions in drinking water based on a strip immunosensor. Sensors, 13(4), 4214–4224. doi: https://doi.org/10.3390/s130404214
- Liu, F. M., Chen, P. C., Fu, Y. M., & Shih, D. Y. C. (2005). Determination of fumonisin B-1 and B-2 in corn products. Journal of Food and Drug Analysis, 13(3), 273–278.
- Liu, L. Q., Luo, L. J., Suryoprabowo, S., Peng, J., Kuang, H., & Xu, C. L. (2014). Development of an immunochromatographic strip test for rapid detection of ciprofloxacin in milk samples. Sensors, 14(9), 16785–16798. doi: https://doi.org/10.3390/s140916785
- Liu, L., Suryoprabowo, S., Zheng, Q., Song, S., & Kuang, H. (2017). Rapid detection of aldicarb in cucumber with an immunochromatographic test strip. Food and Agricultural Immunology, 28(3), 427–438. doi: https://doi.org/10.1080/09540105.2017.1293015
- Mukunzi, D., Isanga, J., Suryoprabowo, S., Liu, L., & Kuang, H. (2017). Rapid and sensitive immunoassays for the detection of lomefloxacin and related drug residues in bovine milk samples. Food and Agricultural Immunology, 28(4), 599–611. doi: https://doi.org/10.1080/09540105.2017.1306495
- Muscarella, M., Magroa, S. L., Nardiello, D., Palermo, C., & Centonze, D. (2008). Development of a new analytical method for the determination of fumonisins B-1 and B-2 in food products based on high performance liquid chromatography and fluorimetric detection with post-column derivatization. Journal of Chromatography A, 1203(1), 88–93. doi: https://doi.org/10.1016/j.chroma.2008.07.034
- Nelson, P. E., Plattner, R. D., Shackelford, D. D., & Desjardins, A. E. (1991). Production of fumonisins by Fusarium moniliforme strains from various substrates and geographic areas. Applied and Environmental Microbiology, 57(8), 2410–2412.
- Pestka, J. J., Azconaolivera, J. I., Plattner, R. D., Minervini, F., Doko, M. B., & Visconti, A. (1994). Comparative-assessment of Fumonisin in grain-based foods by ELISA, GC-MS, and HPLC. Journal of Food Protection, 57(2), 169–172. doi: https://doi.org/10.4315/0362-028X-57.2.169
- Preis, R. A., & Vargas, E. A. (2000). A method for determining fumonisin B-1 in corn using immunoaffinity column clean-up and thin layer chromatography/densitometry. Food Additives and Contaminants, 17(6), 463–468. doi: https://doi.org/10.1080/02652030050034046
- Rodriguez-Cervantes, C. H., Ramos, A. J., Robledo-Marenco, M. L., Sanchis, V., Marin, S., & Giron-Perez, M. I. (2013). Determination of aflatoxin and fumonisin levels through ELISA and HPLC, on tilapia feed in Nayarit, Mexico. Food and Agricultural Immunology, 24(3), 269–278. doi: https://doi.org/10.1080/09540105.2012.684202
- Scott, P. M. (2012). Recent research on fumonisins: A review. Food Additives and Contaminants Part A – Chemistry Analysis Control Exposure & Risk Assessment, 29(2), 242–248.
- Suryoprabowo, S., Liu, L. Q., Peng, J., Kuang, H., & Xu, C. L. (2014). Development of a broad specific monoclonal antibody for fluoroquinolone analysis. Food Analytical Methods, 7(10), 2163–2168. doi: https://doi.org/10.1007/s12161-014-9863-1
- Suryoprabowo, S., Liu, L. Q., Peng, J., Kuang, H., & Xu, C. L. (2015). Antibody for the development of specific immunoassays to detect nadifloxacin in chicken muscles. Food and Agricultural Immunology, 26(3), 317–324. doi: https://doi.org/10.1080/09540105.2014.914469
- Sydenham, E. W., Stockenstrom, S., Thiel, P. G., Rheeder, J. P., Doko, M. B., Bird, C., & Miller, B. M. (1996). Polyclonal antibody-based ELISA and HPLC methods for the determination of fumonisins in corn: A comparative study. Journal of Food Protection, 59(8), 893–897. doi: https://doi.org/10.4315/0362-028X-59.8.893
- Wang, X. C., Bao, M., Li, F. H., Fan, H. X., Li, H. S., Li, Y., … Wu, J. J. (2016). Development of a sensitive, competitive, indirect ELISA for the detection of fumonisin B-1 in corn originating from anhui province, China. Journal of Environmental Science and Health Part B-Pesticides Food Contaminants and Agricultural Wastes, 51(2), 107–112.
- Wang, Y., Dong, Y.-j., Li, Z.-m., Deng, L.-g., Guo, C.-y., Zhang, S.-q., … Zhao, S.-c. (2016). Fast determination of multi-mycotoxins in corn by dispersive solid-phase extraction coupled with ultra-performance liquid chromatography with tandem quadrupole time-of-flight mass spectrometry. Journal of Integrative Agriculture, 15(7), 1656–1666. doi: https://doi.org/10.1016/S2095-3119(15)61287-4
- Wang, S., Quan, Y., Lee, N., & Kennedy, I. R. (2006). Rapid determination of fumonisin B-1 in food samples by enzyme-linked immunosorbent assay and colloidal gold immunoassay. Journal of Agricultural and Food Chemistry, 54(7), 2491–2495. doi: https://doi.org/10.1021/jf0530401
- Wang, Y.-K., Wang, Y.-C., Wang, H.-a., Ji, W.-H., Sun, J.-H., & Yan, Y.-X. (2014). An immunomagnetic-bead-based enzyme-linked immunosorbent assay for sensitive quantification of fumonisin B1. Food Control, 40, 41–45. doi: https://doi.org/10.1016/j.foodcont.2013.11.025
- Wang, Z., Xie, Z., Cui, G., Liu, L., Song, S., Kuang, H., & Xu, C. (2017). Development of an indirect competitive enzyme-linked immunosorbent assay and immunochromatographic assay forhydrocortisone residues in milk. Food and Agricultural Immunology, 28(3), 476–488. doi: https://doi.org/10.1080/09540105.2017.1297779
- Whitaker, T. B., Trucksess, M. W., Johansson, A. S., Giesbrecht, F. G., Hagler, W. M., & Bowman, D. T. (1998). Variability associated with testing shelled corn for fumonisin. Journal of AOAC International, 81(6), 1162–1168.
- Xie, Z., Kong, D., Liu, L., Song, S., & Kuang, H. (2017). Development of IC-ELISA and lateral-flow immunochromatographic assay strip for the simultaneous detection of avermectin and ivermectin. Food and Agricultural Immunology, 28(3), 439–451. doi: https://doi.org/10.1080/09540105.2017.1293016
- Yoshizawa, T., Yamashita, A., & Luo, Y. (1994). Fumonisin occurrence in corn from high-risk and low-risk areas for human esophageal cancer in China. Applied and Environmental Microbiology, 60(5), 1626–1629.
- Zheng, M. Z., Richard, J. L., & Binder, J. (2006). A review of rapid methods for the analysis of mycotoxins. Mycopathologia, 161(5), 261–273. doi: https://doi.org/10.1007/s11046-006-0215-6
- Zou, L., Xu, Y., Li, Y., He, Q., Chen, B., & Wang, D. (2014). Development of a single-chain variable fragment antibody-based enzyme-linked immunosorbent assay for determination of fumonisin B-1 in corn samples. Journal of the Science of Food and Agriculture, 94(9), 1865–1871. doi: https://doi.org/10.1002/jsfa.6505