
ABSTRACT
The present study was aimed at investigating the effects of four LBP fractions with different molecular weights (MWs), designated LBP2, LBP3, LBP4 and LBP5, on RAW264.7 macrophages function. Results showed that LBP fractions could significantly enhance the expression of CD86 and MHC-II molecules on RAW264.7 macrophages. LBP3, LBP4 and LBP5 could enhance the production of ROS, NO, TNF-α and IL-6, and the phagocytosis of RAW264.7 macrophages. LBP2 with an MW of larger than 350 kDa could only enhance the secretion of TNF-α. LBP3 enhanced the RAW264.7 macrophages function in a dose-dependent manner and also enhanced the iNOS mRNA expression in the cells. These results demonstrated that the immunomodulatory activity of LBP on RAW264.7 macrophages was closely related to its MW. It indicated that fractions with an MW smaller than 350 kDa were the main active fractions of LBP in enhancing macrophages function.
1. Introduction
Macrophages which were originally identified by their phagocytic nature are found in all tissues (Wynn, Chawla, & Pollard, Citation2013). They play a crucial role in host defence against pathogen infection by ingesting and killing invading pathogens directly, and also initiating inflammatory responses to invading pathogens (Ghazanfari, Yaraee, Farahnejad, Hakimzadeh, & Danialy, Citation2009; Murray & Wynn, Citation2011; Brüne et al., Citation2013). The mechanisms by which macrophages kill pathogens include the production of reactive oxygen species (ROS) and reactive nitrogen species that are toxic to pathogens. Activated macrophages can produce a large amount of ROS via a process called respiratory burst that converts molecular oxygen into ROS, such as super oxide (O2−) and H2O2 (Paiva & Bozza, Citation2014; Iles & Forman, Citation2002). In addition to ROS, activated macrophages can also produce reactive nitrogen species, mainly nitric oxide (NO), which can contribute to pathogen killing (Brüne et al., Citation2013). The generation of NO in macrophages is induced by an enzyme called inducible nitric oxide synthase (iNOS); iNOS can be induced in activated macrophages and convert arginine to citrulline that contributes to the production of NO (Flannagan, Bryan, & Heinrichs, Citation2015). ROS and NO can damage proteins, lipids and DNA of the pathogens, and protect against infectious diseases. The insufficient responses of macrophages to pathogens may cause infection diseases, such as Chronic Granulomatous Disease caused by the defects in producing oxidizing species in human, and patients with modest residual production of ROS have significantly less severe illness and a greater likelihood of long-term survival (Rahman, Hayee, Chee, Segal, & Smith, Citation2009; Kuhns et al., Citation2010). Besides, macrophages also play an important role in development, homeostasis, tissue repair and immunity (Wynn et al., Citation2013).
Lycium barbarum polysaccharides (LBP) which are extracted from the edible fruit of Chinese herb Lycium barbarum have the ability to activate macrophages. LBP could upregulate the expressions of CD40, CD80, CD86 and MHC class II molecules, and enhance phagocytosis in murine peritoneal macrophages (Chen, Soo, Srinivasan, Tan, & Chan, Citation2009). Polysaccharide–protein complex (LBPF4) from Lycium barbarum L. and LBPF4-OL which were the glycan part of LBPF4 both could significantly induce TNF-α, IL-1β and NO production on macrophage, and enhance macrophage phagocytosis (Zhang, Li, et al., Citation2014). Furthermore, it had been demonstrated that macrophages, rather than T and B cells, were the principal target cells of LBPF4-OL (Zhang et al., Citation2011). LBPF4-OL could increase the phosphorylation of p38-MAPK in macrophages, but could not directly associate with the TLR4/MD2 molecular complex as lipopolysaccharides (LPS) did, suggesting that it was a new Toll-like receptor 4/MD2-MAPK signalling pathway activator and inducer (Zhang, Qi, et al., Citation2014).
Recent studies have indicated that biological activity of LBP partly depends on its molecular weight (MW). LBP fractions of LBP-a4 with an MW of 10.2 kDa and LBP-p8 with an MW of 6.50 × 10³ kDa had different effects on the proliferation of SMMC-7721 cells that LBP-a4 could inhibit the tumour cells growth while LBP-p8 showed opposite activity (Zhang, Tang, Wang, Zhang, & Zhang, Citation2013). In our previous study, we found that LBP fractions (named LBP2, LBP3, LBP4 and LBP5) with serial different MW had different inhibition activities in H22 cells growth in vitro and H22 tumour growth in vivo (Deng et al., Citation2017). In the present study, to further study the relationship of MW and immunomodulatory activity on the macrophage function of LBP, the effects of LBP fractions (named LBP2, LBP3, LBP4 and LBP5) with serial different MWs (range from 3 to 400 kDa) on RAW264.7 macrophages function were investigated.
2. Materials and methods
2.1. Materials
The LBP fractions with different MW series, designated LBP2 (MW 350–400 kDa), LBP3 (MW 40–350 kDa), LBP4 (MW 8–40 kDa) and LBP5 (MW 3–8 kDa), were prepared as described in our previous study (Deng et al., Citation2017). The fractions were dissolved in cell culture medium and filtered through a 0.22 μm filter for in vitro experiment. RPMI 1640 medium was obtained from Corning (New York, USA); foetal bovine serum (FBS) was obtained from Biological Industries (Kibbutz Beit-Haemek, Israel). PE-conjugated anti-mouse MHC-II antibody and PE/CY5-conjugated anti-mouse CD86 antibody were obtained from Biolegend (San Diego, USA). Griess reagent was purchased from Beyotime Biotechnology (Shanghai, China). DNase I (RNase-free) was purchased from TransGen Biotech (Beijing, China). HiScript 1st Strand cDNA Synthesis Kit and AceQ qPCR SYBR Green Master Mix (High ROX Premixed) kit were obtained from Vazyme (Nanjing, China). BD™ Mouse Inflammation CBA Kit was obtained from BD Bioscience (San Diego, USA). 2′,7′-Dichlorofluorescein diacetate (DCF-DA) and LPS were obtained from Sigma (St. Louis, USA). Penicillin-Streptomycin solution was obtained from Genom Biomedical Technology Co., Ltd. (Hangzhou, China). TRIzol® Reagent and FluoSpheres® Fluorescent Microspheres were obtained from Life technologies (New York, USA). Mouse LPS ELISA Kit was obtained from Cusabio (Wuhan, China).
2.2. LPS determination
The concentration of LPS in all the LBP fractions was determined with an LPS ELISA kit according to the user’s instructions. Briefly, LBP fractions were dissolved in sterile phosphate buffer (PBS) at a concentration of 1 mg mL−1. One hundred microlitres of standard and sample were added to the plate and incubated for 2 hours at 37°C. After removal of the liquid of each well, 100 μL of biotin-antibody (1×) was added and incubated for 1 hour at 37°C. After three washes with wash buffer, 100 μL of HRP-avidin (1×) was added to each well and incubated for 1 hour at 37°C. The liquid of each well was removed carefully and followed by washes five times. Ninety microlitres of the TMB substrate was added to each well and incubated for 30 minutes at 37°C in the dark. Fifty microlitres of the stop solution was added to each well and the optical density (OD) of each well was determined using a microplate reader set to 450 and 540 nm. The absolute value of OD was calculated as subtracting readings at 540 nm from the readings at 450 nm. The results showed that the concentration of LPS in all the LBP fractions was under limitation (<0.039 ng mL−1).
2.3. Cell culture and treatment protocol
Murine RAW264.7 macrophages were obtained from Shanghai Institutes for Biological Sciences (Shanghai, China) and were originally obtained from American Type Culture Collection (Manassas, USA). Cells were cultured in RMPI 1640 medium containing 10% FBS, 100 μg mL−1 streptomycin and 100 U mL−1 penicillin in a cell incubator where the condition is maintained at 37°C with 5% CO2.
To investigate the effects of LBP fractions on phenotype, ROS production, phagocytosis and iNOS mRNA expression in RAW264.7 macrophages, cells were seeded in six-well plates (1 × 10⁶ cells well−1) and treated with 100 μg mL−1 of LBP2, LBP3, LBP4 and LBP5 or with 50, 100 and 200 μg mL−1 of LBP3 or 1 μg mL−1 of LPS for 24 or 48 h. To investigate the effects of LBP fractions on NO, TNF-α and IL-6 secretion, cells were seeded in 96-well plates (1 × 10⁵ cells well−1) and treated with 100 μg mL−1 of LBP2, LBP3, LBP4 and LBP5 or with 50, 100 and 200 μg mL−1 of LBP3 for 18 or 24 h.
2.4. Phenotype analysis
After being treated with 100 μg mL−1 of LBP2, LBP3, LBP4 and LBP5 or 1 μg mL−1 of LPS for 24 h, RAW264.7 macrophages were collected and washed twice with pre-cold PBS at 300×g for 5 min at 4°C. The cells were stained with PE-conjugated anti-mouse MHC-II antibody and PE/CY5-conjugated anti-mouse CD86 antibody for 40 min at 4°C according to the user’s instructions. The cells were washed twice again with pre-cold PBS and resuspended in 400 μL PBS. The samples were detected on an FACS CantoTM II flow cytometer (BD Biosciences) and the data were analysed with Flowjo 7.6 software.
2.5. ROS production assay
The ROS production in RAW264.7 macrophages was assayed with the DCFH-DA reagent according to the user’s instructions. Briefly, cells were collected and washed twice with PBS. After the supernatant was removed carefully, cells were resuspended in staining buffer and stained with DCFH-DA (10 μmol L−1) at 37°C for 1 h in the dark. After being washed twice with PBS, the sample was resuspended in PBS and analysed with flow cytometry. For fluorescence microscopy, cells were stained with the DCFH-DA reagent in a six-well plate and photographed with a BX53 fluorescence microscope (Nikon).
2.6. No production and iNOS mRNA expression analysis
RAW264.7 macrophages were treated with 100 μg mL−1 of LBP2, LBP3, LBP4 and LBP5 or with 50, 100 and 200 μg mL−1 of LBP3 or 1 μg mL−1 of LPS for 18 or 24 h. The culture supernatant was collected to determine the concentration of NO with the Griess reagent according to the user’s instructions. To determine the iNOS mRNA expression in RAW264.7 macrophages, cells were collected to isolate the total RNA using the TRIzol reagent according to the user’s instructions. After removal of the genomic DNA from the samples using DNase I (RNase-free), RNA was converted into cDNA using the HiScript 1st Strand cDNA Synthesis Kit according to the user’s instructions. Real-time PCR for Nos2 (NM_010927.3) was carried out using the Nos2 forward primer (5′-AAGCCCTCACCTACTTCCTGG-3′) and reverse primer (5′-TCTCTGCCTATCCGTCTCGT-3′). 18S ribosomal RNA (Rn18s, NR_003278) was used as the reference gene that the forward primer (5′-CGGACACGGACAGGATTGACA-3′) and reverse primer (5′-CCAGACAAATCGCTCCACCAACTA-3′) used. The reaction was performed in an ABI7500 Applied Biosystems Real-Time PCR instrument (Applied Biosystems) using the Real-Time PCR kit as described in the user’s instructions. The relative expression levels of Nos2 to Rn18s were calculated by 2−ΔΔCt.
2.7. Cytokine secretion assay
The concentration of TNF-α and IL-6 in the culture supernatant was assayed by a Mouse Inflammation CBA Kit according to the user’s instructions. Briefly, 50 μL of the culture supernatant was added to an assay tube containing 50 μL of mixed Capture Beads of TNF-α and IL-6. Then, 50 μL of the detection reagent was added into the tube and the sample was incubated for 2 h at room temperature in the dark. The sample was washed with Wash Buffer and centrifuged at 200×g for 5 min. After the supernatant was removed carefully, the sample was resuspended in 300 μL of wash buffer and detected on the flow cytometer. The data were analysed with FCAP Array software.
2.8. Phagocytosis assay
The phagocytosis of RAW264.7 macrophages was assayed with fluorescent microspheres. The fluorescent microspheres were pretreated with bovine serum albumin at 37°C for 30 min in the dark before incubation with the cells. The RAW264.7 macrophages were incubated with the pretreated fluorescent microspheres (1 × 10⁷ microspheres well−1 in a six-well plate) at 37°C for 90 min in the dark. The cells were washed twice with PBS. For flow cytometry assay, the cells were collected in assay tubes and counted using flow cytometry. For fluorescence microscopy assay, the cells were observed and photographed with the fluorescent microscope. The phagocytosis index was calculated using the following equation: phagocytosis index = (a × 1 + b × 2 + c × 3 + d × 4 + e × 5)/(a + b + c + d + e). Numerals 1–5 were the count of fluorescent microspheres which were engulfed by a cell, when letter a–e was the count of cells which engulfed the fluorescent microspheres.
2.9. Statistical analysis
The data were presented as mean ± S.D. The SPSS 19.0 software was used to analyse the data with the method of one-way analysis of variance followed by the Dunnett-t test to assess the statistical significance of differences between experimental groups. A P value <.05 was considered to be significant.
3. Results and discussion
3.1. Effects of LBP fractions on the expression of CD86 and MHC-II molecules on Raw264.7 macrophages
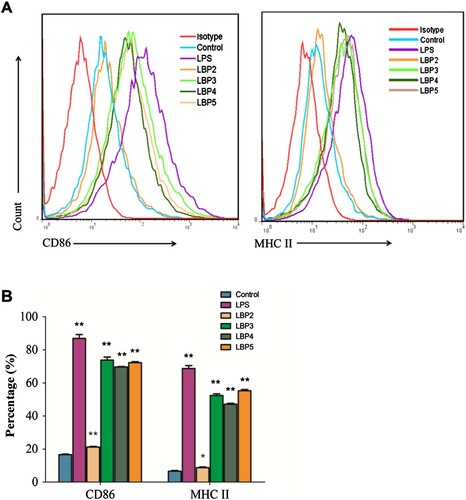
The activated macrophages express high levels of MHC-II molecules and co-stimulatory molecules (e.g.CD86 and CD80) on the cell surface. These molecules not only are activation markers but also can enhance the ability of macrophages to present antigens to T cells (Mosser & Edwards, Citation2008). Previous studies had reported that LBP and its polysaccharide–protein complex could enhance the expression levels of MHC-II and CD86 molecules on acrophages in vivo and in vitro (Chen et al., Citation2009; Zhang et al., Citation2011). In the present study, the results showed that LBP fractions with different MW and LPS could enhance the expression levels of MHC-II and CD86 molecules on RAW264.7 macrophages significantly (). However, the expression levels of MHC-II and CD86 molecules were lower on LBP2-treated cells than those treated with other LBP fractions. Since the LBP2 has the largest MW (350–400 kDa) during all the fractions, the results indicated that LBP fractions could stimulate RAW264.7 macrophages activation and the fractions with smaller MW (<350 kDa) have higher ability to stimulate the macrophages activation.
Figure 1. Effects of LBP fractions on the expression levels of CD86 and MHC-II molecules in RAW264.7 macrophages. Cells were treated with 100 μg mL−1 of LBP2, LBP3, LBP4 and LBP5 or 1 μg mL−1 of LPS for 24 h, phenotypes of the cells were detected with flow cytometry. (A) Representative flow cytometers histogram overlay plots of CD86 and MHC-II molecules on surface of RAW264.7 macrophages. (B) Statistical analysis of the percentage of CD86 and MHC-II expression. Data were shown as the mean ± SD of three replicates (n = 3). *P < .05 and **P < .01, compared to the control group.
3.2. Effects of LBP fractions on the ROS production in RAW264.7 macrophages
The activated macrophages can produce a great deal of ROS by respiratory burst which play an important role in killing pathogens for macrophages (Paiva & Bozza, Citation2014; Iles & Forman, Citation2002). People in whom macrophages cannot produce ROS suffer from a disease called Chronic Granulomatous Disease. Thus, ROS production is an important indicator to evaluate the function of macrophages. Since ROS can change a reagent called DCFH-DA to DCF which can emit fluorescence, DCFH-DA is usually used to assay the ROS production in macrophages (Karlsson, Kurz, Brunk, Nilsson, & Frennesson, Citation2010). In the present study, to investigate the effects of LBP fractions with different MW on the ROS production in RAW264.7 macrophages, cells were treated with 100 μg mL−1 of LBP fractions for 24 h and ROS production was determined using the DCFH-DA reagent. As shown in (A,B), the LBP fractions of LBP3, LBP4 and LBP5 along with LPS could significantly enhance ROS production in RAW264.7 macrophages (all P < .01), while LBP2 showed no significant effect.
Figure 2. ROS production in RAW264.7 macrophages. Cells were treated with 100 μg mL−1 of LBP2, LBP3, LBP4 and LBP5 or 1 μg mL−1 of LPS for 24 h, or treated with 25, 50, 100 and 200 μg mL−1 of LBP3 for 6 h. (A) Representative flow cytometry histogram overlay plots of DCF in RAW264.7 macrophages. (B) Statistical analysis of the mean fluorescence intensity of DCF. (C) Cells were stained with DCF-DA and observed in fluorescence microscopy with 100× magnification. Data were shown as the mean ± SD of three replicates (n = 3). **P < .01, compared to the control group.
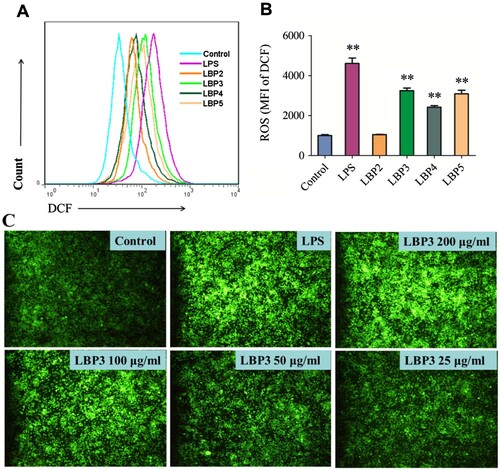
To investigate whether LBP fractions enhanced ROS production in a dose-dependent manner, cells were treated with 25, 50, 100 and 200 μg mL−1 of LBP3 for 6 h and stained with DCFH-DA, then were observed and photographed with a fluorescence microscope. As shown in (C), LBP3 enhanced the ROS production in a dose-dependent manner as the DCF green fluorescence increased with the concentration of LBP3.
3.3. Effects of LBP fractions on the NO production in RAW264.7 macrophages
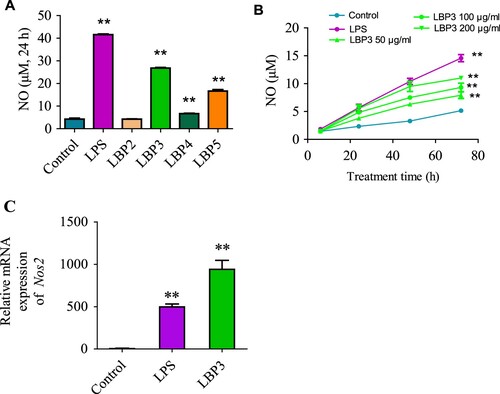
NO production is another important event when macrophages are activated (Brüne et al., Citation2013), and one of the important mechanisms for macrophages to kill cancer cells and pathogens (Hibbs, Taintor, Vavrin, & Rachlin, Citation1988). In the present study, to investigate whether LBP fractions could enhance the NO production in RAW264.7 macrophages, cells were treated with LBP fractions for 24 h and with different concentrations of LBP3 for 6–72 h. As shown in (A), LBP3, LBP4, LBP5 and LPS could induce the NO production in RAW264.7 macrophages significantly (all P < .01), while LBP2 showed no significant effect. A further study showed that LBP3 induced the NO production in RAW264.7 macrophages in a dose- and time-dependent manner ((B)). To confirm these results, we also determined the iNOS mRNA expression in LBP3-treated RAW264.7 macrophages. The iNOS is an enzyme that can induce the synthesis of NO in macrophages (Lawrence, Gullickson, & Kornbluth, Citation2015). Once being activated, the macrophages express large amounts of iNOS, while in the resting state there is nearly no expression. As expected, after being treated with LBP3 for 8 h, the iNOS mRNA expression levels were increased remarkably (P < .01, (C)).
Figure 3. NO production and iNOS mRNA expression in RAW264.7 macrophages. Cells were treated with 100 μg mL−1 of LBP2, LBP3, LBP4 and LBP5 or 1 μg mL−1 of LPS for 24 h, or treated with 50, 100 and 200 μg mL−1 of LBP3 for 6, 24, 48 and 72 h. No production in the culture supernatant was determined with the Griess reagent. For iNOS mRNA expression analysis, cells were treated with 1 μg mL−1 of LPS or 100 μg mL−1 of LBP3 for 8 h. (A) Statistical analysis of NO levels in the culture supernatant of LBP fractions treated cells. (B) Statistical analysis of NO levels in the culture supernatant of LBP3 and LPS-treated cells for 6–72 h. (C) Statistical analysis of iNOS mRNA expression level in cells treated with 1 μg mL−1 of LPS or 100 μg mL−1 of LBP3. Data were shown as the means ± SD of three replicates (n = 3). **P < .01, compared to the control group.
3.4. Effects of LBP fractions on the TNF-α and IL-6 secretion in RAW264.7 macrophages
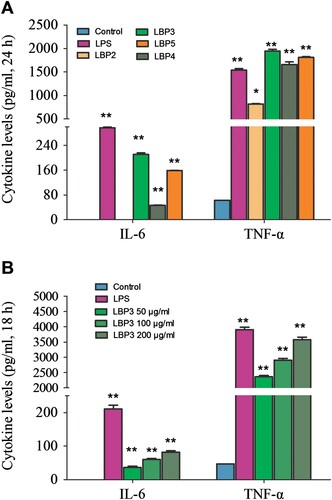
The activated macrophages can secrete multiple cytokines and chemokines, such as TNF-α, IL-6, IL-12, MCP-1 and MIP-1 (Liu, Li, Xu, & Li, Citation2017). These cytokines and chemokines play an important role in inducing inflammation response which can also attracts neutrophils, lymphocytes, dendritic cells and monocytes to the pathogen infection site. Previous studies had reported that LBP could enhance the secretion of TNF-α, IL-12 p40 and IL-1β in murine macrophages (Chen et al., Citation2009; Zhang et al., Citation2011). In the present study, we investigated the effects of LBP fractions with different MW on the TNF-α and IL-6 secretion in RAW264.7 macrophages. As shown in (A), all the LBP fractions and LPS could enhance the TNF-α secretion significantly (P < .01 or P < .05 in the LBP2 group). We also found that the resting RAW264.7 macrophages secrete little IL-6, while LBP3, LBP4, LBP5 and LPS could significantly enhance the IL-6 secretion in RAW264.7 macrophages (P < .01), but LBP2 showed no significant effect. Further study showed that LBP3 significantly enhanced the secretion of TNF-α and IL-6 in a dose-dependent manner (all P < .01, (B)).
Figure 4. The concentration of TNF-α and IL-6 in the culture supernatant of RAW264.7 macrophages. Cells were treated with 100 μg mL−1 of LBP2, LBP3, LBP4 and LBP5 or 1 μg mL−1 of LPS for 24 h, or treated with 50, 100 and 200 μg mL−1 of LBP3 for 18 h. The concentration of TNF-α and IL-6 in the culture supernatant was determined with the CBA mouse inflammation kit using flow cytometry. (A) Statistical analysis of TNF-α and IL-6 production in the culture supernatant of LBP fractions treated cells. (B) Statistical analysis of TNF-α and IL-6 production in the culture supernatant of LBP3-treated cells. Data are shown as the means ± SD of three replicates (n = 3). *P < .05 and **P < .01, compared to the control group.
3.5. Effects of LBP fractions on the phagocytosis of RAW 264.7 macrophages
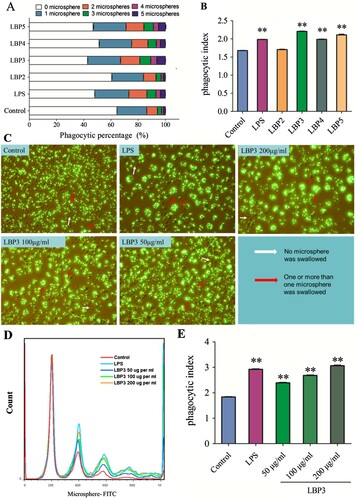
Phagocytosis is a very important function of macrophages so that they can engulf the invading pathogens in a non-specific manner and kill the pathogens using lysosomal enzymes (Flannagan et al., Citation2015; Helmy et al., Citation2006; Stuart & Ezekowitz, Citation2005). A previous study had showed that LBP could enhance the phagocytosis of murine macrophages. In the present study, we found that LBP3, LBP4, LBP5 and LPS could significantly enhance the phagocytosis of RAW264.7 macrophages. As shown in (A,B), the proportion of cells that engulfed two or more than two fluorescent microspheres, along with the phagocytic index, was significantly increased in LBP3, LBP4, LBP5 and LPS-treated RAW264.7 macrophages, but not in LBP2-treated cells. The fluorescence microscopy results showed that LBP3 enhanced the ability of RAW264.7 macrophages to engulf fluorescent microspheres in a dose-dependent manner ((C)), and it was confirmed by the follow-up analysis using flow cytometry data that LBP3 significantly enhanced the phagocytic index of RAW264.7 macrophages in a dose-dependent manner (all P < .01, (D,E)).
Figure 5. Effects of LBP fractions on the phagocytosis of RAW 264.7 macrophages. Cells were treated with 100 μg mL−1 of LBP fractions or 1 μg mL−1 of LPS, or treated with LBP3 for 48 h. The phagocytosis of the cells was tested by engulfing the fluorescent microspheres and using flow cytometry or fluorescence microscopy. (A) Statistical analysis of the percentage of the cells engulfed fluorescent microspheres. (B) Statistical analysis of the phagocytic index of the cells. (C) Images of cells engulfed fluorescent microspheres. (D) Representative flow cytometry histogram overlay plots of fluorescent microspheres engulfed by LBP3-treated cells. (E) Statistical analysis of the phagocytic index of the cells treated with different doses of LBP3. Data are shown as the means ± SD of three replicates (n = 3). **P < .01, compared to the control group.
4. Conclusions
In the present study, the relationship of MW and immunomodulatory activity on the macrophage function was investigated. In summary, LBP3, LBP4 and LBP5 showed significant effects on the RAW264.7 macrophages function by enhancing the expression of CD86 and MHC-II molecules, the production of ROS, NO, TNF-α and IL-6, and phagocytosis. LBP2 with the largest MW could only enhance the expression of CD86 and MHC-II molecules, and the production of TNF-α in RAW264.7 macrophages. These results demonstrated that the immunomodulatory activity of LBP on RAW264.7 macrophages was closely related to its MW. It indicated that fractions with an MW smaller than 350 kDa were the main active fractions of LBP in enhancing the function of macrophages.
Disclosure statement
No potential conflict of interest was reported by the authors.
Additional information
Funding
Related Research Data
References
- Brüne, B., Dehne, N., Grossmann, N., Jung, M., Namgaladze, D., Schmid, T., … Weigert, A. (2013). Redox control of inflammation in macrophages. Antioxidants & Redox Signaling, 19(6), 595–637. doi: https://doi.org/10.1089/ars.2012.4785
- Chen, Z. S., Soo, M. Y., Srinivasan, N., Tan, B. K., & Chan, S. H. (2009). Activation of macrophages by polysaccharide-protein complex from Lycium barbarum L. Phytotherapy Research, 23(8), 1116–1122. doi: https://doi.org/10.1002/ptr.2757
- Deng, X. L., Li, X. L., Luo, S., Zheng, Y. Y., Luo, X., & Zhou, L. (2017). Antitumor activity of Lycium barbarum polysaccharides with different molecular weights: An in vitro and in vivo study. Food Nutrition Research, 61, 1399770. doi: https://doi.org/10.1080/16546628.2017.1399770
- Flannagan, R. S., Bryan, H., & Heinrichs, D. E. (2015). Antimicrobial mechanisms of macrophages and the immune evasion strategies of Staphylococcus aureus. Pathogens (Basel, Switzerland), 4(4), 826–868. doi: https://doi.org/10.3390/pathogens4040826
- Ghazanfari, T., Yaraee, R., Farahnejad, Z., Hakimzadeh, H., & Danialy, F. (2009). In vitro effect of Pleurotus florida on macrophage cell viability and nitric oxide production. Food and Agricultural Immunology, 20(2), 105–110. doi: https://doi.org/10.1080/09540100902838198
- Helmy, K. Y., Katschke, K. J., Gorgani, N. N., Elliott, J. M., Diehl, L., Scales, S. J., … Campagne, M. V. (2006). Crig: A macrophage complement receptor required for phagocytosis of circulating pathogens. Cell, 124(5), 915–927. doi: https://doi.org/10.1016/j.cell.2005.12.039
- Hibbs, J. B., Taintor, R. R., Vavrin, Z., & Rachlin, E. M. (1988). No: A cytotoxic activated-macrophage effector molecule. Biochemical & Biophysical Research Communications, 157(1), 87–94. doi: https://doi.org/10.1016/S0006-291X(88)80015-9
- Iles, K. E., & Forman, H. J. (2002). Macrophage signaling and respiratory burst. Immunologic Research, 26(1-3), 95–106. doi: https://doi.org/10.1385/IR:26:1-3:095
- Karlsson, M., Kurz, T., Brunk, U. T., Nilsson, S. E., & Frennesson, C. I. (2010). What does the commonly used DCF test for oxidative stress really show? Biochemical Journal, 428, 183–190. doi: https://doi.org/10.1042/BJ20100208
- Kuhns, D. B., Alvord, W. G., Heller, T., Feld, J. J., Pike, K. M., Marciano, B. E., … Gallin, J. I. (2010). Residual NADPH oxidase and survival in chronic granulomatous disease. New England Journal of Medicine, 363(27), 2600–2610. doi: https://doi.org/10.1056/NEJMoa1007097
- Lawrence, D. W., Gullickson, G., & Kornbluth, J. (2015). E3 ubiquitin ligase NKLAM positively regulates macrophage inducible nitric oxide synthase expression. Immunobiology, 220(1), 83–92. doi: https://doi.org/10.1016/j.imbio.2014.08.016
- Liu, L., Li, H., Xu, R. H., & Li, P. L. (2017). Expolysaccharides from Bifidobacterium animalis RH activates RAW 264.7 macrophages through toll-like receptor 4. Food and Agricultural Immunology, 28(1), 149–161. doi: https://doi.org/10.1080/09540105.2016.1230599
- Mosser, D. M., & Edwards, J. P. (2008). Exploring the full spectrum of macrophage activation. Nature Reviews Immunology, 8(12), 958–969. doi: https://doi.org/10.1038/nri2448
- Murray, P. J., & Wynn, T. A. (2011). Protective and pathogenic functions of macrophage subsets. Nature Reviews Immunology, 11(11), 723–737. doi: https://doi.org/10.1038/nri3073
- Paiva, C. N., & Bozza, M. T. (2014). Are reactive oxygen species always detrimental to pathogens? Antioxidants & Redox Signaling, 20(6), 1000–1037. doi: https://doi.org/10.1089/ars.2013.5447
- Rahman, F. Z., Hayee, B., Chee, R., Segal, A. W., & Smith, A. M. (2009). Impaired macrophage function following bacterial stimulation in chronic granulomatous disease. Immunology, 128(2), 253–259. doi: https://doi.org/10.1111/j.1365-2567.2009.03112.x
- Stuart, L. M., & Ezekowitz, R. A. (2005). Phagocytosis: Elegant complexity. Immunity, 22(5), 539–550. doi: https://doi.org/10.1016/j.immuni.2005.05.002
- Wynn, T. A., Chawla, A., & Pollard, J. W. (2013). Macrophage biology in development, homeostasis and disease. Nature, 496(7446), 445–455. doi: https://doi.org/10.1038/nature12034
- Zhang, X. R., Li, Y. J., Cheng, J. P., Liu, G., Qi, C. H., Zhou, W. X., & Zhang, Y. X. (2014). Immune activities comparison of polysaccharide and polysaccharide-protein complex from Lycium barbarum L. International Journal of Biological Macromolecules, 65, 441–445. doi: https://doi.org/10.1016/j.ijbiomac.2014.01.020
- Zhang, X. R., Qi, C. H., Cheng, J. P., Liu, G., Huang, L. J., Wang, Z. F., … Zhang, Y. X. (2014). Lycium barbarum polysaccharide LBPF4-OL may be a new toll-like receptor 4/MD2-MAPK signaling pathway activator and inducer. International Immunopharmacology, 19(1), 132–141. doi: https://doi.org/10.1016/j.intimp.2014.01.010
- Zhang, M., Tang, X. L., Wang, F., Zhang, Q., & Zhang, Z. S. (2013). Characterization of Lycium barbarum polysaccharide and its effect on human hepatoma cells. International Journal of Biological Macromolecules, 61, 270–275. doi: https://doi.org/10.1016/j.ijbiomac.2013.06.031
- Zhang, X. R., Zhou, W. X., Zhang, Y. X., Qi, C. H., Yan, H., Wang, Z. F., & Wang, B. (2011). Macrophages, rather than T and B cells are principal immunostimulatory target cells of Lycium barbarum L. polysaccharide LBPF4-OL. Journal of Ethnopharmacology, 136(3), 465–472. doi: https://doi.org/10.1016/j.jep.2011.04.054