
ABSTRACT
The misuse of β-agonists constitutes a potential risk to public health and β-agonists has been forbidden in many countries. In this study, we describe an immunochromatographic test strip method for the rapid, sensitive, and inexpensive detection of mabuterol (MAB) and mapenterol (MAP) by cross-reactivity in pig urine. For the immunochromatographic test, the coating antigen which was obtained by conjugating the salbutamol to bovine serum albumin and a goat anti-mouse IgG antibody were drawn onto a nitrocellulose membrane as the control line and test line. The test was developed with a sensitive monoclonal antibody specific for MAB, which was generated by immunizing BALB/c mice with a well-characterized MAB- keyhole limpet haemocyanin conjugate, produced in our laboratory. Under optimized conditions, the cut-off limits of the semi-quantitative test strip for MBA and MPA were as low as 10 ng/mL in both 0.01 M PBS (pH 7.4) and pig urine. All the results were obtained within 5 min. Our data indicate that the immunochromatographic assay allows provide sensitive, rapid, and specific on-site screening for MAB and MAP.
Introduction
The administration of β-agonists as growth promoters has been strictly prohibited in most countries of the world. β-Agonists are usually used as therapeutic treatments for asthma in humans. However, because of their significant nutrition redistribution function, β-agonists have been used in the livestock industry, including pigs and ruminants, to reduce the carcass fat and increase the muscle mass while improving the growth and feed conversion rates (Bovee et al., Citation2016; Cardoso & Taveira, Citation2002; Kuiper, Noordam, van Dooren-Flipsen, Schilt, & Roos, Citation1998). They have also been used to increase the frequency of sleep in animals. β-Agonists also pose risks to consumer health (Chu, Zheng, Qu, Geng, & Kang, Citation2017).
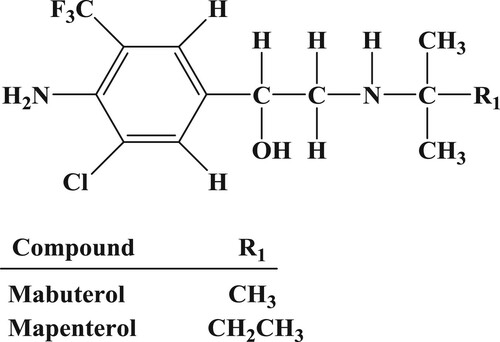
Mabuterol ((RS)-1-[4-Amino-3-chloro-5-(trifluoromethyl)phenyl]-2-(tert-butylamino)ethanol) (MAB) and mapenterol (MAP) () are long-acting β2-adrenoceptor agonists and bronchodilators. The administration of MAB dose-dependently reduces blood pressure and increases the heart rate in cats, rats, and dogs, but at higher doses, it reduces the heart rate. High doses of MAB also exert blocking activity in isolated guinea-pig atrium (Osada, Murai, Ishizaka, & Sanai, Citation1984; Zvereva, Zherdev, Xu, & Dzantiev, Citation2018).
Figure 1. Chemicel structure of mabuterol and mapenterol.
Veterinary drug residues have potential risks to human health, including affecting the central nervous system and inducing cardiovascular diseases and heart disorders, which may be fatal after the acute consumption of such residues. However, these drugs are still used illegally as growth promoters. Attention must be paid to the risk of MAB and MAP on human health. Because these drugs are metabolized rapidly in diverse species, sensitive and specific (Jiang et al., Citation2017; Li et al., Citation2017).
Many methods have been developed for the analysis of β-agonists and psychiatric drugs, including high-performance liquid chromatography (HPLC) (Nie et al., Citation2010; X. Wang, Guo, Wang, Yuan, & Zhao, Citation2015), gas chromatography mass spectrometry (GC-MS) (Bocca, Fiori, Cartoni, & Brambilla, Citation2003; Borrey, Meyer, Lambert, Van Peteghem, & De Leenheer, Citation2001; Hernandez-Carrasquilla, Citation2000; Ramos, Santos, Silva, & da Silveira, Citation1998), and liquid chromatography tandem mass spectrometry (LC-MS/MS) (Du, Wu, Yang, & Yang, Citation2012; Fesser et al., Citation2005). However, these methods are time consuming and expensive because they require long pretreatment procedures and sophisticated analytical instruments (Y. Chen et al., Citation2017; Deng et al., Citation2012; Isanga et al., Citation2017; Suryoprabowo, Liu, Peng, Kuang, & Xu, Citation2015).
Immunoassays based on antibody-antigen recognition are highly specific and offer sensitive tools for the detection of β-agonists. The enzyme-linked immunosorbent assay (ELISA) (Degand, Bernesduyckaerts, Delahaut, & Maghuinrogister, Citation1993; Quoc Anh et al., Citation2016; Xu et al., Citation2007) is highly specific and cost-effective, and could be applied to high-throughput testing with simple sample preparation steps (Ding, Liu, Song, Kuang, & Xu, Citation2017; L. Liu, Suryoprabowo, Zheng, Song, & Kuang, Citation2017; Z. Wang, Xie, et al., Citation2017; Xie, Kong, Liu, Song, & Kuang, Citation2017). The lateral-flow immunochromatographic (LFIC) strip allows the semi-quantitative analysis of several drug residues and has become increasingly popular because it is simple, rapid (can be performed in 5–10 min), specific, and sensitive. Another advantage of this method is that all the reagents are included on the strip (W. Wang, Liu, et al., Citation2017; Z. Ge, Suryoprabowo, Zheng, & Kuang, Citation2017; Wang, Zheng, et al., Citation2017).
Although LFIC testing is widely used, to the best of our knowledge, no LFIC device for the detection MAB and MAP residues has been described. Therefore, the aim of this study was to develop a LFIC method for the detection of MBA and MAP in pig urine.
Materials and methods
Chemicals and reagents
MAB and MAP were purchased from J&K Scientific (Shanghai, China). Complete Freund’s adjuvant (FCA), incomplete Freund’s adjuvant (FIA), and enzyme immunoassay-grade horseradish peroxidase (HRP)-labelled goat anti-mouse immunoglobulin were obtained from Sigma-Aldrich (St. Louis, MO, USA). Gelatin was supplied by Beijing Biodee Biotechnology Co., Ltd. (Beijing, China). Tetramethylbenzidine and HRP were from Aladdin Chemistry Co., Ltd. (Shanghai, China). All reagents used for cell fusion were purchased from Sunshine Biotechnology Co., Ltd. (Nanjing, China). Bovine serum albumin (BSA) and keyhole-limpet hemocyanin (KLH) were obtained from Solarbio Science & Technology, Co, Ltd. (Beijing, China). All other reagent and chemicals were supplied by the National Pharmaceutical Group Chemical Reagent Co, Ltd. (Shanghai, China).
Nitrocellulose (NC) high-flow plus membranes (Pura-bind RP) were obtained from Whatman-Xinhua Filter Paper Co., Ltd. (Hangzhou, China). The glass fibre membrane (CB-SB08) used for the sample pad, the polyvinylchloride (PVC) backing material and the absorbance pad (SX18) were supplied by Goldbio Tech Co., Ltd. (Shanghai, China). The conjugated coating antigens (MAB-BSA) and specific monoclonal antibody (anti-MAB mAb) were generated in our laboratory.
All buffer solutions were prepared with ultrapure water (Milli-Q Purification System, Millipore Co., Bedford, MA, USA). The strip-cutting instrument was a CM-4000 Guillotine Cutting System (Gene, Shanghai, China), and the dispensers used were the Airjet Quanti 3000™ and Biojet Quanti 3000™ (XinqidianGene Technology Co., Ltd., Beijing, China).
Preparation and characterization of anti-MAB monoclonal antibody (mAb)
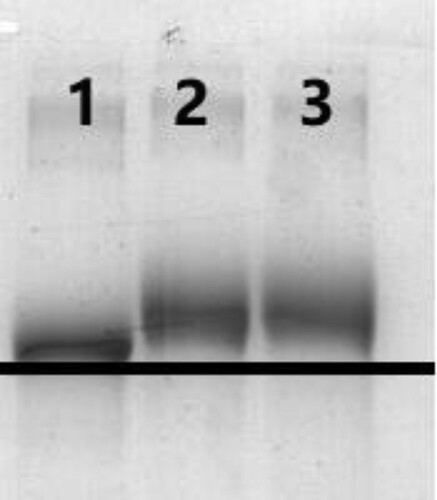
Because the majority of β-agonists have similar chemical structures, we selected salbutamol as the hapten (SAL-hapten). It was synthesized using the succinic anhydride method (R. Liu, Liu, et al., Citation2017) and conjugated to BSA (SAL-BSA) (). Briefly, 10 mg of SAL-hapten was dissolved in 800 µL of dimethylformamide (DMF) and 1 mL of 0.1 M 2-[N-morpholino] ethanesulfonic acid (pH 4.7). 1-Ethyl-3-(3-dimethylaminopropyl) carbodiimide (EDC) and N-hydroxy succinimide (NHS) were added. The mixture was gently stirred for 4 h at room temperature and then added dropwise to BSA dissolved in 4 mL of carbonate buffer (0.05 M, pH 9.5). After the conjugated SAL-BSA was stirred for 5 h at room temperature, it was dialyzed against 0.01 M carbon buffer for 3 days at room temperature. Polyacrylamide gel electrophoresis was used to confirm the presence of antigen which was stored at −20°C until use.
Figure 2. Polycrylamide gel electrophoresis image of coating antigen (1:BSA; 2: SAL-BSA (1:30); 3: SAL-BSA 1:60).
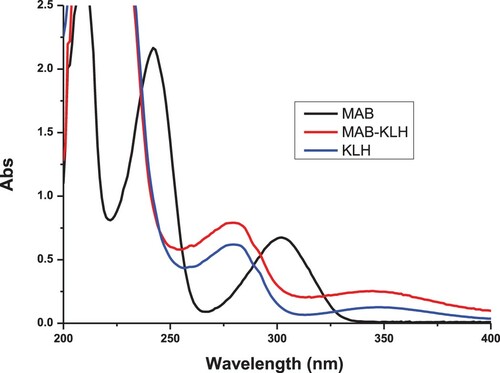
Female BALB/c mice (6–8 weeks old) were used to produce the mAb. The mice were immunized subcutaneously with a MAB-keyhole limpet hemocyanin (KLH) conjugate (). To construct this, MAB was dissolved in a 1 M hydrochloric acid (HCl) and methanol solution. The mixture was stored at 4°C for 0.5 h, and then 30% sodium nitrite (5 µL) was added and the mixture was stirred at 4°C for 1 h in the dark (solution I). KLH was dissolved in 0.1 M carbonate-bicarbonate buffer (pH 9.6). Solution 1 was added to the protein solution and stirred for 4 h in the dark. The conjugate was dialyzed against 0.01 M PBS for 3 days. Ultraviolet absorption was used to check the conjugation of KLH and MAB which was then dialyzed against distilled water for 3 days. The antigen was stored at −20°C before use.
Figure 3. The UV spectra characterization for MAB, MAB-KLH, and KLH.
The mice were first immunized with FCA and FIA was used in the subsequent booster injections. The mice were immunized every 3 weeks with 100 µg for the first immunization and 50 µg for subsequent injections (2–5 times). The antibodies in the blood samples from the immunized mice were measured with an ELISA. The mouse with the highest titre was killed and its splenocytes were fused with Sp 2/0 murine myeloma cells. The resulting hybridomas were then screened with an indirect ELISA. The selected hybridoma cells were expanded and injected into BALB/c mice to produce the mAb. The ascites was harvested and purified with the caprylic acid-ammonium sulfate precipitation method (X. Chen et al., Citation2014). The purified antibody was stored at −20°C until use.
Development of the lateral-flow test device
Preparation of colloidal gold nanoparticles
All the solvents were prepared with ultrapure water and then filtered through a transfer membrane (0.22 µm). Chlorauric acid (25 mL of 0.1 g/L solution) was heated to boiling with constant stirring, and then 1% (w/v) sodium citrate tribasic dihydrate solution (1.0 mL) was added. The mixture was stirred for 30 min until the colour of the solution turned wine-red, then cooled to room temperature, and stored at 4 °C. Transmission electron microscopy (TEM) analysis showed that the gold nanoparticles had a nearly uniform particle size of 15 nm.
Preparation of colloidal gold-labelled mAb
The anti-MAB mAb which had a half-maximal inhibitory concentration (IC50) of 1 ng/mL was used. Colloidal gold solution (10 mL) was adjusted to pH 7.0 with 0.1 M K2CO3 (40 µL). Briefly, 0.50 mL of 0.2 mg/mL mAb solution was added dropwise to the colloidal gold solution, and 35 min later, 1 mL of 10% (w/v) BSA was added, and the mixture was stirred for 2 h. The product was centrifuged for 45 min at 8000 rpm to remove any gold aggregate. The solution separated into two layers, and the lower layer (red gold-labelled mAb) was collected and washed with 0.02 M phosphate buffer (pH 7.4) containing 5% sucrose, 1% BSA, and 0.5% polyethylene glycol (PEG) 6000. The conjugation product was reconstituted to 1 mL in gold-labeling resuspension buffer (0.02 M PBS, 5% sucrose, 2% sorbitol, 1% mannitol, 0.1% PEG, 0.1% Tween, and 0.04% NaN3) and stored at 4°C until use.
Preparation of nitrocellulose capture membranes
The coating antigen (SAL-BSA) and goat anti-mouse IgG antibody were sprayed onto the NC membrane at concentrations of 1 µL/cm using a dispenser, resulting in the formation of the test line and control line, respectively. The capture and control reagents were sprayed onto the glass fibre membrane to prepare the conjugate pad, which was dried at 37°C for 2 h. The NC membrane containing the capture reagents was pasted onto the centre of the plastic backing plate (PVC) and the conjugate pad, sample pad, and absorbent pad were laminated and pasted onto the plate. Finally the plate was cut into strips (2.8 mm wide) with a strip cutter.
Test procedure and principle
The gold labelled mAb (50 µL) was mixed with of 150 µL of sample solution, allowed to react for about 5 min, and then applied to the sample pad. The solution migrated along the absorbent pad and the test result was obtained within 5 min. If MAB was present in the sample, it competed with the SAL-BSA conjugates embedded in the test line for the finite amount of anti-MAB mAb added to the sample. When a sufficient amount of MAB was present in the sample, the free MAB bound all the gold-labelled mAb, preventing the mAb binding to the SAL-BSA in the test line. Therefore, the more MAB that was present in the sample, the weaker the colour of the test line. If there was no MAB, the limited amount of colloidal-gold-labelled mAb was trapped by the immobilized SAL-BSA conjugate, and a clearly visible red test line appeared.
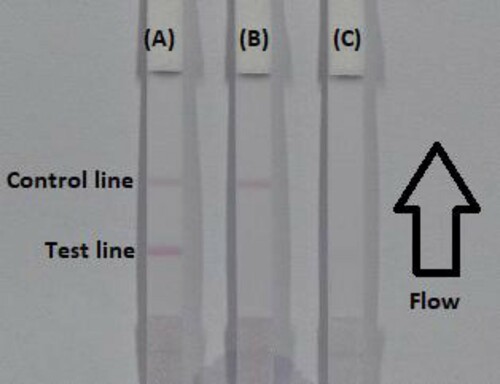
When the flow of sample reached the control line, which contained the goat anti-mouse IgG antibody, it also produced an indicator reaction. Therefore, the control line must always appear in a successful test, whereas the test line will only appear when the sample is negative (A). The appearance of the control line alone is a positive result (B), whereas if neither the control line nor the test line appear (C), the test procedure was incorrect or the strip was invalid, indicating that the test should be repeated with a new strip.
Figure 4. The illustration of strip results (A) the sample is negative; (B) positive result if the C line appears alone; (C) invalid result if the control and test line doesn’t appears. C = control line. T = test line.
Determination of performance
Sensitivity of the test strip
The sensitivity of the test strip was determined by testing MAB and MAP samples. Firstly, both the MAB and MAP standards were diluted to a series of concentrations for 0, 0.5, 1, 2.5, 5, and 10 ng/mL in 0.01 M PBS (pH7.4) and the detection limits were determined. The sample solution (100 µL) was mixed with gold-labelled mAb (50 µL), allowed to react for 5 min, and then added to the sample pad. After 5 min, the colour intensities of the different strips were recorded with a test strip reader. The lowest detection limit (LDL) that could be detected with the naked eye, was defined as the amount of MAB or MAP which could produce a visibly different colour reaction between the positive samples and the negative samples on the strip. Six replicate samples for each concentration were analyzed on the same day.
Detection of MAB and MAP in pig urine
The detection methods of MAB and MAP in pig urines were developed by using spiked samples. The spiked samples were prepared by adding MAB or MAP standard solutions to the negative pig urines to reach to a final concentration of 1, 2.5, 5, and 10 ng/mL, respectively. The MAB or MAP standard solutions with a concentration of 10 µg/mL were prepared with pH 7.4, 0.01 M phosphate buffered saline. An un-spiked (blank) sample was used as the control. Six replicates of each concentration were analyzed with the test strips.
Results and discussion
Optimization of the strip test
Proteins are not compatible with every surfactant. To function as the reaction matrix in an immunochromatographic assay, the strip materials must be hydrophilic and have consistent flow characteristics. Nitrocellulose, used as the base material, is normally hydrophobic, but it should be made to be hydrophilic by the addition of rewetting agents during the membrane-production process. Many factors affect the binding process and these must be considered when developing assays and processing NC membranes. Some of these factors include: (1) reagent choices: non-specific proteins such as bulking proteins (BSA, casein) compete for binding sites, materials that interfere with hydrophobic interactions (Tween and Triton), and polymers such as polyvinyl acetate, polyvinylpyrrolidone (PVP), and PEG; (2) environmental humidity should be optimized for binding (25–50% relative humidity at room temperature).
In this study, the suspension buffer (containing 5% sucrose, 2% sorbitol, 1% mannitol, 0.1% PEG, 0.1% Tween, and 0.04% NaN3 in 0.02 M PBS) was added with seven reagents, such as PVP, PEG, BSA, Tween-20, Brij-35, Triton X-100, and Rhodasurf®On-870 (an ethoxylated oleyl alcohol). As shown in , BSA added to the suspension buffer produced the best and most stable colour reactions, and was used for subsequent experiments. The concentrations of the coating antigen and colloidal-gold-labelled mAb most strongly affected the sensitivity of the LFIC strip. The coating antigen was synthesized in our laboratory and its concentration was optimized. Strips with different coating antigen concentrations (0.5 or 1 mg/mL) on the test line were evaluated with 0.01 M PBS (pH 7.4) containing either 0 or 5 ng/mL MAB. Both coating antigen concentrations resulted in colour development in both the control and test lines. There were significant differences in colour intensity when 0.5 or 1 mg/mL coating antigen was used. Specifically, 1 mg/mL coating antigen resulted in a deeper colour intensity than 0.1 mg/mL coating antigen. The result that no colour could be found on the test line when using a concentration of 1 mg/mL coating antigen and a concentration of 5 ng/mL MAB standard, indicated that a more sensitive detection could be achieved. Therefore, 1 mg/mL coating antigen was selected for the preparation of the test line ().
Figure 5. Result of using 7 kinds of reagent. 1 = suspension buffer, 2 = PVP, 3 = PEG, 4 = BSA, 5 = Tween-20, 6 = Brij-35, 7 = Trixton X-100, and 8 = On-870. a = negative (0 ng/mL). b = positive (1 ppb).
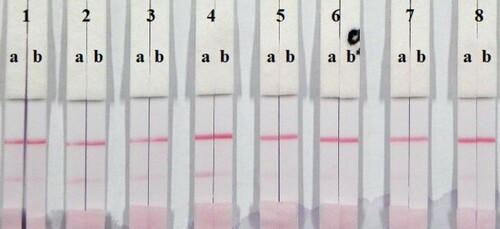
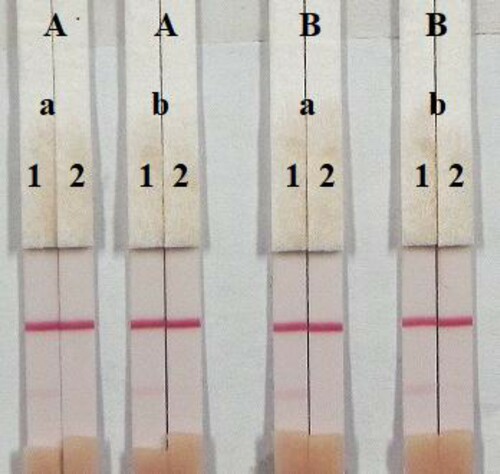
Figure 6. Optimization of the immunochromatographic strip. Concentration of coating antigen (A) 0.5 mg/mL; (B) 1 mg/mL. The dosage of the mAb that add in GNP: (1) 8 µg/L; (2) 10 µg/L. The standard concentration: (a) 0 ng/mL; (b) 5 ng/mL.
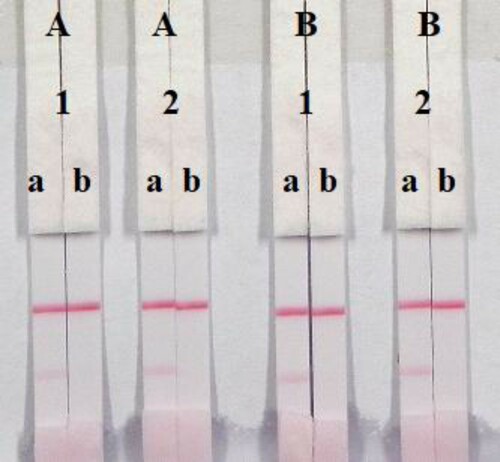
The concentration of mAb that is added to gold nanoparticle affects the sensitivity of the LFIC strip. A reaction system (50 µL) containing different concentrations of mAb (8 or 10 µg/L), was allowed to react with MAB-negative (0 ng/mL) and MAB-positive (5 ng/mL) samples. shows that there were slight differences in colour intensity when 8 or 10 µg/L mAb was used. Although 8 and 10 µg/L mAb resulted in adequate colour intensities on the control line and test line, we observed that the optimum concentration of mAb in gold nanoparticles was 10 µg/L, because it contributed to strong colour intensities on both control line and test line when the negative sample and the positive sample were tested, and thus could lead to achieve more sensitive detection limit. Therefore, the optimal system for our developed LFIC strip consisted of 1 mg/mL coating antigen and 10 µg/L of mAb in gold nanoparticles.
The assay sensitivity was investigated with a series of diluted MAB standards. The LDL detected by the naked eye was set as the amount of MAB that could produce a clearly visible change on the colour intensity of the test strip by comparing with the negative control sample. As shown in , the signal colour on the test line changed from strong to weak and disappeared completely at 10 ng/mL MAB in 0.01 M PBS (pH 7.4). The cross-reactivity of the assay was determined by testing MAP at concentrations of 0, 0.5, 1, 2.5, 5, and 10 ng/mL in 0.01 M PBS (pH 7.4). As shown in , strong colour was observed on the test line when testing the spiked sample with a concentration of 0 to 1 ng/mL MAP, but it disappeared completely when the concentration of MAP reached to 10 ng/mL.
Figure 7. Colloidal gold immunochromatographic for MAB in 0.01 M PBS (pH 7.4). MAB concentration: 1 = 0 ng/mL; 2 = 0.5 ng/mL; 3 = 1 ng/mL; 4 = 2.5 ng/mL; 5 = 5 ng/mL; and 6= 10 ng/mL.
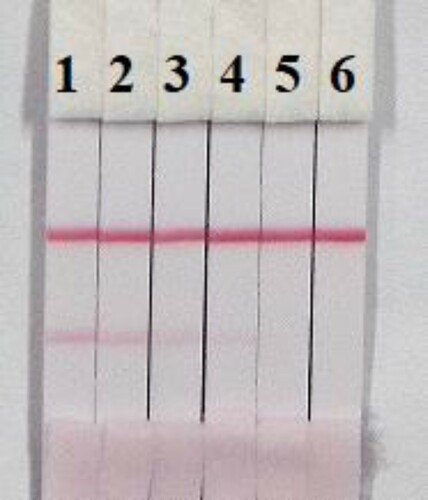
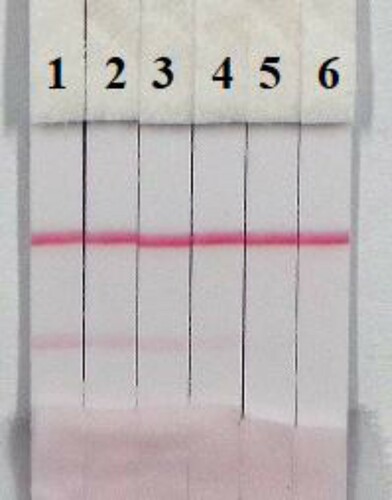
Figure 8. Colloidal gold immunochromatographic for MAP in 0.01 M PBS (pH 7.4). MAP concentration: 1= 0 ng/mL; 2= 0.5 ng/mL; 3 = 1 ng/mL; 4 = 2.5 ng/mL; 5 = 5 ng/mL; and 6 = 10 ng/mL.
Detection of MAB and MAP in pig urine
The concentrations of mAbs in the gold nanoparticles and coating antigen affected the sensitivity of the assay. Two different concentrations of mAb (8 or 10 µg/mL) were allowed to react with MAB-negative samples (0 ng/mL) and MAB-positive samples (5 ng/mL). The difference in the colour intensity produced with 0.5 and 1 mg/mL coating antigen was significant. The colour intensity of the test line with 0.5 mg/mL coating antigen was weaker than with 1 mg/mL coating antigen, suggesting that more sensitive detection could be achieved at 1 mg/mL coating antigen. As shown in , the optimum conditions for the detection of MAB in pig urine were 1 mg/mL coating antigen and 10 µg/mL mAb in the gold nanoparticles.
Figure 9. Optimization of the immunochromatographic strip in pig urine. Concentration of coating antigen (A) 0.5 mg/mL; (B) 1 mg/mL. The dosage of the mAb that add in GNP: (a) 8 µg/L; (b) 10 µg/L. The standard concentration: (1) 0 ng/mL; (2) 5 ng/mL.
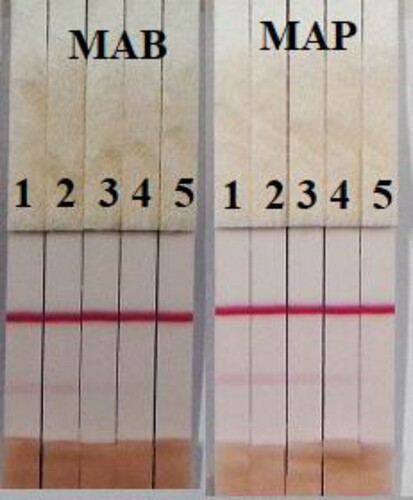
In this study, we determined the effects of the matrix on our immunochromatographic assay for MAB and MAP using pig urine. The advantages of this immunochromatographic assay are that it is rapid and easy to use. The pig urine was spiked with 10 µg/mL MAB or MAP standard, prepared with 0.01 M PBS (pH 7.4) and the final concentrations of MAB and MAP in the pig’s urine were 1, 2.5, 5, and 10 ng/mL. Under optimal conditions (), the colour intensity decreased as the MAB and MAP concentration increased. The signal colour changed from strong to weak, and disappeared completely at 10 ng/mL for both MAB and MAP.
Figure 10. Result of MAB and MAP spiked in pig urine. MAB and MAP standard concentration: 1 = 0 ng/mL; 2 = 1 ng/mL; 3 = 2.5 ng/mL; 4 = 5 ng/mL; and 5 = 10 ng/mL.
Conclusions
A LFIC strip test assay was developed as a sensitive, simple, and rapid analytical method for the detection of MAB and MAP in pig urine samples. Under optimal conditions, the cut-off limits of the semi-quantitative test strip for MBA and MPA were as low as 10 ng/mL in both 0.01 M PBS (pH 7.4) and pig urine. All the results were obtained within 5 min.
Disclosure statement
No potential conflict of interest was reported by the authors.
Additional information
Funding
References
- Bocca, B., Fiori, M., Cartoni, C., & Brambilla, G. (2003). Simultaneous determination of zilpaterol and other β agonists in calf eye by gas chromatography/tandem mass spectrometry. Journal of Aoac International, 86(1), 8–14.
- Borrey, D., Meyer, E., Lambert, W., Van Peteghem, C., & De Leenheer, A. P. (2001). Simultaneous determination of fifteen low-dosed benzodiazepines in human urine by solid-phase extraction and gas chromatography-mass spectrometry. Journal of Chromatography B: Biomedical Sciences and Applications, 765(2), 187–197. doi: https://doi.org/10.1016/S0378-4347(01)00419-4
- Bovee, T. F. H., Mol, H. G. J., Bienenmann-Ploum, M. E., Heskamp, H. H., Van Bruchem, G. D., Van Ginkel, L. A., … Hoogenboom, R. L. A. P. (2016). Dietary supplement for energy and reduced appetite containing the β-agonist isopropyloctopamine leads to heart problems and hospitalisations. Food Additives and Contaminants Part a-Chemistry Analysis Control Exposure & Risk Assessment, 33(5), 749–759.
- Cardoso, L. A., & Taveira, O. (2002). Effect of clenbuterol on growth, nitrogen and energy balances and endocrine status in food-restricted sheep. Journal of the South African Veterinary Association-Tydskrif Van Die Suid-Afrikaanse Veterinere Vereniging, 73(3), 127–130.
- Chen, Y., Guo, L., Liu, L., Song, S., Kuang, H., & Xu, C. (2017). Ultrasensitive immunochromatographic strip for fast screening of 27 sulfonamides in honey and pork liver samples based on a monoclonal antibody. Journal of Agricultural and Food Chemistry, 65(37), 8248–8255. doi: https://doi.org/10.1021/acs.jafc.7b03190
- Chen, X., Xu, L., Ma, W., Liu, L., Kuang, H., Wang, L., & Xu, C. (2014). General immunoassay for pyrethroids based on a monoclonal antibody. Food and Agricultural Immunology, 25(3), 341–349. doi: https://doi.org/10.1080/09540105.2013.794328
- Chu, L., Zheng, S., Qu, B., Geng, S., & Kang, X. (2017). Detection of β-agonists in pork tissue with novel electrospun nanofibers-based solid-phase extraction followed ultra-high performance liquid chromatography/tandem mass spectrometry. Food Chemistry, 227, 315–321. doi: https://doi.org/10.1016/j.foodchem.2017.01.059
- Degand, G., Bernesduyckaerts, A., Delahaut, P., & Maghuinrogister, G. (1993). Determination of β-agonists in urine by an enzyme immunoassay based on the use of an anti-salbutamol antiserum. Analytica Chimica Acta, 275(1-2), 241–247. doi: https://doi.org/10.1016/0003-2670(93)80298-Y
- Deng, X., Liu, L., Ma, W., Xu, C., Wang, L., & Kuang, H. (2012). Development and validation of a sandwich ELISA for quantification of peanut agglutinin (PNA) in foods. Food and Agricultural Immunology, 23(3), 265–272. doi: https://doi.org/10.1080/09540105.2011.617358
- Ding, X., Liu, L., Song, S., Kuang, H., & Xu, C. (2017). Rapid and ultrasensitive detection of 3-amino-2-oxazolidinone in catfish muscle with indirect competitive enzyme-linked immunosorbent and immunochromatographic assays. Food and Agricultural Immunology, 28(3), 463–475. doi: https://doi.org/10.1080/09540105.2017.1297778
- Du, X.-D., Wu, Y.-L., Yang, H.-J., & Yang, T. (2012). Simultaneous determination of 10 β(2)-agonists in swine urine using liquid chromatography-tandem mass spectrometry and multi-walled carbon nanotubes as a reversed dispersive solid phase extraction sorbent. Journal of Chromatography A, 1260, 25–32. doi: https://doi.org/10.1016/j.chroma.2012.08.066
- Fesser, A. C. E., Dickson, L. C., MacNeil, J. D., Patterson, J. R., Lee, S., & Gedir, R. (2005). Determination of β-agonists in liver and retina by liquid chromatography-tandem mass spectrometry. Journal of Aoac International, 88(1), 61–69.
- Ge, W., Suryoprabowo, S., Zheng, Q., & Kuang, H. (2017). Development of an immunochromatographic test strip for the detection of papaverine in pure ginger powder. Food and Agricultural Immunology, 28(6), 1304–1314.
- Hernandez-Carrasquilla, M. (2000). Gas chromatography-mass spectrometry analysis of β2-agonists in bovine retina. Analytica Chimica Acta, 408(1-2), 285–290. doi: https://doi.org/10.1016/S0003-2670(99)00808-9
- Isanga, J., Mukunzi, D., Chen, Y., Suryoprabowo, S., Liu, L., Kuang, H., & Xu, C. (2017). Development of a monoclonal antibody assay and a lateral flow strip test for the detection of paromomycin residues in food matrices. Food and Agricultural Immunology, 28(3), 355–373. doi: https://doi.org/10.1080/09540105.2016.1272551
- Jiang, D., Cao, B., Wang, M., Yang, H., Zhao, K., Li, J., … Deng, A. (2017). Development of a highly sensitive and specific monoclonal antibody based enzyme-linked immunosorbent assay for the detection of a new β-agonist, phenylethanolamine A, in food samples. Journal of the Science of Food and Agriculture, 97(3), 1001–1009. doi: https://doi.org/10.1002/jsfa.7826
- Kuiper, H. A., Noordam, M. Y., van Dooren-Flipsen, M. M. H., Schilt, R., & Roos, A. H. (1998). Illegal use of β-adrenergic agonists: European community. Journal of Animal Science, 76(1), 195–207. doi: https://doi.org/10.2527/1998.761195x
- Li, J., Chen, Y., Su, Y.-Q., Ding, X.-M., Xia, W.-S., Liu, H.-M., & Zhang, Y.-B. (2017). Single-Step multiresidue determination of β-lactam antibiotics and β-agonists in porcine muscle by liquid chromatography-tandem mass spectrometry. Food Analytical Methods, 10(7), 2185–2193. doi: https://doi.org/10.1007/s12161-016-0738-5
- Liu, R., Liu, L., Song, S., Cui, G., Zheng, Q., Kuang, H., & Xu, C. (2017). Development of an immunochromatographic strip for the rapid detection of 10 β-agonists based on an ultrasensitive monoclonal antibody. Food and Agricultural Immunology, 28(4), 625–638. doi: https://doi.org/10.1080/09540105.2017.1309358
- Liu, L., Suryoprabowo, S., Zheng, Q., Song, S., & Kuang, H. (2017). Rapid detection of aldicarb in cucumber with an immunochromatographic test strip. Food and Agricultural Immunology, 28(3), 427–438. doi: https://doi.org/10.1080/09540105.2017.1293015
- Nie, J., Zhu, M., Lian, J., Pan, Y., Deng, X., & Hu, C. (2012). Determination of fifteen β-agonists in animal urine by high performance liquid chromatography-tandem mass spectrometry. Chinese Journal of Chromatography, 28(8), 759–764. doi: https://doi.org/10.3724/SP.J.1123.2010.00759
- Osada, E., Murai, T., Ishizaka, Y., & Sanai, K. (1984). Pharmacological studies of mabuterol, a new selective β2-stimulant. II: Effects on the cardiovascular system and smooth muscle organs. Arzneimittel-Forschung, 34(11A), 1641–1651.
- Quoc Anh, B., Thi Huynh Han, V., Vo Ke Thanh, N., Kennedy, I. R., Lee, N. A., & Allan, R. (2016). Development of an ELISA to detect clenbuterol in swine products using a new approach for hapten design. Analytical and Bioanalytical Chemistry, 408(22), 6045–6052. doi: https://doi.org/10.1007/s00216-016-9750-2
- Ramos, F., Santos, C., Silva, A., & da Silveira, M. I. N. (1998). β2-Adrenergic agonist residues: Simultaneous methyl- and butylboronic derivatization for confirmatory analysis by gas chromatography–mass spectrometry. Journal of Chromatography B: Biomedical Sciences and Applications, 716(1-2), 366–370. doi: https://doi.org/10.1016/S0378-4347(98)00292-8
- Suryoprabowo, S., Liu, L. Q., Peng, J., Kuang, H., & Xu, C. L. (2015). Antibody for the development of specific immunoassays to detect nadifloxacin in chicken muscles. Food and Agricultural Immunology, 26(3), 317–324. doi: https://doi.org/10.1080/09540105.2014.914469
- Wang, X., Guo, T., Wang, S., Yuan, J., & Zhao, R. (2015). Simultaneous determination of 11 β-agonists in human urine using high-performance liquid chromatography/tandem mass spectrometry with isotope dilution. Journal of Analytical Toxicology, 39(3), 213–218. doi: https://doi.org/10.1093/jat/bku143
- Wang, W., Liu, L., Song, S., Xu, L., Zhu, J., & Kuang, H. (2017). Gold nanoparticle-based paper sensor for multiple detection of 12 listeria spp. by P60-mediated monoclonal antibody. Food and Agricultural Immunology, 28(2), 274–287. doi: https://doi.org/10.1080/09540105.2016.1263986
- Wang, Z., Xie, Z., Cui, G., Liu, L., Song, S., Kuang, H., & Xu, C. (2017). Development of an indirect competitive enzyme-linked immunosorbent assay and immunochromatographic assay for hydrocortisone residues in milk. Food and Agricultural Immunology, 28(3), 476–488. doi: https://doi.org/10.1080/09540105.2017.1297779
- Wang, Z., Zheng, Q., Guo, L., Suryoprabowo, S., Liu, L., & Kuang, H. (2017). Preparation of an anti-dexamethasone monoclonal antibody and its use in development of a colloidal gold immunoassay. Food and Agricultural Immunology, 28(6), 958–968.
- Xie, Z., Kong, D., Liu, L., Song, S., & Kuang, H. (2017). Development of ic-ELISA and lateral-flow immunochromatographic assay strip for the simultaneous detection of avermectin and ivermectin. Food and Agricultural Immunology, 28(3), 439–451. doi: https://doi.org/10.1080/09540105.2017.1293016
- Xu, T., Wang, B. M., Sheng, W., Li, Q. X., Shao, X. L., & Li, J. (2007). Application of an enzyme-linked immunosorbent assay for the detection of clenbuterol residues in swine urine and feeds. Journal of Environmental Science and Health Part B-Pesticides Food Contaminants and Agricultural Wastes, 42(2), 173–177.
- Zvereva, E. A., Zherdev, A. V., Xu, C., & Dzantiev, B. B. (2018). Highly sensitive immunochromatographic assay for qualitative and quantitative control of β-agonist salbutamol and its structural analogs in foods. Food Control, 86, 50–58. doi: https://doi.org/10.1016/j.foodcont.2017.11.003