
ABSTRACT
Early prevention and monitoring of Ralstonia solanacearum (Rs) on nightshade is extremely critical for potent prevention and treatment of bacterial wilt disease. We developed two kinds of lateral flow immunochromatographic strip (LFICS) using gold nanoparticles (GNPs) and fluorescein isothiocyanate (FITC) for rapid diagnosis of plant bacterial wilt, caused by Ralstonia solanacearum (Rs), which both were based on double antibody sandwich method. Three monoclonal antibodies (McAb) highly specific to Rs were obtained by cell fusion and screening after four times of immunization with the strain GIM 1.76. Under optimized conditions, the limit of detection (LOD) with GNPs and FITC were 104 colony forming units per millilitre (CFU/mL) and 106 CFU/mL respectively, then the range detection correspondingly were 104–109 CFU/mL and 106–109 CFU/mL. On top of that, the developed immunoassay could be used for spot and point-of-care testing Rs on tomato seed, ginger seed, casuarina seed and display no cross-reaction with 43 other phytopathogenic strains that also could infect plants so as to cause plants diseases. These results demonstrated that we sucessfully developed two simple, effective and sensitive strips for monitoring bacterial wilt infection. Meanwhile, this is the first report about LFICS labelled by FITC for rapid detection of Rs, and it is the first time conformed that the sensitive of the LFICS with GNPs is significantly higher than FITC.
1. Introduction
Plant bacterial wilt, “one of the plant cancers “, caused by gram-negative bacteria Ralstonia solanacearum (Rs) is a worldwide destructive bacterial disease to a majority of economically important plant species, such as, tomato, ginger, bananas, eggplants, potato, mulberry, casuarina and so forth (Rajeshwari et al., Citation1998). Rs usually spread with irrigation water, soil and seedlings, seed of zingiber, potato seed and other plant propagation materials. Infected plants could be visually distinguished by analysing symptom, whereas latent infections in plant tissues, propagating stocks or infected seed need diagnosing by other relevant technologies (Chen et al., Citation2010). Consequently, Rs, an agricultural and ecological threat, has become a quarantine organism nearly all over the world, early detection of Rs must be the first and foremost step (Caruso et al., Citation2002).
There are several reports about the detection of Rs including biochemical methods and immunochemical reaction. Previous articles appeared that PCR, such as real-time quantitative PCR (qPCR) (Chen, et al., Citation2010; Li et al., Citation2014; Stulberg et al., Citation2016), duplex PCR assay (Cellier et al., Citation2015) and a droplet digital PCR (Dreo et al., Citation2014) were recommended as a reliable screening method. The enzyme linked immunosorbent assay (ELISA) (Behiry, Mohamed, Younes, Salem, & Salem, Citation2017; Caruso, et al., Citation2002; Khan, Akhtar, Pundhir, & Kumar, Citation2013; Rajeshwari et al., Citation1998) is a commonly applied for the detection of Rs in plant extracts, soil or water. Although these methods have advantages for the detection of Rs in the specialized laboratory, few methods can be used on-site examination. The lateral flow immunochromatographic strip (LFICS), an easy to operate, cost-effective, short time-consuming and portable tool for sensitive and specific routine detection of Rs, is helpful, particularly in poor-equipped laboratories, plantations or factories.
To date, there are a few reports about LFICS used for detection of Rs (Panferov et al., Citation2016). In spite of their higher sensitivities, polyclonal antibodies (pAb) utilized in their methods would affect usability because of lower specificity of pAb. Herein, three highly specific to Rs monoclonal antibodies (McAb)-1C1, 1B3, 9D7, were obtained by cell fusion and screening after four times of immunization with the strain GIM 1.76, and the LFICS methods using these McAb were developed for rapidly monitoring plant bacterial wilt caused by Rs on related pathogenic plants. The limit of detection (LOD) of the LFICS method using FITC as single fluorescent probe is 107 CFU/mL, and it is 106 CFU/mL using FITC as dual fluorescent probe. But the sensitivity here with FITC was comparatively lower than the same operation in other bacteria, for instance, of Escherichia coli O157:H7 (Song et al., Citation2011; Song, Li, Liu et al., Citation2016; Song, Liu, Wu et al., Citation2016) and Acidovorax citrulli (Zeng et al., Citation2016; Zeng, Zhai, Xie, & Liu, Citation2017; Zeng, Zhang, Zhai, Wang, & Liu, Citation2017). Therefore, we tried the traditional strips labelled with GNPs again. On the contrary with the conventional law, the surprising result is that the LOD of strips labelled with GNPs was 104 CFU/mL, which was significantly lower than strips labelled with FITC.
2. Material and methods
2.1. Bacterial strains and materials
The McAbs against Rs (1C1, 1B1, 9D7) were produced according to traditional hybridoma screening methods in our lab. Strains used to test strips specificity were listed in . Rs were cultivated in CPG medium (Sigma) at 37°C overnight, including 0.1% Casein acid hydrolysat, 1% peptone, 0.5% glucose (Kelman, Citation1954). The nitrocellulose membrane (NC membrane), polyvinyl chloride (PVC) baseboard, glass fibre membrane were purchased from Millipore. GNPs (25 nm in diameter) was synthesized using a citrate reduction method in our lab. FITC ≥ 90% (HPLC) was purchased from Sigma. All chemicals were of analytical or chemical grade, and used as received. All solutions in this study were prepared using water deionized by a Milli-Q system. Other experiment materials were purchased from Guangzhou Jet Bio-Filtration Co., Ltd.
Table 1. Bacterial strains used in this study.
2.2. Synthesis and optimization of GNPs-McAb conjugates
The McAbs against Rs (1C1, 1B1, 9D7) were adsorbed on the gold surface by ionic and hydrophobic interactions after optimization of pH value and antibody concentration respectively (Song, Li, Liu et al., Citation2016). Firstly, serial dilutions of 0.2 M K2CO3 solution were added into identical wells containing 100 μl GNPs to adjust the pH value of the reaction system, and excessive IgG about 10 μg was added into each well to react for 5 min. Then, 10 μL 10% NaCl was added to each well to react for 5 min, and the colour of the solution unchanged at this moment might be the appropriate pH system. Similar to the above method, different amount IgG were added into each GNPs well with the appropriate pH reaction system. The optimal lower antibody concentration will be confirmed by observing the solution colour.
After optimization of pH value and antibody concentration, an optimal pH value of GNPs was adjusted by adding corresponding amount of 0.2 M K2CO3 under gentle stirring. The optimal McAb against Rs amounts were added slowly dropwise into the GNPs and stirred for 30 min. Afterwards, 3% bovine serum albumin (BSA) solution amount 1/10 volume of GNPs was added and mixed for 1 h. Finally, the reaction solution was centrifuged at 1000 rpm for 10 min, then the supernatant immediately centrifuged at 12000rpm for 10 min. The precipitate was centrifuged again after resuspended with an equal volume of GNPs-McAb conjugates preservation solution (0.01 M TB buffer (pH 7.8) adding 1% sucrose, 0.5% Tween-20 and 1% BSA). At this point, GNPs-McAb against Rs conjugates was synthesized successfully and stored before use in the dark at 4°C.
After synthesis of GNPs-McAb conjugates, the dispensation amount of conjugates on the conjugate pad became a significant data to visible result. The optimal coverage of conjugates was determined ultimately when the visible colour intensity cannot change even as the amount of conjugates increases.
2.3. Synthesis and optimization of FITC-McAb conjugates
To be first, the McAbs against Rs approximately 2 mg/mL was dialysed in crosslinked reaction solutions (bicarbonate/carbonate buffer at pH 9.0-9.5) at less three times at 4°C (Song et al., Citation2011). Secondly, solid powder-FITC weighed accurately was dissolved in Dimethyl sulfoxide (DMSO), and added slowly dropwise to the above antibody solution until quality ratio of FITC and McAb equal to 15%. The reaction was carried out overnight at 4°C in the dark, and then the reaction was stopped with 5 M ammonium chloride for 2 h. Ultimately, the final reaction mixture was dialysed in PBS (2.9% Na2HPO3, 8% NaCl, 0.2% KCl, 0.2% KH2PO3) until the dialysate without a visible yellow-green light under ultraviolet (UV) light irradiation (Zeng et al., Citation2017). At this point, FITC-McAb against Rs conjugates was synthesized successfully and stored before use in the dark at 4°C.
After synthesis of FITC-McAb conjugates, we prepared different amount of FITC-McAb-1C1 conjugates (1, 1.5, 2, 2.5, 3, 3.5, 4, 4.5, 5μg) to test the strips. The optimal coverage of conjugates was sure of not only the sufficient visible colour, but also no false-positive in the strips with negative sample.
2.4. Bacteria culture and sample pretreatment
Cell counting of Rs was carried out using the plate method combined with the optical density estimated at 600 nm (OD600nm) (Safenkova et al., Citation2016). The different Rs cell concentration diluted by sterile PBS were as the sample of LFICS labelled by GNPs. Different amount of FITC solution was added in the Rs solution, then different concentration (0, 10, 20, 25, 30, 35 μg/mL) incubated together for 1 h in the dark at 37°C. The optimal concentration of FITC with the different bacterial strains of the Rs was determined by flow cytometry (Zeng et al., Citation2017). Afterwards, the corresponding reaction mixture diluted by sterile PBS was used as the sample of LFICS labelled with dual FITC.
2.5. Preparation of the LFICS
As shown in (A), the LFICS was composed of five parts generally, as following: a backing card, a sample pad, a conjugate pad, a detection pad and an absorption pad. In this study, a sample pad and a conjugate pad were glass-fibre membranes with different pretratements, and a backing card was made of a polyvinylchloride (PVC) sheet. NC membrane as a detection pad needs no special pretratement. The McAb against Rs (1 mg/mL) containing 1% mass-volume (M/V) BSA and the goat anti-mouse IgG antibody (1 mg/mL) were sprayed onto the NC membrane respectively as test line (T line) and control line (C line). The absorption pad was made of bibulous paper to maintain flow direction of liquid over the membrane and prevent backflow of the sample.
Figure 1. Schematic representation of the LFICS. (A) Schematic detection of the LFICS. (B) Positive result of the LFICS. (C) Negative result of the LFICS.
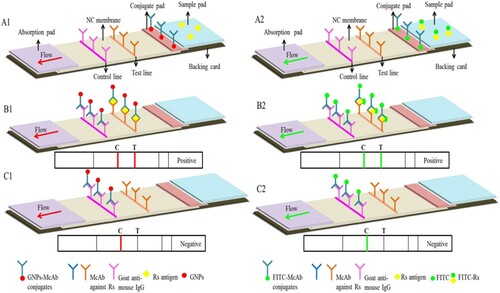
After assemblage just like , the multi-membrane composite was cut into strips of 3 mm widths by a guillotine cutter. At last, the LFICS cut were packed hermetically into bags with several of desiccant in order to reserve for follow-up experiment. In addition, the cutting and packing were carried out at 20–22°C in a separate room with relative humidity not exceeding 30%.
2.6. Evaluation of the performance of the LFICS
As shown in (B,C), the classic double antibodies sandwich theory was applied on the strips. If the presence of analyte in sample, two visible red lines by naked eye or yellow-green lines under UV light will appear at test and control line. If the absence of analyte in sample, one visible red line or yellow-green light will appear at the place of control line(Singh, Sharma, & Nara, Citation2015).
In brief, the Rs detection with the LFICS was carried out by dispensing 50 μL sample solution onto the sample pad of the strip. The red lines were observed by naked eye on the strip with the label of GNPs after 5-15 min. Nevertheless, the yellow-green lines were observed in a black box equipped with an UV light source and a fluorescent filter of 525 nm on the strip with the dual labels of FITC. Sterile PBS was the negative control on the strip with the label of GNPs. CPG medium with equal concentrations of FITC was the negative control on the strip with the dual labels of FITC. Finally, the results of the LFICS were recorded by a digital camera.
Due to there are three McAbs to make a pair, we should select one pair which has the stronger performance. The performances of the LFICS usually were evaluated by three aspects containing sensitivity, specificity and stability. Firstly, we used 103 to109 CFU/mL concentrations of the Rs to analyse sensitivity of the LFICS. Secondly, 43 other pathogenic strains that could infect plants cultured in different specific mediums were used to analyse specificity of the LFICS. Finally, the LFICS were stored for 6 months at room temperature to evaluate their stability after storage with the same operation as described above weekly.
2.7. Detection of simulated practical samples using the LFICS
To verify the application of the LFICS for spot and rapid testing Rs, we prepared tomato seed, ginger seed and casuarina seed confirmed to be free of Rs by a culture-based method (Wu, Wu, Zhang, Chen, & Guo, Citation2016). Different strains of Rs (ATCC-BAA1114, GIM 1.71 and GIM 1.76) were incubated with the pure practical samples to simulate contaminated samples. Subsequently, the artificial contamination were tested successively using the LFICS labelled with GNPs. Primarily, the Rs incubated together with FITC were added into the pure practical samples. Similarly, all the further operations were carried out as above using the LFICS labelled with FITC.
3. Results and discussion
3.1. Cell counting of bacteria strains
Three strains of Rs (ATCC-BAA1114, GIM 1.71 and GIM 1.76) were studied in this work on account of low sensitivity (LOD = 108 CFU/mL) of GIM 1.74 and no detection force for Rs-5 in pretest strips. The cell counting was performed respectively by combination the plate method with the optical density method. The result indicated that three strains of bacteria cell concentration could all up to around 1 × 10⁹ CFU/mL when the spectrophotometric data showed OD600nm of 0.6 more or less. Similarly, the cell concentration were 5 × 10⁹ CFU/mL when the OD600nm were up to 1.0. Based on this, the test condition-OD600nm was set at between 0.6 and 1.0.
3.2. Optimization of GNPs-McAb conjugates-based test strips
Initially, the pH value and minimum McAb concentration was adjusted to prepare GNPs-McAb conjugates. Afterwards, the conjugates amount added on strip was determined in the reaction system. The results showed that the optimal ratio of 0.2M K2CO3 to GNPs was 9: 1000 for GNPs-1C1 conjugates, the ratio for GNPs-1B1was 3: 1000, and GNPs and McAb-9D7 could’t combine together. Minimum concentration (M/V) of 1C1 to GNPs was 72 μg/mL, the mass-volume concentration of the 1B1 to GNPs was 108 μg/mL.
Through a large number of experiments, the LFICS (McAb-1C1 labelled by GNPs paired with 1B1 sprayed on the T line) owned the strongest sensitivity. Three strains of Rs (ATCC-BAA1114, GIM 1.71 and GIM 1.76) could be tested with this strip. The optimal coverage of conjugates coated on the absorption pad was listed in .
Table 2. The optimal coverage of conjugates coated on the absorption pad.
3.3. Optimization of FITC labelling-based test strips
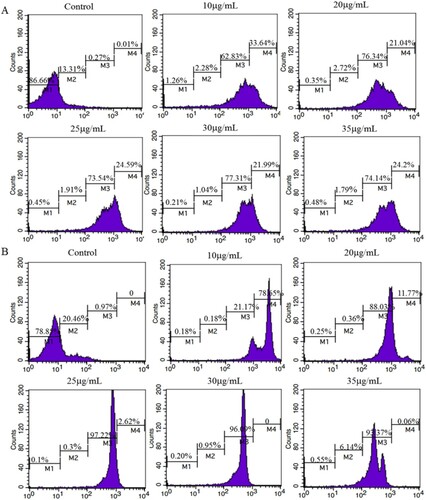
The optimal concentration of FITC with the different strains of Rs was determined by flow cytometry. As shown in , different strains of Rs incubated with different FITC concentrations (0, 10, 20, 25, 30, 35 μg/mL) had different distribution of fluorescence intensity. Obviously, the greater the proportion of bacteria with strong fluorescence intensity, the higher sensitivity of the test strip. Thus, the optimal concentration of FITC incubated with GIM 1.71 was 30μg/mL for both M3 and M3 + M4 were the highest percentage. In (B), the same analysis with (C), the optimal concentration of FITC incubated with ATCC-BAA1114 was 25 μg/mL.
Figure 2. The fluorescence intensity of RS incubated with different concentrations of FITC, which was completed by flow cytometry. (A) The fluorescence intensity of RS-GIM 1.71 incubated with different concentrations of FITC. (B) The fluorescence intensity of RS-ATCC-BAA1114 incubated with different concentrations of FITC. (M1): Cell proportion whose fluorescence intensity was 1–10. (M2): Cell proportion whose fluorescence intensity was 10–102. (M3): Cell proportion whose fluorescence intensity was 102–103. (M4): Cell proportion whose fluorescence intensity was 103–104.
With the same result with GNPs, the LFICS (McAb-1C1 labelled by FITC paired with 1B1) owned the strongest sensitivity. Two strains of Rs (ATCC-BAA1114, GIM 1.71) could be tested with this strip. With the dispensation amount of conjugates on the conjugate pad, the optimal coverage of conjugates was listed in . This result reveals that the antibodies’ amount labelled by FITC needed more than the other’s. Considering the preciousness of antibodies, the latter is better than the former at the application level.
3.4. Sensitivity, specificity and stability of test strips
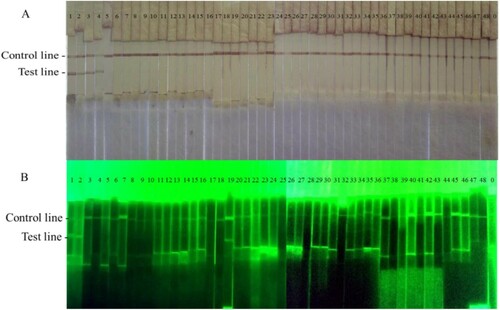
The LFICS labelled with GNPs is more valuable than using FITC in terms of sensitivity and specificity. Firstly, we could observe two red lines at the LFICS labelled with GNPs like until the concentration of 104 CFU/mL. Hence, the LOD of the LFICS labelled with GNPs was 104 CFU/mL. Similarly, the LOD of the LFICS labelled with dual FITC was 106 CFU/mL as in . Secondly, the result in indicated both kinds of LFICS have no cross-reaction with 43 other pathogenic strains that could infect plants. Finally, the LFICS, which had proved useful, had the same test results as described before after 6 months at room temperature.
Figure 3. The sensitivity of the LFICS labelled with GNPs.
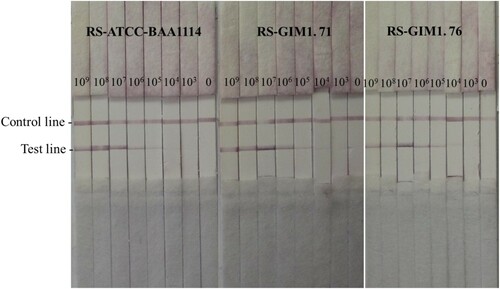
Figure 4. The sensitivity of the LFICS labelled with dual FITC.
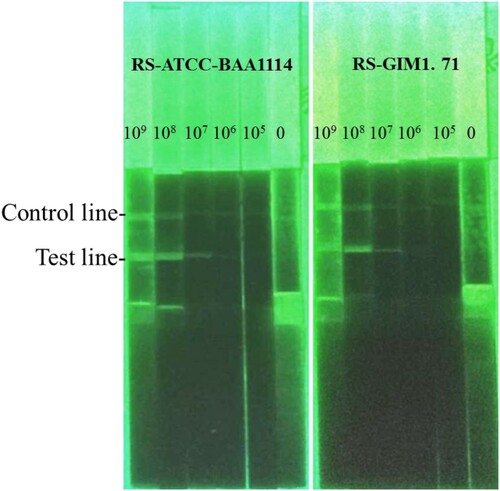
Figure 5. The cross-reaction of two kinds of LFICS. (A) The cross-reactivity of the LFICS labelled with GNPs. (B) The cross-reactivity of the LFICS labelled with dual FITC. 1-48: All the strains listed in . Note: 0: Negative control.
3.5. Detection of tomato, ginger and casuarina seeds
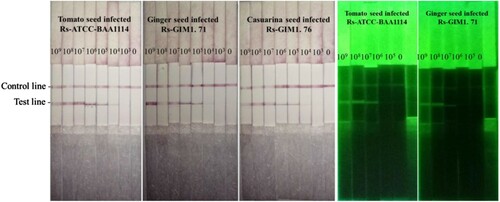
To ensure the applicability of the method for monitoring bacterial wilt infection in the fields, tomato seed, ginger seed and casuarina seed were prepared. Different strains of the Rs (ATCC-BAA1114, GIM 1.71 and GIM 1.76) incubated with the pure practical samples to simulate contaminated samples. According to the detection method mentioned above, results showed in were coincident with the results of pure bacteria solution. This also reflects the fact that the composition of the actual sample does not affect the detection of the test strip to Rs strains. Hence, there is a strong prospect that the LFICS can be reliably applied to the diagnosis of plant disease testing in the planting industry.
Figure 6. Detection of seed of practical sample by the LFICS.
4. Conclusion
The LFICS for detecting three strains of Rs (ATCC-BAA1114, GIM 1.71 and GIM 1.76) were developed successfully. The LOD (ATCC-BAA1114, GIM 1.71 and GIM 1.76) of LFICS with GNPs was improved to 104 CFU/mL after optimized, while the LOD (ATCC-BAA1114, GIM 1.71) with dual FITC was 106 CFU/mL. The strips had been proved that no cross-reaction with 43 other common pathogens of plants. Furthermore, both methods could be applied in the practical sample, such as Rs-ATCC-BAA1114 in tomato seed, Rs-GIM 1.71 in ginger seed and Rs-GIM 1.76 in casuarina seed. In conclusion, these LFICS we developed were feasible and efficient to detect Rs (ATCC-BAA1114, GIM 1.71 and GIM 1.76) so as to monitor bacterial wilt infection. Moreover, we found the sensitivity of strip with FITC was higher than GNPs, which is contrary to the conventional research. This triggered our thinking about the cause of this result.
In generally, the free ε-amino of the protein can undergo a nucleophilic reaction with isothiocyanato of FITC to form a thiourea linkage at pH 9.8. It was clearly evident from that antibody amount conjugated with FITC needs relatively more than the antibody amount conjugated with GNPs. Herein, we deduced, the result is concerned with the lysine content in proteins of Rs and their McAb. In addition, there are many reasons for the fluorescence quenching of FITC. For example, sulfhydryl groups of important components in the body, including cysteine, homocysteine and glutathione can react with the isothiocyanate of FITC, thereby generating new non-fluorescent substances (Gang et al., Citation2016). In this regard, we deduced, the result is concerned with some relevant components in Rs or their McAb. However, these both are guesses, and the real reason must need more theoretical knowledge and technology to explore or verify our ideas in our future study.
Acknowledgements
We thank Jiangsu University of Science and Technology for providing bacteria Ralstonia solanacearum for this study.
Disclosure statement
No potential conflict of interest was reported by the authors.
Additional information
Funding
References
- Behiry, S. I., Mohamed, A. A., Younes, H. A., Salem, M. Z. M., & Salem, A. Z. M. (2017). Antigenic and pathogenicity activities of Ralstonia solanacearum race 3 biovar 2 molecularly identified and detected by Indirect-ELISA. Microbial Pathogenesis, 115, 216. doi: https://doi.org/10.1016/j.micpath.2017.12.060
- Caruso, P., Gorris, M. T., Cambra, M., Palomo, J. L., Collar, J., & López, M. M. (2002). Enrichment double-antibody sandwich indirect enzyme-linked immunosorbent assay that uses a specific monoclonal antibody for sensitive detection of Ralstonia solanacearum in asymptomatic potato tubers. Applied and Environmental Microbiology, 68(7), 3634–3638. doi: https://doi.org/10.1128/AEM.68.7.3634-3638.2002
- Cellier, G., Moreau, A., Chabirand, A., Hostachy, B., Ailloud, F., & Prior, P. (2015). A Duplex PCR Assay for the Detection of Ralstonia solanacearum Phylotype II Strains in Musa spp. PloS One, 10(3), e0122182. doi: https://doi.org/10.1371/journal.pone.0122182
- Chen, Y., Zhang, W. Z., Liu, X., Ma, Z. H., Li, B., Allen, C., & Guo, J. H. (2010). A real-time PCR assay for the quantitative detection of Ralstonia solanacearum in the horticultural soil and plant tissues. Journal of Microbiology and Biotechnology, 20(1), 193–201.
- Dreo, T., Pirc, M., Ramšak, Ž., Pavšič, J., Milavec, M., Zel, J., & Gruden, K. (2014). Optimising droplet digital PCR analysis approaches for detection and quantification of bacteria: a case study of fire blight and potato brown rot. Analytical & Bioanalytical Chemistry, 406(26), pp. 6513-6528. doi: https://doi.org/10.1007/s00216-014-8084-1
- Gang, G., Yu, X., Xu, J., & Chen, H. (2016). A new method for rapid detection of sulfhydryl compounds[J]. Chemical Bulletin, 79(6), 550–553.
- Kelman, A. (1954). The relationship of pathogenicity of Pseudomonas solanacearum to colony appearance in a tetrazolium medium. Phytopathology, 693–695.
- Khan, R., Akhtar, J., Pundhir, V. S., & Kumar, A. (2013). Immunoprobe development for detection of Ralstonia solanacearum in potato (Solanum tuberosum) and tomato (Solanum lycopersicum). Indian Journal of Agricultural Sciences, 83(12), 281–285.
- Li, X., Nie, J., Hammill, D. L., Smith, D., Xu, H., & De Boer, S. H. (2014). A comprehensive comparison of assays for detection and identification of Ralstonia solanacearum race 3 biovar 2. Journal of Applied Microbiology, 117(4), 1132–1143. doi: https://doi.org/10.1111/jam.12585
- Panferov, V. G., Safenkova, I. V., Varitsev, Y. A., Drenova, N. V., Kornev, K. P., Zherdev, A. V., & Dzantiev, B. B. (2016). Development of the sensitive lateral flow immunoassay with silver enhancement for the detection of Ralstonia solanacearum in potato tubers. Talanta, 152, 521–530. doi: https://doi.org/10.1016/j.talanta.2016.02.050
- Rajeshwari, N., Shylaja, M. D., Krishnappa, M., Shetty, H. S., Mortensen, C. N., & Mathur, S. B. (1998). Development of ELISA for the detection of Ralstonia solanacearum in tomato: its application in seed health testing. World Journal of Microbiology & Biotechnology, 14(5), 697–704. doi: https://doi.org/10.1023/A:1008892400077
- Safenkova, I. V., Zaitsev, I. A., Varitsev, Y. A., Byzova, N. A., Drenova, N. V., Zherdev, A. V., & Dzantiev, B. B. (2016). Development of a lateral flow immunoassay for rapid diagnosis of potato blackleg caused by Dickeya species. Analytical & Bioanalytical Chemistry, 409(7), 1–13.
- Singh, J., Sharma, S., & Nara, S. (2015). Evaluation of gold nanoparticle based lateral flow assays for diagnosis of enterobacteriaceae members in food and water. Food Chemistry, 170, 470. doi: https://doi.org/10.1016/j.foodchem.2014.08.092
- Song, C., Li, J., Liu, J., & Liu, Q. (2016). Simple sensitive rapid detection of Escherichia coli O157:H7 in food samples by label-free immunofluorescence strip sensor. Talanta, s 156–157, pp. 42–47.
- Song, C., Liu, J., Li, J., & Liu, Q. (2011). Dual FITC lateral flow immunoassay for sensitive detection of Escherichia coli O157:H7 in food samples. Biosensors and Bioelectronics, 85(23), 734–739.
- Song, C., Liu, C., Wu, S., Li, H., Guo, H., Yang, B., … Zeng, H. (2016). Development of a lateral flow colloidal gold immunoassay strip for the simultaneous detection of Shigella boydii and Escherichia coli O157:H7 in bread, milk and jelly samples. Food Control, 59, pp. 345-351. doi: https://doi.org/10.1016/j.foodcont.2015.06.012
- Stulberg, M. J., Rascoe, J., Li, W., Yan, Z., Nakhla, M. K., & Huang, Q. (2016). Development and Comparison of TaqMan-Based Real-Time PCR Assays for Detection and Differentiation of Ralstonia solanacearum strains. Current Microbiology, 73(4), 542. doi: https://doi.org/10.1007/s00284-016-1091-z
- Wu, S., Wu, Q., Zhang, J., Chen, M., & Guo, W. (2016). Analysis of Multilocus Sequence Typing and Virulence Characterization of Listeria monocytogenes Isolates from Chinese Retail Ready-to-Eat Food. Frontiers in Microbiology, 7, 168.
- Zeng, H., Guo, W., Liang, B., Li, J., Zhai, X., Song, C., … Liu, Q. (2016). Self-paired monoclonal antibody lateral flow immunoassay strip for rapid detection of Acidovorax avenae subsp. citrulli. Analytical & Bioanalytical Chemistry, 408(22), 6071–6078. doi: https://doi.org/10.1007/s00216-016-9715-5
- Zeng, H., Zhai, X., Xie, M., & Liu, Q. (2017). Fluorescein isothiocyanate labeling antigen-based immunoassay strip for rapid detection of Acidovorax citrulli. Plant Disease, 102, 1–7.
- Zeng, H., Zhang, D., Zhai, X., Wang, S., & Liu, Q. (2017). Enhancing the immunofluorescent sensitivity for detection of Acidovorax citrulli using fluorescein isothiocyanate labeled antigen and antibody. Analytical & Bioanalytical Chemistry, 410(1), 71–77. doi: https://doi.org/10.1007/s00216-017-0690-2