
ABSTRACT
A rapid, simple, sensitive immunochromatographic strip test was developed to detect penbutolol (PB) in pig urine based on a sensitive and specific monoclonal antibody produced in our laboratory. The antigen (PB-ovalbumin) and a goat anti-mouse IgG antibody were drawn onto a nitrocellulose membrane as the test line and control line, respectively. Under optimised conditions, the semi-quantitative test strip detected PB at concentrations of 2.5 ng/mL in 0.01 M PBS (pH 7.4) and 0.5 ng/mL in pig urine. All results were obtained within 5 min. Our data indicate that this immunochromatographic assay can be used for the sensitive, rapid, and specific on-site screening of PB.
Introduction
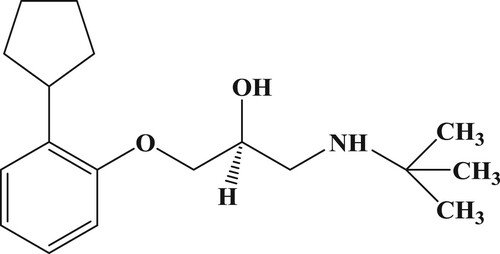
Penbutolol, (S)-1-(tert-butylamino)-3-(2-cyclopentylphenoxy)propan-2-ol (PB, ) binds to both β-1 adrenergic receptors and β-2 adrenergic receptors; thus, it is a non-selective β-blocker. PB is a medication in the β-adrenoreceptor blocker class of agents and is widely used for the treatment of patients with mild to moderately high blood pressure (Bernard, Cuisinaud, & Sassard, Citation1982). Blocking the β-adrenergic receptor reduces the heart rate and cardiac output, thus lowering the arterial blood pressure. It also reduces renin levels, which ultimately results in less water resorption by the kidneys, thus reducing the blood volume and blood pressure (Rodina et al., Citation2018) (Sun, Wang, Liu, Fu, & Yang, Citation2018). Therefore, it is vital that an accurate and sensitive detection method for PB is established.
Figure 1. Chemical structure of penbutolol.
Several methods have been reported for the detect and measurement of β-blockers including gas chromatography (del Rosario Brunetto et al., Citation2015) (Yilmaz & Arslan, Citation2011) (Paik, Lee, & Kim, Citation2007), thin- layer chromatography (Dzema et al., Citation2016) (Mennickent, Mario Vega, Mario Vega, De Diego, & Fierro, Citation2012), high- performance liquid chromatography (Alexandre et al., Citation2017) (Rodina et al., Citation2018) (Hemmati, Asghari, Bazregar, & Rajabi, Citation2016) (Zeeb, Farahani, & Papan, Citation2016), and liquid chromatography tandem mass spectrometry (de Oliveira et al., Citation2017) (Shah, Patel, Shah, Sanyal, & Shrivastav, Citation2016). However, these methods are time consuming and expensive as they require long clean-up procedures and sophisticated analytical instruments (Jiang, Zeng, Liu, Song, & Kuang, Citation2018) (Lin et al., Citation2018) (Suryoprabowo, Liu, Peng, Kuang, & Xu, Citation2015).
An immunoassay based on the highly specific interaction between an antigen and an antibody could provide a sensitive method for the detection of PB. Immunochromatographic assay test strips, also known as lateral-flow immunoassay (LFIA) test strips, are becoming increasingly popular as diagnostic tools for the detection of target analytes as they are simple to use, rapid, specific, and sensitive. Other advantages of this method are that all the reagents are contained within the strip and the results can be obtained within 5–10 min (Lei, Xu, Song, Liu, & Kuang, Citation2018) (Song, Zou, Zhu, Liu, & Kuang, Citation2018) (L. Liu, Suryoprabowo, Zheng, Song, & Kuang, Citation2017) (Mukunzi, Isanga, Suryoprabowo, Liu, & Kuang, Citation2017). Development β-adrenergic agonist residues in urine (Hu et al., Citation2017) (A. Liu et al., Citation2016) (Zhang et al., Citation2009) (Khaemba et al., Citation2016) have been detected using LFIA assay.
Although LFIA testing is widely used, to the best of our knowledge, no LFIA device for the detection of PB residues has been described. Therefore, the aim of this study was to develop a LFIA method for the detection of PB in pig urine.
Materials and methods
Chemicals and reagents
Penbutolol was purchased from J&K Scientific (Shanghai, China). Complete Freund's adjuvant (FCA), incomplete Freund's adjuvant (FIA), and an immunoassay-grade horseradish peroxidase (HRP)-labeled goat anti-mouse immunoglobulin antibody were all purchased from Sigma-Aldrich (St. Louis, MO, USA). Gelatin was from Beijing Biodee Biotechnology Co., Ltd. (Beijing, China). Tetramethylbenzidine and HRP were from Aladdin Chemistry Co., Ltd. (Shanghai, China). All reagents used for cell fusion were purchased from Sunshine Biotechnology Co., Ltd. (Nanjing, China). Ovalbumin (OVA) and keyhole-limpet hemocyanin (KLH) were obtained from Solarbio Science & Technology, Co., Ltd. (Beijing, China). All other reagents and chemicals were supplied by the National Pharmaceutical Group Chemical Reagent Co., Ltd. (Shanghai, China).
Nitrocellulose (NC) high-flow plus membranes (Pura-bind RP) were obtained from Whatman-Xinhua Filter Paper Co., Ltd. (Hangzhou, China). The glass fibre membrane (CB-SB08) used for the sample pad, the polyvinylchloride (PVC) backing material and the absorbance pad (SX18), were supplied by Goldbio Tech Co., Ltd. (Shanghai, China). The conjugated coating antigens (PB-OVA) and specific monoclonal antibody (anti-PB mAb) were generated in our laboratory.
All buffer solutions were prepared with ultrapure water (Milli-Q Purification System, Millipore Co., Bedford, MA, USA). The strip-cutting instrument was a CM-4000 Guillotine Cutting System from Gene, Shanghai, China, and the dispensers used were Airjet Quanti 3000TM and Biojet Quanti 3000TM (XinqidianGene Technology Co., Ltd., Beijing, China).
Preparation and characterization of anti-PB monoclonal antibody (mAb)
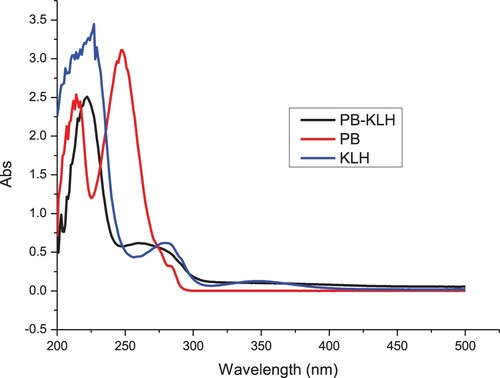
Penbutolol was conjugated to OVA (), or KLH () using the ester method (Suryoprabowo, Liu, Peng, Kuang, & Xu, Citation2014) (Ge, Suryoprabowo, Zheng, & Kuang, Citation2017). Briefly, a mixture of PB, carboxyl-reactive carbodiimide cross-linker (1-ethyl-3-[3-dimethylaminopropyl]carbodiimide hydrochloride) and N-hydroxysuccinimide was added to N,N-dimethyl formamide and incubated for 24 h (solution 1). KLH or OVA was mixed with 0.01 M phosphate-buffered saline (PBS) (solution 2). Solution 1 was slowly added to solution 2 and constantly stirred for 8 h at room temperature. The resulting conjugate was dialysed against 0.01 M PBS for 3 days and then with distilled water for 3 days. The protein PB conjugate was evaluated by its UV absorption.
Figure 2. The UV spectra characterisation for PB, PB-OVA, and OVA.
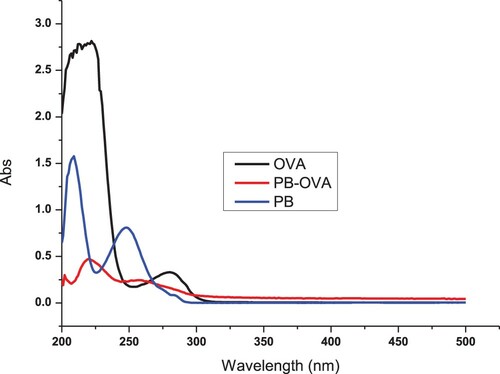
Figure 3. The UV spectra characterisation for PB, PB-KLH, and KLH.
Female BALB/c mice (6–8 weeks of age) were used to produce the anti-PB mAb after subcutaneous immunisation with PB-KLH. FCA was used in the first immunisation, and FIA in the subsequent immunizations. The mice were immunised every 3 weeks with 100 µg of antigen for the first immunisation and 50 µg for the remainder (2–5 times). Specific antibodies in blood samples from the mice were measured with enzyme-linked immunosorbent assay (ELISA). The mouse with the highest antibody titre was sacrificed and its splenocytes were extracted and fused with Sp 2/0 murine myeloma cells. The hybridomas were screened with and indirect ELISA using PB-OVA as the coating antigen. The selected hybridoma cells were expanded and injected into BALB/c mice to produce mAbs (Deng et al., Citation2012) (Mukunzi et al., Citation2017). The ascites were harvested and purified using the caprylic acid-ammonium sulfate precipitation method (Kong et al., Citation2017) (Isanga et al., Citation2017). The purified antibody solution was stored at −20°C until use.
Development of the lateral-flow immunochromatographic test strip device
Preparation of colloidal gold particles
All solutions were prepared with ultrapure water and passed through a 0.22 µm membrane filter. Chlorauric acid solution (0.1 g/L; 25 mL) was heated to boiling with constant stirring and mixed with sodium citrate tribasic dehydrate solution (1% w/v; 1.0 mL) with constant stirring for 30 min. When the colour of the solution turned to wine-red, it was cooled to room temperature, and stored at 4°C. Analysis using transmission electron microscopy revealed that the gold nanoparticles (GNPs) had a nearly uniform particle size of 15 nm.
Preparation of colloidal gold-Labeled mAb
The half-maximal inhibitory concentration (IC50) of the anti-PB mAb (5B7) was 0.3 ng/mL. The Colloidal GNP solution (10 mL) was adjusted to pH 7 with 0.1 M K2CO3, and the mAb (0.50 mL) was added dropwise to the solution. After 35 min, 10% (w/v) bovine serum albumin (BSA; 1 mL) was added. The mixture was stirred for 2 h and then centrifuged at 8000 rpm for 45 min to remove any GNP aggregates. The solution separated into two layers and the lower layer (red gold-labeled mAb) was collected and washed with 0.02 M phosphate buffer containing 5% sucrose, 1% BSA, and 0.5% polyethylene glycol (PEG) 6000 (at pH 7.4). The conjugation product was reconstituted to 1 mL with gold-labeled resuspension buffer (0.02 M PBS, 5% sucrose, 2% sorbitol, 1% mannitol, 0.1% PEG, 0.1% Tween, and 0.04% NaN3) and stored at 4°C.
Preparation of nitrocellulose capture membranes
The coating antigen (PB-OVA) and the goat anti-mouse IgG antibody were used as the capture reagents in the test line on the control strip, respectively. The coating antigen and goat anti-mouse IgG antibody were sprayed onto the NC membrane at 1 µL/cm using a dispenser, to form the test line and control lines, respectively. The capture and control reagents were sprayed onto the glass fibre membrane to prepare the conjugate pad, which was dried at 37°C for 2 h. The NC membrane containing the capture reagents was pasted onto the centre of the plastic backing plate (polyvinylchloride (PVC)) and the conjugate pad, sample pad, and absorbent pad were laminated and pasted sequentially onto the plate. The plate was then cut into strips (2.8 mm-wide) with a strip cutter.
Test procedure and principle
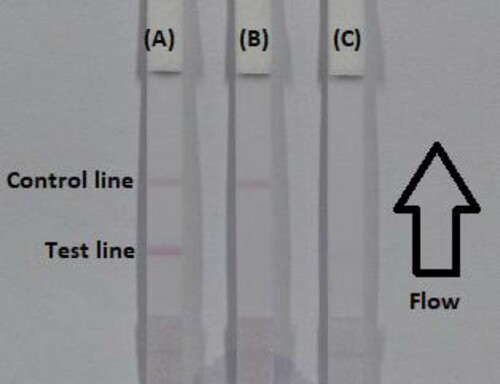
The gold-labeled mAb (50 µL) was mixed with 150 µL of sample solution, allowed to react for 5 min, and then applied to the sample pad. The solution migrated along the absorbent pad and the test result was obtained within 5 min. Penbutolol, if present in the sample, competed with the PB-OVA conjugate embedded in the test line, for the finite amount of anti-PB mAb added to the sample. When a detectable amount of PB was present in the sample, the free PB bound all of the gold-labeled mAb, preventing the mAb binding to the PB-OVA in the test line. Therefore, a larger amount of PB present in the sample, generated a weaker colour in the test line. If no PB was present, the limited amount of colloidal-gold-labeled mAb would be trapped by the immobilised PB-OVA conjugate, and a clearly visible red test line would appear.
When the sample flow reached the control line, which contained the goat anti-mouse IgG antibody, it produced a detectable reaction. Therefore, the control line always appear in a successful test, whereas the test line will only appear when the sample is negative (A). The appearance of the control line alone is a positive result (B), whereas if no lines appear, the test procedure was performed incorrectly, or the strip was invalid, indicating that the test should be repeated with a new strip (C).
Figure 4. The illustration of strip results (A) the sample is negative; (B) positive result if the C line appears alone; (C) invalid result if the control and test line doesn't appears. C = control line. T = test line.
Determination of performance
Sensitivity of the test strip
The sensitivity of the test strip was determined by assaying PB containing samples against a PB standard curve. The PB standards were diluted to the following concentrations, 0, 0.1, 0.25, 0.5, 1, and 2.5 ng/mL in 0.01 M PBS (pH7.4) and the detection limits was determined. The sample solution (150 µL) was mixed with gold-labeled mAb (50 µL), allowed to react for 5 min, and then added to the sample pad. After a further 5 min, the colour intensities on the different strips were recorded with a test strip reader. The lowest detection limit (LDL) using the naked eye, was defined as the amount of PB that produced a visibly different colour reaction between the positive sample and the negative samples on the strip. Six replicate samples for each concentration were analyzed on the same day.
Detection of PB in pig urine
The method for detecting PB in pig urine was developed using spiked samples. The spiked samples were prepared by adding PB standard concentrations to pig urine at final concentrations of 0.25, 0.5, 1, 2.5, and 5 ng/mL. The PB standard solution was prepared with, 0.01 M PBS (pH 7.4) at a concentration of 10 µg/mL. An unspiked sample (blank) was used as the control. Six replicates of each concentration were analyzed using the test strips.
Results and discussion
Optimisation of the test strip
The sensitivity of LFIA testing is mainly affected by the concentration of the coating antigen and the colloidal-gold-labeled mAb. The coating antigen was synthesised in our laboratory and its concentration optimised. Strips with different coating antigen concentrations (0.5 or 1 mg/mL) on the test line were evaluated with 0.01 M PBS (pH 7.4) containing either 0 or 5 ng/mL PB. The coating antigen concentration resulted in colour development in both the control and test lines. There were significant differences in the colour intensity when 0.5 or 1 mg/mL coating antigen was used (). Specifically, 1 mg/mL coating antigen produced a deeper colour intensity than 0.5 mg/mL coating antigen. No colour was detected in the test line when a concentration of 1 mg/mL coating antigen and a concentration of 5 ng/mL PB standard were used. Therefore, 1 mg/mL coating antigen was selected for the preparation of the test line on the LFIC strip.
Figure 5. Optimisation of the immunochromatographic strip. Concentration of coating antigen (A) 0.5 mg/mL; (B) 1 mg/mL. The amount of the mAb that add in GNP: (a) 8 µg/mL; (b) 10 µg/mL. The standard concentration: (1) 0 ng/mL; (2) 5 ng/mL.
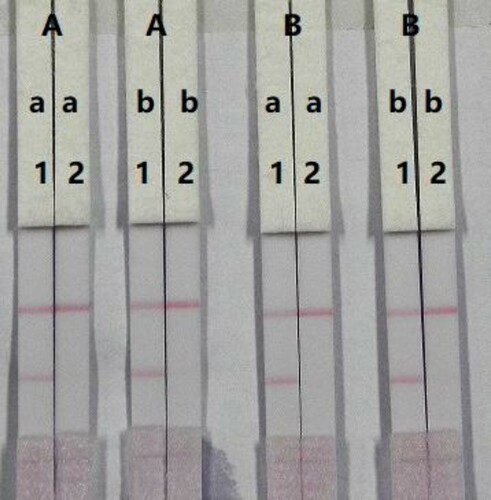
The concentration of mAb added to the gold nanoparticles also affects the sensitivity of the LFIA strip. A reaction system (50 µL) containing different concentrations of mAb (8 or 10 µg/L) was allowed to react with PB-negative (0 ng/mL) and PB-positive (5 ng/mL) samples. There was a significant difference in the colour intensity produced by 8 and 10 µg/mL mAb. We found that the optimum concentration of mAb should be combined with 10µg/mL colloidal gold as it produced the strongest colour intensities on both lines when the negative sample was tested and allowed more sensitive detection of the positive sample. Therefore, the optimal system for our immunochromatographic test strip included 1 mg/mL coating antigen and 10µg/mL gold nanoparticle conjugated mAb.
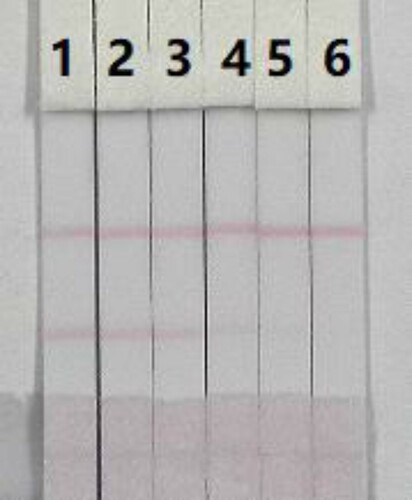
The assay sensitivity was determined using a dilution series of the PB standards. The LDL with the naked eye, was set as the amount of PB that could produce a clearly visible change in the colour intensity of the test strip, when compared with the negative control sample. As shown in , the signal colour on the test line changed from strong to weak as the concentration of PB decreased and disappeared completely at 2.5 ng/mL PB in 0.01 M PBS (pH 7.4). The assay was determined by testing PB at concentrations of 0, 0.1, 0.25, 0.5, 1, and 2.5 ng/mL in 0.01 M PBS (pH 7.4). Strong colour was observed on the test line when samples were spiked with concentration of 0–0.25 ng/mL of PB. However, the colour disappeared completely when the concentration of PB reached 2.5 ng/mL.
Figure 6. Colloidal gold immunochromatographic for PB in 0.01 M PBS (pH 7.4). PB concentration: 1= 0 ng/mL; 2= 0.1 ng/mL; 3= 0.25 ng/mL; 4= 0.5 ng/mL; 5= 1 ng/mL; and 6= 2.5 ng/mL.
Detection of PB in pig urine
To function as the reaction matrix in a LFIA system, a material must be hydrophilic and have good flow characteristics. NC is hydrophobic, but can be made hydrophilic by the addition of rewetting agents during the membrane production process. These rewetting agents are surfactants and the type, amount used, and method of addition method differ between manufacturers and between brands from the same manufacturer. These factors can affect the performance of the assay.
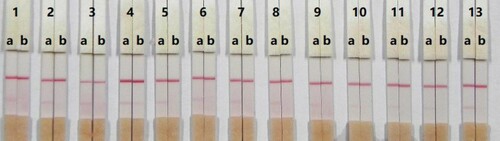
In this study, a suspension buffer (0.02 M PBS, 5% sucrose, 2% sorbitol, 1% mannitol, 0.1% PEG, 0.1% Tween, and 0.04% NaN3) was added to 12 different rewetting agents; polyvinylpyrolidon, PEG, BSA, casein, sucrose, trehalose, sorbitol, mannitol, Tween-20, Brij-35, Triton X-100, and Rhodasurf® ON-870 (an ethoxylated oleyl alcohol). Solutions containing the surfactant Rhodasurf® ON-870 produced an adequate and stable colour reaction ().
Figure 7. Result of using 13 kinds of reagent. 1 = suspension buffer, 2 = PVP, 3 = PEG, 4 = BSA, 5 = Casein, 6 = Sucrose, 7 = Trehalose, 8 = Sorbitol, 9 = Mannitol, 10 = tween-20, 11 = Brij-35, 12 = Triton X-100, and 13 = On-870. a = 0 ng/mL; b= 2.5 ng/mL.
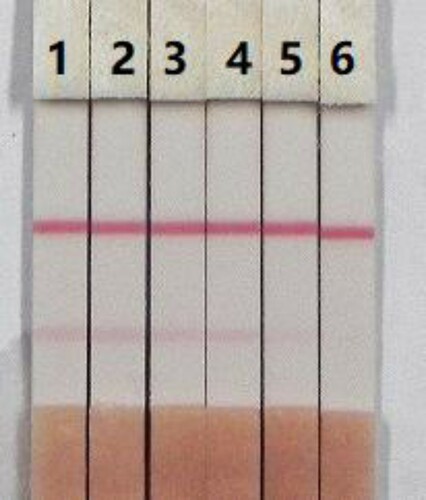
We determined the effects of the matrix in pig urine on the detection of PB with our LFIA strip for PB. The advantages of the LFIA strip are that it is rapid and easy to use. The pig urine was spiked with 10 µg/mL PB standard, prepared in 0.01 M PBS (pH 7.4) at final concentrations of PB in pig urine of 0.25, 0.5, 1, 2.5, and 5 ng/mL. Under the optimised conditions (), the colour intensity decreased as the PB concentration increased with the signal colour changing from strong to weak, and the signal disappeared completely at 5 ng/mL.
Figure 8. Colloidal gold immunochromatographic for PB in pig urine. PB concentration: 1= 0 ng/mL; 2= 0.25 ng/mL; 3= 0.5 ng/mL; 4= 1 ng/mL; 5= 2.5 ng/mL; and 6= 5 ng/mL.
Conclusions
We have produced a mAb directed against PB with a highly sensitive immunogen (PB-OVA) and used it to develop a lateral-flow immunochromatographic assay. Under optimised conditions, the cut-off detection limit the immunochromatographic strip for PB is as low as 2.5 ng/mL in 0.01 M PBS (pH 7.4) and 5 ng/mL in pig urine. The results of the assay can be evaluated with the naked eye in 5–10 min, allowing the high-throughput testing of PB in pig urine.
Acknowledgements
This work is financially supported the grants from Natural Science Foundation of Jiangsu Province and MOF (||BK20150138, 2016YFD0401101, ||BK20150145, CMB21S1614, CLE02N1515, 201513006), and Taishan Industry Leading Talent Special Funds.
Disclosure Statement
No potential conflict of interest was reported by the authors.
Additional information
Funding
Related Research Data
References
- Alexandre, G. P., Wandermuren, M. N., Peron, A., Tavares, V. F., Ramalho Padeiro, D. A., Sakiara, K. A., … I, M. (2017). Determination of four nadolol stereoisomers in capsules by high-performance liquid chromatography and circular dichroism. Journal of Aoac International, 100(4), 1016–1022. doi: https://doi.org/10.5740/jaoacint.16-0292
- Bernard, N., Cuisinaud, G., & Sassard, J. (1982). Determination of penbutolol and its hydroxylated metabolite in biological fluids by reversed-phase high-performance liquid chromatography. Journal of Chromatography B: Biomedical Sciences and Applications, 228, 355–361. doi: https://doi.org/10.1016/S0378-4347(00)80454-5
- del Rosario Brunetto, M., Clavijo, S., Delgado, Y., Orozco, W., Gallignani, M., Ayala, C., & Cerda, V. (2015). Development of a MSFIA sample treatment system as front end of GC-MS for atenolol and propranolol determination in human plasma. Talanta, 132, 15–22. doi: https://doi.org/10.1016/j.talanta.2014.08.056
- Deng, X., Liu, L., Ma, W., Xu, C., Wang, L., & Kuang, H. (2012). Development and validation of a sandwich ELISA for quantification of peanut agglutinin (PNA) in foods. Food and Agricultural Immunology, 23(3), 265–272. doi: https://doi.org/10.1080/09540105.2011.617358
- de Oliveira, L. G., Barreto, F., Hoff, R., Rubensam, G., Scherer Kurz, M. H., Galle, G., & Gocnalves, F. F. (2017). Validation of a method for sedatives and beta-blockers determination in swine, bovine and equine kidney using liquid chromatography coupled with tandem mass spectrometry. Food Additives and Contaminants Part a-Chemistry Analysis Control Exposure & Risk Assessment, 34(1), 32–39.
- Dzema, D., Kartsova, L., Kapizova, D., Tripp, S., Polikarpov, N., Appelhans, D., & Voit, B. (2016). Oligosaccharide-Crowned hyperbranched poly(ethyleneimine) as an additive to thin-layer chromatography systems for the separation of vitamins, amino acids and beta-blocker enantiomers. Jpc-Journal of Planar Chromatography-Modern Tlc, 29(2), 108–112. doi: https://doi.org/10.1556/1006.2016.29.2.3
- Ge, W., Suryoprabowo, S., Zheng, Q., & Kuang, H. (2017). Development of an immunochromatographic test strip for the detection of papaverine in pure ginger powder. Food and Agricultural Immunology, 28(6), 1304–1314.
- Hemmati, M., Asghari, A., Bazregar, M., & Rajabi, M. (2016). Rapid determination of some beta-blockers in complicated matrices by tandem dispersive liquid-liquid microextraction followed by high performance liquid chromatography. Analytical and Bioanalytical Chemistry, 408(28), 8163–8176. doi: https://doi.org/10.1007/s00216-016-9922-0
- Hu, L.-M., Luo, K., Xia, J., Xu, G.-M., Wu, C.-H., Han, J.-J., … Lai, W.-H. (2017). Advantages of time-resolved fluorescent nanobeads compared with fluorescent submicrospheres, quantum dots, and colloidal gold as label in lateral flow assays for detection of ractopamine. Biosensors & Bioelectronics, 91, 95–103. doi: https://doi.org/10.1016/j.bios.2016.12.030
- Isanga, J., Mukunzi, D., Chen, Y., Suryoprabowo, S., Liu, L., Kuang, H., & Xu, C. (2017). Development of a monoclonal antibody assay and a lateral flow strip test for the detection of paromomycin residues in food matrices. Food and Agricultural Immunology, 28(3), 355–373. doi: https://doi.org/10.1080/09540105.2016.1272551
- Jiang, W., Zeng, L., Liu, L., Song, S., & Kuang, H. (2018). Immunochromatographic strip for rapid detection of phenylethanolamine A. Food and Agricultural Immunology, 29(1), 182–192. doi: https://doi.org/10.1080/09540105.2017.1364709
- Khaemba, G. W., Tochi, B. N., Mukunzi, D., Joel, I., Guo, L., Suryobrobowo, S., … Xu, C. (2016). Development of monoclonal antibody and lateral test strip for sensitive detection of clenbuterol and related beta(2)-agonists in urine samples. Food and Agricultural Immunology, 27(1), 111–127. doi: https://doi.org/10.1080/09540105.2015.1079598
- Kong, D., Xie, Z., Liu, L., Song, S., Kuang, H., Cui, G., & Xu, C. (2017). Development of indirect competitive ELISA and lateral-flow immunochromatographic assay strip for the detection of sterigmatocystin in cereal products. Food and Agricultural Immunology, 28(2), 260–273. doi: https://doi.org/10.1080/09540105.2016.1263985
- Lei, X., Xu, L., Song, S., Liu, L., & Kuang, H. (2018). Development of an ultrasensitive ic-ELISA and immunochromatographic strip assay for the simultaneous detection of florfenicol and thiamphenicol in eggs. Food and Agricultural Immunology, 29(1), 254–266. doi: https://doi.org/10.1080/09540105.2017.1371114
- Lin, L., Jiang, W., Xu, L., Liu, L., Song, S., & Kuang, H. (2018). Development of IC-ELISA and immunochromatographic strip assay for the detection of flunixin meglumine in milk. Food and Agricultural Immunology, 29(1), 193–203. doi: https://doi.org/10.1080/09540105.2017.1364710
- Liu, A., Lin, J., Dai, M., Ma, B., Wu, Y., Fang, J., & Zhang, M. (2016). Development of a monoclonal antibody-based immunochromatographic assay detecting ractopamine residues in swine urine. Food Analytical Methods, 9(7), 2016–2025. doi: https://doi.org/10.1007/s12161-015-0382-5
- Liu, L., Suryoprabowo, S., Zheng, Q., Song, S., & Kuang, H. (2017). Rapid detection of aldicarb in cucumber with an immunochromatographic test strip. Food and Agricultural Immunology, 28(3), 427–438. doi: https://doi.org/10.1080/09540105.2017.1293015
- Mennickent, S., Mario Vega, M., Mario Vega, H., De Diego, M., & Fierro, R. (2012). Quantitative determination of propranolol in human serum by high-performance thin-layer chromatography. Jpc-Journal of Planar Chromatography-Modern Tlc, 25(1), 54–59. doi: https://doi.org/10.1556/JPC.25.2012.1.9
- Mukunzi, D., Isanga, J., Suryoprabowo, S., Liu, L., & Kuang, H. (2017). Rapid and sensitive immunoassays for the detection of lomefloxacin and related drug residues in bovine milk samples. Food and Agricultural Immunology, 28(4), 599–611. doi: https://doi.org/10.1080/09540105.2017.1306495
- Paik, M.-J., Lee, J., & Kim, K.-R. (2007). Simultaneous screening analysis of multiple beta-blockers in urine by gas chromatography-mass spectrometry in selected ion monitoring mode. Analytica Chimica Acta, 601(2), 230–233. doi: https://doi.org/10.1016/j.aca.2007.08.036
- Rodina, T. A., Mel'nikov, E. S., Dmitriev, A. I., Belkov, S. A., Sokolov, A. V., Arkhipov, V. V., & Prokof'ev, A. B. (2018). Simultaneous determination of metoprolol and bisoprolol in human serum by HPLC-MS/MS for clinical drug monitoring. Pharmaceutical Chemistry Journal, 51(12), 1111–1118. doi: https://doi.org/10.1007/s11094-018-1750-4
- Shah, J. V., Patel, D. P., Shah, P. A., Sanyal, M., & Shrivastav, P. S. (2016). Simultaneous quantification of atenolol and chlorthalidone in human plasma by ultra-performance liquid chromatography-tandem mass spectrometry. Biomedical Chromatography, 30(2), 208–216. doi: https://doi.org/10.1002/bmc.3537
- Song, S., Zou, S., Zhu, J., Liu, L., & Kuang, H. (2018). Immunochromatographic paper sensor for ultrasensitive colorimetric detection of cadmium. Food and Agricultural Immunology, 29(1), 3–13. doi: https://doi.org/10.1080/09540105.2017.1354358
- Sun, S., Wang, Y., Liu, X., Fu, R., & Yang, L. (2018). Rapid and sensitive tapered-capillary microextraction combined to on-line sample stacking-capillary electrophoresis for extraction and quantification of two beta-blockers in human urine. Talanta, 180, 90–97. doi: https://doi.org/10.1016/j.talanta.2017.12.035
- Suryoprabowo, S., Liu, L. Q., Peng, J., Kuang, H., & Xu, C. L. (2014). Development of a broad specific monoclonal antibody for fluoroquinolone analysis. Food Analytical Methods, 7(10), 2163–2168. doi: https://doi.org/10.1007/s12161-014-9863-1
- Suryoprabowo, S., Liu, L. Q., Peng, J., Kuang, H., & Xu, C. L. (2015). Antibody for the development of specific immunoassays to detect nadifloxacin in chicken muscles. Food and Agricultural Immunology, 26(3), 317–324. doi: https://doi.org/10.1080/09540105.2014.914469
- Yilmaz, B., & Arslan, S. (2011). Determination of atenolol in human urine by Gas chromatography-mass spectrometry method. Journal of Chromatographic Science, 49(5), 365–369. doi: https://doi.org/10.1093/chromsci/49.5.365
- Zeeb, M., Farahani, H., & Papan, M. K. (2016). Determination of atenolol in human plasma using ionic-liquid-based ultrasound-assisted in situ solvent formation microextraction followed by high-performance liquid chromatography. Journal of Separation Science, 39(11), 2138–2145. doi: https://doi.org/10.1002/jssc.201501365
- Zhang, M.-Z., Wang, M.-Z., Chen, Z.-L., Fang, J.-H., Fang, M.-M., Liu, J., & Yu, X.-P. (2009). Development of a colloidal gold-based lateral-flow immunoassay for the rapid simultaneous detection of clenbuterol and ractopamine in swine urine. Analytical and Bioanalytical Chemistry, 395(8), 2591–2599. doi: https://doi.org/10.1007/s00216-009-3181-2