
ABSTRACT
A novel lateral flow assay (LFA) was developed by introducing Eu (III)-doped polystyrene nanoparticles (EuNPs) for rapid and ultra-sensitive detection of sulfamethazine (SM2) in raw milk. The limit of detection and linear range of the proposed method were 0.0045 and 0.05–10 ng/mL, respectively. The recovery of LFA for the detection of SM2 in raw milk was 96.1–108.2%. The proposed LFA provides a rapid and convenient strategy for fast and ultra-sensitive screening of SM2 in raw milk. EuNP-LFA may be a remarkable method for the detection of other targets at low concentrations to ensure food safety.
GRAPHICAL ABSTRACT
1. Introduction
Sulfamethazine (SM2) is widely used in veterinary medicine for treatment of infectious diseases. The abuse of using SM2 in veterinary practice may lead to the presence of SM2 residues in milk (Franek, Kolar, Deng, & Crooks, Citation1999; Galarini et al., Citation2014; Karageorgou, Manousi, Samanidou, Kabir, & Furton, Citation2016; Wang et al., Citation2012). Excessive SM2 residue is harmful to consumers because of its carcinogenic potential and risk of antibiotic resistance (Barani & Fallah, Citation2015; Marshall & Levy, Citation2011). To protect consumers from the risk, China (Ministry of Agriculture), Canada (Food and Drug Regulation), and the European Union (EU Regulation) established the maximum residue limits of total sulfonamides at 100 µg/kg in milk. The Chinese Government have especially ruled out the maximum residue limits of SM2 at 25 µg/kg in milk.
SM2 was traditionally detected by high-performance liquid chromatography (Xu et al., Citation2010) and liquid chromatography–mass spectrometry (Shao et al., Citation2005). Although these methods are highly accurate, they are time consuming, costly, and generally unsuitable for use on site. Lateral flow assay (LFA), which is based on specific recognition of antigens and antibodies, is a rapid, simple, specific, and inexpensive technique (Hao et al., Citation2018; Peng, Pei, Zheng, Wang, & Wang, Citation2017; Sajid, Kawde, & Daud, Citation2015; Wang et al., Citation2018; Zhang et al., Citation2018). However, the traditional LFA based on colloidal gold as the label exhibits low sensitivity (Shim, Kim, Kim, & Chung, Citation2013). Hence, improving the sensitivity of LFA for SM2 detection in actual samples is important and necessary.
Eu (III)-doped polystyrene nanoparticles exhibit a large stoke shift, narrow emission bands, and high fluorescence intensity (Hu, Luo, Xia, Xu, & Wu, Citation2017; NãReoja, Rosenholm, Lamminmã, & HãNninen, & E, Citation2017). Using Eu (III)-doped polystyrene nanoparticle (EuNP) as the label can considerably enhance the sensitivity of LFA (Luo, Hu, Guo, Wu, & Wu, Citation2017; Sun, Xie, Peng, Wang, & Xie, Citation2017).
Heterologous competitive strategy is a prevalent method for changing the recognition between antibody and antigen to improve the sensitivity of immunoassays. Scholars have focused on preparing heterologous coating antigen (HCA) to enhance the sensitivity of immunoassays (Peng, Liu, Kuang, Cui, & Xu, Citation2016a; Wang, Zhang, Ni, Zhang, & Shen, Citation2014).
In this study, a novel LFA was established based on EuNP as the label and HCA as the detective antigen (EuNP-HCA-LFA) for the sensitive detection of SM2 in raw milk. EuNP-HCA-LFA may be a remarkable method for the sensitive detection of other targets at low concentrations to ensure food safety.
2. Materials and methods
2.1. Materials and reagents
SM2, sulfameter, sulfasoxazole, sulfamethoxypyridazine, sulfachloropyridazine, sulfamethoxazole, sulfamonomethoxine, sulfadimethoxine, sulfathiazole, and sulfamerazine were obtained from J&K Scientific Ltd (Shanghai, China), and the stock solution of SM2 was prepared in methanol (2 mg/mL) for further use. Bovine serum albumin (BSA), 1-(3-dimethylaminopropyl)-3-ethyl-carbodiimide (EDC), borate for preparation of borate buffer (BB; 0.05 M, pH 6.0), and phosphate for preparation of phosphate-buffered saline (PBS; 0.01 M, pH 7.4) were purchased from Sigma-Aldrich (St. Louis, MO, USA). EuNPs (excitation wavelength = 365 nm, emission wavelength = 615 nm) was obtained from Microdetection Bio-tech Co., Ltd. (Nanjing, China). Raw milk was provided by Jiangxi Sunshine Dairy Co., Ltd. (Jiangxi, China). Anti-SM2 monoclonal antibody (mAb), prepared using SM2-DZ-BSA as immunogen, was provided by Wuxi Zodoboer Biotech. Co., Ltd. (Wuxi, China). In addition, two detective antigens, namely, SM2-DZ-BSA and SM2-GA-BSA, were prepared in our laboratory (the UV–vis spectra of the two antigens are shown in Supporting Information Figure S1). SM2-DZ-BSA and SM2-GA-BSA were prepared by coupling SM2 to BSA through diazotization (Li et al., Citation2009) and glutaraldehyde method (Peng, Liu, Kuang, Cui, & Xu, Citation2016b), respectively. Goat anti-mouse IgG was purchased from Meridian Life Science Inc. (Memphis, TN, USA). All other chemicals and reagents were of analytical grade and acquired from Sinopharm Chemical Reagent Co., Ltd. (Shanghai, China).
A portable strip reader was obtained from Fenghang Scientific Instrument Co., Ltd. (Zhejiang, China) and used for the LFA test strip (excitation wavelength= 365 nm, emission wavelength = 610 nm). Nitrocellulose (NC) membrane, sample pad, conjugate pad, and absorbent pad were purchased from Millipore (Bedford, MA, USA). Bio-layer interferometry (BLI; ForteBio, Menlo Park, CA, USA) and anti-mouse Fc biosensor (AMC sensor) were provided by Pall ForteBio LLC (CAE, USA).
2.2. Preparation of labelled mAb
EuNP–mAb was prepared using a previously reported method with some modifications (Luo et al., Citation2017). EuNP (50 µg) was added to 0.5 mL of 0.05 M BB (pH 7.5) containing 1.75 µg of EDC to activate the carboxyl of the surface of materials for 15 min. Anti-SM2 mAb (0.625, 1.25, 2.50, 5.0, and 7.5 µg) was added to the mixture to form EuNP–mAb complexes. The remaining active sites of the complex solution were blocked with 50 µL of 0.05 M BB containing 10% (w/v) BSA. Finally, the mixtures were centrifuged at 12,000 rpm at 4 °C for 20 min. The precipitates were dissolved in 0.1 mL of 0.05 M BB (pH 7.5) containing 0.2% (w/v) BSA and 0.5% (v/v) Tween-20. The concentrations of mAb coupled with EuNP in the final solution were 6.25, 12.5, 25.0, 50.0, and 75 µg/mL.
2.3. Characterization of the EuNP and EuNP–mAb complexes
The morphology and sizes of the EuNP were characterized using a transmission electron microscope (TEM, JEOLJEM 2100, Tokyo, Japan). The zeta potential, size intensity, and polydispersity index (PDI) of the EuNP and EuNP–mAb complexes were analysed (Xing et al., Citation2018) by a particle size analyzer (Nano-ZS, Malvern Instruments Ltd., Worcestershire, UK).
2.4. Preparation of LFA test strip
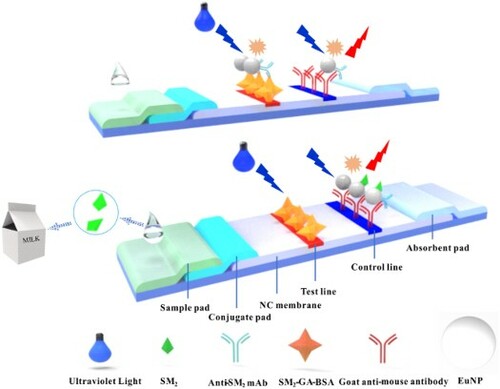
The detective antigens, namely, SM2-DZ-BSA and SM2-GA-BSA (1.0 mg/mL), and goat anti-mouse IgG (0.5 mg/mL) were sprayed on the NC membrane as the test and control lines, respectively. These membranes were dried at 37 °C overnight. The sample pad, conjugate pad, NC membrane, and absorbent pad were assembled as LFA test strip (Scheme 1).
Scheme 1. Schematic of LFA based on competitive format immunoassay principle to quantitatively analyse SM2. When the sample was free of SM2 (control), the EuNP–mAb complexes migrated along the NC membrane under the action of capillary force and were available to bind to SM2-DZ-BSA or SM2-GA-BSA immobilized on the test line. The EuNP–mAb complexes would be captured by the antigen when the sample was presented SM2 (positive). The fluorescence intensity of the test line changed from strong to weak as the concentration of SM2 increased. The EuNP–mAb complexes should be captured by goat anti-mouse IgG immobilized on the control line regardless of the presence of the target SM2.
2.5. Assays with LFA test strip
SM2 stock solution was diluted in 0.01 M PBS (pH 7.4). As shown in Scheme 1, the control or positive sample solution (100 µL) was mixed with the EuNP–mAb complexes (4 µL) in an ELISA well for 5 min and added to the LFA test strip. After 30 min of reaction, the fluorescence intensity of the test line (FIT) was recorded. All experiments were performed in triplicate.
2.6. Measurements of the affinities of mAb for the two detective antigens
The procedure was performed in accordance with a previous work (Li, Duan, Xu, Huang, & Xiong, Citation2016) with some modifications. The AMC sensor was first pre-wetted and equilibrated with PBS buffer (0.01m M, pH 7.4). The antibody was non-covalently loaded on the surface of the AMC sensor and incubated for an addition time of 600 s off line. After a 300 s equilibration step, the association assay of antibody to coating antigens was conducted for 180 s. Dissociation assays were carried out with PBS for 120 s. Finally, the association rate (ka), dissociation rate (kd), and affinity constant (KD) of mAb for SM2-DZ-BSA and SM2-GA-BSA were determined by loading the experimental data into Octet Data Analysis software.
2.7. Establishment of standard calibration curve in PBS
SM2 (0, 0.01, 0.05, 0.1, 0.5, 1.0, 5.0, 10.0, 20 ng/mL) was added to PBS. A standard curve was established using the logarithm of the concentration of SM2 and T/T0, where T indicates FIT when SM2 is present in samples, and T0 represents FIT when the solution only contains PBS. The limit of detection (LOD) (Adrian et al., Citation2009) is defined as IC90.
2.8. Specificity analysis
The specificity of the proposed LFA was assessed by testing 10 sulfonamide drugs. All experiments were repeated in triplicate (Chen et al., Citation2017).
2.9. Detection of SM2 in raw milk
2.9.1. Establishment of standard calibration curve in raw milk
SM2 (0, 0.01, 0.05, 0.1, 0.5, 1.0, 5.0, 10.0, and 20 ng/mL) was added to raw milk. A standard curve was established using the logarithm of the concentration of SM2 and T/T0, where T refers to FIT when spiked-SM2 is present in raw milk, whereas T0 represents FIT when raw milk possesses no spiked SM2.
2.9.2. Recovery of SM2 in raw milk on the EuNP-HCA-LFA system
SM2 (0.05, 0.5, and 5 ng/mL) was added to raw milk. The recovery and coefficient of variation (CV) of SM2 in raw milk were quantitatively analysed on the LFA system.
3. Results and discussion
3.1. Characterization of EuNP and EuNP–mAb complexes
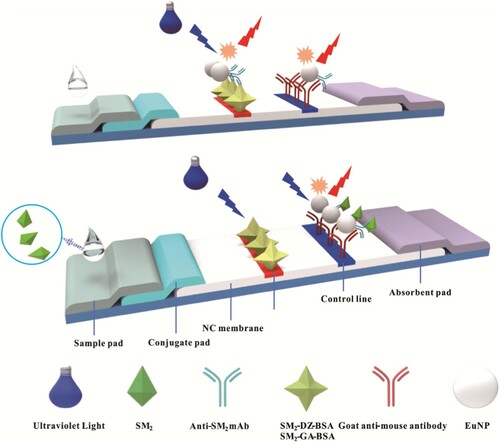
The morphology and size of EuNP were characterized by TEM ((A)). EuNP exhibited homogenous size and an average diameter of 193 nm. The sizes ((B)) of EuNP and EuNP–mAb complex were 220 and 255 nm, respectively, indicating that mAb was successfully coupled on the EuNP surface. In (C), the PDI of EuNP was 0.002. After the combination of EuNP with mAb, the PDI slightly changed to 0.025 (6.25 μg/mL), 0.039 (12.5 μg/mL), 0.033 (25 μg/mL), 0.01 (50 μg/mL), and 0.012 (75 μg/mL). This finding revealed the good dispersibility of EuNP–mAb and the stability for the application of EuNP–mAb complexes in EuNP-LFAs. The zeta potential ((D)) of EuNP increased from −50 mV to >–36 mV after coupling with mAb. Hence, mAb combined with EuNP.
Figure 1. Characterization of EuNP and EuNP–mAb complexes. (A) TEM image of EuNP. (B) Size characterization of EuNP and EuNP–mAb complexes by dynamic light scattering. (C) PDI of EuNP and EuNP–mAb complexes. (D) Zeta potential of EuNP before and after coupling with mAb.
3.2. Optimization of the concentration of mAb coupled with EuNP
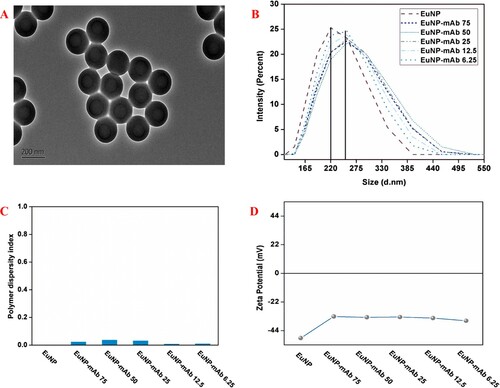
When SM2-GA-BSA was used as the detective antigen, the concentration of mAb (6.25, 12.5, 25.0, 50.0, and 75.0 µg/mL) coupled with EuNP was optimized. PBS solution without SM2 (control sample) and positive sample spiked with SM2 in PBS solution (0.1 ng/mL) were prepared. The signal intensity and inhibition rate were determined by analysing FIT0 and (1−T/T0), respectively. High signal value and inhibition rate are the reference for selecting the optimized concentration of mAb coupled with EuNP (Kong, Liu, Song, Suryoprabowo, & Li, Citation2016). As shown in , in solutions with mAb coupled with EuNP at 6.25, 12.5, 25.0, 50.0, and 75.0 µg/mL, the corresponding signal intensities were 87.5, 33.0, 64.0, 708.0, and 1222.5, respectively, and corresponding (1–T/T0) were 0.97, 0.98, 0.98, 0.74, and 0.43, respectively. The FI was too low and had no increasing trend when the concentration of EuNP–mAb were 6.25, 12.5, and 25.0 µg/mL. When the concentration of EuNP–mAb were 50.0 and 75.0 µg/mL, FI increased rapidly. However, the higher amount of EuNP–mAb had a lower sensitivity of the LFA because of competitive format. Hence, 50 µg/mL was selected as the optimized concentration of mAb coupled with EuNP, When the SM2-DZ-BSA was used as detective antigen, the optimized concentration of mAb coupled with EuNP was 25 µg/mL (Supporting Information Figure S2).
Figure 2. Optimization of the concentration of mAb coupled with EuNP with SM2-GA-BSA as detective antigen.
3.3. Affinities of mAb to two detective antigens
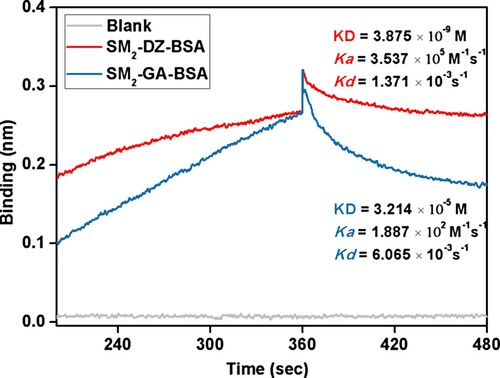
BLI is an optical technique that allows for the real-time monitoring of the interactions between mAb and antigens without the requirements for enzymatic, fluorescent, or radioactive labels. In the measuring process, the interaction of mAb with an immobilized ligand on a biosensor surface forms a molecular layer, and the data obtaining is the basis of the changes in the thickness of the molecular layer which is related to the concentrations and the characters of some different antigens. In this study, the affinity properties between mAb and SM2-DZ-BSA and SM2-GA-BSA were determined using a BLItz instrument under the same conditions. As shown in , the KD values of mAb for SM2-DZ-BSA and SM2-GA-BSA were 3.875×10⁻⁹ and 3.214×10⁻⁵ M, respectively. The results revealed that the affinity of mAb to HCA (SM2-GA-BSA) was lower than that to the homologous antigen (SM2-DZ-BSA).
Figure 3. Affinity properties of mAb to SM2-DZ-BSA and SM2-GA-BSA as measured by a BLItz instrument.
3.4. Standard curve of the two LFAs in SM2-spiked PBS
The standard curves of the two LFAs were constructed by plotting the T/T0 against the logarithm of the concentrations of SM2. (A, B) indicated that the regression equations of the two LFAs with SM2-GA-BSA and SM2-DZ-BSA as detective antigens were y= –0.2939 log (x) + 0.2084 (R2 =0.9808) and y= –0.3757 log (x) + 0.2730 (R2 =0.9827), where y is the T/T0 and x is the concentration of SM2, respectively. A comparison of the IC50, LOD (Adrian et al., Citation2009), and linear ranges of the two LFAs in PBS is presented in . SM2-GA-BSA as HCA could clearly enhance the sensitivity of LFA. Our result was consistent with that of Goodrow (Goodrow, Harrison, & Hammock, Citation1990), who found that the sensitivity of immunoassays is enhanced when HCA is used as the detective antigen because the affinity of mAb to HCA is less than that to a homologous antigen.
Figure 4. Standard calibration curve of the two LFAs in PBS were obtained by determining the T/T0 against the logarithm of the concentrations of SM2 under SM2-GA-BSA (A) and SM2-DZ-BSA (B) as detective antigens.
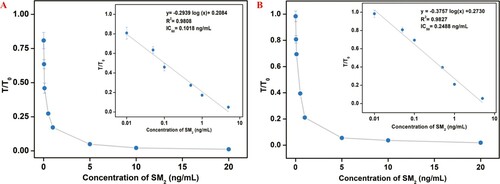
Table 1. Sensitivity and linear range of the two EuNP-LFAs in PBS.
3.5. Specificity of the EuNP-HCA-LFA
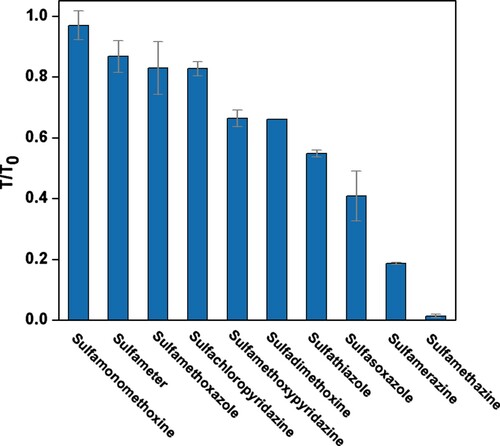
The specificity of the EuNP-HCA-LFA was assessed by testing the 10 sulfonamide drugs (10 ng/mL) with SM2-GA-BSA as the detective antigen. As shown in , the T/T0 value of SM2-spiked PBS sample was 0.01 and much lower than that with the nine other sulfonamide drugs. The result indicated that the EuNP-HCA-LFA could specifically determine SM2.
Figure 5. Specificity of the EuNP-HCA-LFA over 10 sulfonamide drugs with SM2-GA-BSA as detective antigen.
3.6. Detection of SM2 in raw milk
3.6.1. Standard curve of the two LFAs in SM2-spiked raw milk
The standard curves of the two LFAs in raw milk were constructed by plotting the T/T0 against the logarithm of the concentrations of SM2. (A, B) indicated that the regression equations of the two LFAs with SM2-GA-BSA and SM2-DZ-BSA as the detective antigens were y= –0.2037 log (x) + 0.3781 (R2 =0.9782) and y= –0.2605 log (x) + 0.5079 (R2 =0.9836), respectively, where y is the T/T0, and x is the concentration of SM2, respectively. The IC50, LOD, and linear ranges of the two LFAs in raw milk are compared in . Similarly, the EuNP-HCA-LFA also offered advantages to detect SM2 in raw milk. The IC50, LOD, and linear range were 0.25, 0.0045, and 0.05–10 ng/mL, respectively.
Figure 6. Standard calibration curve of the two LFAs in raw milk were obtained by determining the T/T0 against the logarithm of the concentrations of SM2 under SM2-GA-BSA (A) and SM2-DZ-BSA (B) as detective antigens.
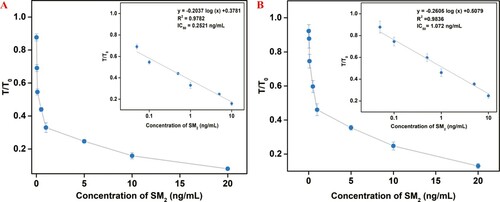
Table 2. Sensitivity and linear range of the two EuNP-LFAs in raw milk.
3.6.2. Recovery of EuNP-HCA-LFA for the detection of SM2 in raw milk
The recovery of EuNP-HCA-LFA for the determination of 0.05, 0.5, and 5 ng/mL SM2 in raw milk was examined using the test strips with SM2-GA-BSA as the detective antigen. revealed the average EuNP-HCA-LFA recoveries of 96.1–108.2% with CVs of 6.5–10.8%. These data indicated that the EuNP-HCA-LFA could reliably and precisely determine SM2 in raw milk samples.
Table 3. Recovery of SM2 on the EuNP-HCA-LFA in SM2-spiked milk sample.
3.7. Comparison of EuNP-HCA-LFA with other methods for SM2 detection
A comparison of the linear range and sensitivity of the EuNP-HCA-LFA in our study with those in other works is listed in . The results showed that EuNP-HCA-LFA exhibited the broadest linear range of 0.05–10 ng/mL and the lowest LOD of 0.0045 ng/mL in milk samples, which occurred because of the coupling of EuNP with HCA on the LFA system. As previously mentioned, EuNP, which has a large stokes shift, narrow emission bands, and high fluorescence intensity, increased the sensitivity. The use of HCA could further enhance the sensitivity of the method by fivefolds, thereby creating an ultra-sensitive LFA for SM2 detection in raw milk samples.
Table 4. Comparison of EuNP-HCA-LFA and other methods for SM2 detection.
4. Conclusions
EuNP combined with HCA was applied to the LFA for the first time for the rapid and ultra-sensitive detection of SM2 in raw milk samples. The novel method could dramatically enhance the sensitivity of LFA compared with other methods, demonstrating a linear range of 0.05–10 ng/mL and LOD of 0.0045 ng/mL in milk samples. This type of LFA offers promising application in the detection of other targets at low concentration.
Supplemental Material
Download MS Word (243.2 KB)Disclosure statement
No potential conflict of interest was reported by the authors.
ORCID
Additional information
Funding
Related Research Data
References
- Adrian, J., Pasche, S., Diserens, J. M., Sánchezbaeza, F., Gao, H., Marco, M. P., & Voirin, G. (2009). Waveguide interrogated optical immunosensor (WIOS) for detection of sulfonamide antibiotics in milk. Biosensors & Bioelectronics, 24(11), 3340–3346. doi: https://doi.org/10.1016/j.bios.2009.04.036
- Barani, A., & Fallah, A. A. (2015). Occurrence of tetracyclines, sulfonamides, fluoroquinolones and florfenicol in farmed rainbow trout in Iran. Food and Agricultural Immunology, 26(3), 420–429. doi: https://doi.org/10.1080/09540105.2014.950199
- Chen, Y., Chen, Q., Han, M., Liu, J., Zhao, P., He, L., ... Zhang, L. (2016). Near-infrared fluorescence-based multiplex lateral flow immunoassay for the simultaneous detection of four antibiotic residue families in milk. Biosensors & Bioelectronics, 79, 430–434. doi: https://doi.org/10.1016/j.bios.2015.12.062
- Chen, Y., Guo, L., Liu, L., Song, S., Kuang, H., & Xu, C. (2017). Ultrasensitive immunochromatographic strip for fast screening of 27 sulfonamides in honey and pork liver samples based on a monoclonal antibody. Journal of Agricultural and Food Chemistry, 65(37), 8248–8255. doi: https://doi.org/10.1021/acs.jafc.7b03190
- EU Regulation 508/1999, L60 (9-3-1999); 1999; pp. 16–52.
- Food and Drug Regulation, Canada gazette part II, Table 3, Division 15, Part B, 1991, 125, 1478–1480.
- Franek, M., Kolar, V., Deng, A., & Crooks, S. (1999). Determination of sulphadimidine (sulfamethazine) residues in milk, plasma, urine and edible tissues by sensitive ELISA. Food and Agricultural Immunology, 11(4), 339–349. doi: https://doi.org/10.1080/09540109999726
- Galarini, R., Diana, F., Moretti, S., Puppini, B., Saluti, G., & Persic, L. (2014). Development and validation of a new qualitative ELISA screening for multiresidue detection of sulfonamides in food and feed. Food Control, 35(1), 300–310. doi: https://doi.org/10.1016/j.foodcont.2013.07.014
- Goodrow, M. H., Harrison, R. O., & Hammock, B. D. (1990). Hapten synthesis, antibody development, and competitive inhibition enzyme immunoassay for s-triazine herbicides. Journal of Agricultural & Food Chemistry, 38(4), 990–996. doi: https://doi.org/10.1021/jf00094a016
- Hao, K., Suryoprabowo, S., Hong, T., Song, S., Liu, L., Zheng, Q., & Kuang, H. (2018). Immunochromatographic strip for ultrasensitive detection of fumonisin B1. Food and Agricultural Immunology, 1–12. doi:https://doi.org/10.1080/09540105.2018.1439455
- Hu, L. M., Luo, K., Xia, J., Xu, G. M., Wu, C. H., Han, J. J., ... Lai, W. H. (2017). Advantages of time-resolved fluorescent nanobeads compared with fluorescent submicrospheres, quantum dots, and colloidal gold as label in lateral flow assays for detection of ractopamine. Biosensors & Bioelectronics, 91, 95–103. doi: https://doi.org/10.1016/j.bios.2016.12.030
- Karageorgou, E., Manousi, N., Samanidou, V., Kabir, A., & Furton, K. G. (2016). Fabric phase sorptive extraction for the fast isolation of sulfonamides residues from raw milk followed by high performance liquid chromatography with ultraviolet detection. Food Chemistry, 196, 428-436. doi: https://doi.org/10.1016/j.foodchem.2015.09.060
- Kong, D., Liu, L., Song, S., Suryoprabowo, S., Li, A., Kuang, H., ... Xu, C. (2016). A gold nanoparticle-based semi-quantitative and quantitative ultrasensitive paper sensor for the detection of twenty mycotoxins. Nanoscale, 8(9), 5245–5253. doi: https://doi.org/10.1039/C5NR09171C
- Li, J., Duan, H., Xu, P., Huang, X., & Xiong, Y. (2016). Effect of different-sized spherical gold nanoparticles grown layer by layer on the sensitivity of an immunochromatographic assay. Rsc Advances, 6(31), 26178–26185. doi: https://doi.org/10.1039/C6RA03695C
- Li, X.W., Zhang, G.P., Liu, Q.T., Feng, C.H., Wang, X.N., Yang, Y.Y., & Zhao, D. (2009). Development of immunoassays for the detection of sulfamethazine in swine urine. Food Additives & Contaminants Part A Chemistry Analysis Control Exposure & Risk Assessment, 26(3), 314–325.
- Luo, K., Hu, L., Guo, Q., Wu, C., Wu, S., Liu, D., ... Lai, W. (2017). Comparison of 4 label-based immunochromatographic assays for the detection of Escherichia coli O157:H7 in milk. Journal of Dairy Science, 100, 5176–5187. doi: https://doi.org/10.3168/jds.2017-12554
- Marshall, B. M., & Levy, S. B. (2011). Food animals and antimicrobials: Impacts on human health. Clinical Microbiology Reviews, 24(4), 718–733. doi: https://doi.org/10.1128/CMR.00002-11
- Ministry of Agriculture of the People's Republic of China. Regulation No. 235, 2002.
- NãReoja, T., Rosenholm, J. M., LamminmãKi, U., & HãNninen, P. E. (2017). Super-sensitive time-resolved fluoroimmunoassay for thyroid-stimulating hormone utilizing europium(III) nanoparticle labels achieved by protein corona stabilization, short binding time, and serum preprocessing. Analytical & Bioanalytical Chemistry, 409(13), 3407–3416. doi: https://doi.org/10.1007/s00216-017-0284-z
- Peng, D., Li, Z., Wang, Y., Liu, Z., Feng, S., & Yuan, Z. (2017a). Enzyme-linked immunoassay based on imprinted microspheres for the detection of sulfamethazine residue. Journal of Chromatography A, 1506, 9–17. doi: https://doi.org/10.1016/j.chroma.2017.05.016
- Peng, J., Liu, L., Kuang, H., Cui, G., & Xu, C. (2016a). Development of an icELISA and immunochromatographic strip for detection of norfloxacin and its analogs in milk. Food & Agricultural Immunology, 28(2), 1–11.
- Peng, J., Liu, L., Kuang, H., Cui, G., & Xu, C. (2016b). Development of an icELISA and immunochromatographic strip for detection of norfloxacin and its analogs in milk. Food & Agricultural Immunology, 28(2), 288–298. doi: https://doi.org/10.1080/09540105.2016.1263987
- Peng, T., Pei, X., Zheng, Y., Wang, J., Wang, Q., Li, J., ... Jiang, H. (2017b). Performance of fluorescence microspheres-based immunochromatography in simultaneous monitoring of five quinoxalines. Food and Agricultural Immunology, 28(6), 1544–1554. doi:https://doi.org/10.1080/09540105.2017.1354357
- Sajid, M., Kawde, A. N., & Daud, M. (2015). Designs, formats and applications of lateral flow assay: A literature review. Journal of Saudi Chemical Society, 19(6), 689–705. doi: https://doi.org/10.1016/j.jscs.2014.09.001
- Shao, B., Dong, D., Wu, Y., Hu, J., Meng, J., Tu, X., & Xu, S. (2005). Simultaneous determination of 17 sulfonamide residues in porcine meat, kidney and liver by solid-phase extraction and liquid chromatography–tandem mass spectrometry. Analytica Chimica Acta, 546(2), 174–181. doi: https://doi.org/10.1016/j.aca.2005.05.007
- Shim, W. B., Kim, J. S., Kim, M. G., & Chung, D. H. (2013). Rapid and sensitive immunochromatographic strip for on–site detection of sulfamethazine in meats and eggs. Journal of Food Science, 78(10), M1575–M1581. doi: https://doi.org/10.1111/1750-3841.12232
- Su, Y. L., & Cheng, S. H. (2017). A novel electroanalytical assay for sulfamethazine determination in food samples based on conducting polymer nanocomposite-modified electrodes. Talanta, 180, 81-89. doi: https://doi.org/10.1016/j.talanta.2017.12.026
- Sun, Y., Xie, J., Peng, T., Wang, J., Xie, S., Yao, K., ... Jiang, H. (2017). A New method based on time-resolved fluoroimmunoassay for the detection of streptomycin in milk. Food Analytical Methods, 10(7), 1–8. doi: https://doi.org/10.1007/s12161-017-0797-2
- Wang, J., Wang, Q., Zheng, Y., Peng, T., Yao, K., Xie, S., & Jiang, H. (2018). Development of a quantitative fluorescence-based lateral flow immunoassay for determination of chloramphenicol, thiamphenicol and florfenicol in milk. Food and Agricultural Immunology, 29(1), 56–66. doi: https://doi.org/10.1080/09540105.2017.1359498
- Wang, L., Wu, J., Wang, Q., He, C., Zhou, L., Wang, J., & Pu, Q. (2012). Rapid and sensitive determination of sulfonamide residues in milk and chicken muscle by microfluidic chip electrophoresis. Journal of Agricultural & Food Chemistry, 60(7), 1613–1618. doi: https://doi.org/10.1021/jf2036577
- Wang, Z., Zhang, H., Ni, H., Zhang, S., & Shen, J. (2014). Development of a highly sensitive and specific immunoassay for enrofloxacin based on heterologous coating haptens. Analytica Chimica Acta, 820, 152–158. doi: https://doi.org/10.1016/j.aca.2014.02.043
- Xing, K. Y., Peng, J., Liu, D. F., Hu, L. M., Wang, C., Li, G. Q., & Lai, W.H. (2018). Novel immunochromatographic assay based on Eu (III)-doped polystyrene nanoparticle-linker-monoclonal antibody for sensitive detection of Escherichia coli O157:H7. Analytica Chimica Acta, 998, 52–59. doi: https://doi.org/10.1016/j.aca.2017.10.027
- Xu, W., Su, S., Jiang, P., Wang, H., Dong, X., & Zhang, M. (2010). Determination of sulfonamides in bovine milk with column-switching high performance liquid chromatography using surface imprinted silica with hydrophilic external layer as restricted access and selective extraction material. Journal of Chromatography A, 1217(46), 7198–7207.
- Zhang, Y., Peng, J., Guo, P., Li, G.Q., Zhang, K.Y., Lv, X., & Lai, W.H. (2018). Matrix effect of swine urine on time-resolved fluorescent nanobeads and colloidal gold immunochromatographic assay. Food and Agricultural Immunology, 1–11. doi:https://doi.org/10.1080/09540105.2018.1439456
- Zhou, Q., Peng, D., Wang, Y., Pan, Y., Wan, D., Zhang, X., & Yuan, Z. (2014). A novel hapten and monoclonal-based enzyme-linked immunosorbent assay for sulfonamides in edible animal tissues. Food Chemistry, 154(7), 52–62. doi: https://doi.org/10.1016/j.foodchem.2014.01.016