
ABSTRACT
In this study, we develop a sensitive indirect competitive chemiluminescent enzyme immunoassay (ic-CLEIA) to detect cadmium (Cd) in cereals. A luminol-hydrogen peroxide chemiluminescence system catalysed by horseradish peroxidase (HRP) was used as the signal detecting system. The method showed a half-maximal inhibition concentration (IC50) of 0.5 ng/mL and a limit of determination (LOD) of 0.06 ng/mL. The assay indicated an effective linear range from 0.16 to 1.56 ng/mL. There were no obvious cross-reactivities with other metal ions, including Hg2+, Pb2+, As2+, Ag+, Fe3+, Cu2+, Cr2+, Au3+, Ca2+, Mg2+, Mn2+ and Zn2+. Recovery rates ranged from 79.2% to 120.0% for rice, maize, wheat, brown rice and glutinous rice samples. Twenty-five practical cereal samples were analysed, and the comparative analysis of the results showed a strong correlation (r = 0.984) between the CLEIA and the GFAAS methods. The results indicated that the ic-CLEIA developed was acceptable to screen for cadmium in cereal samples.
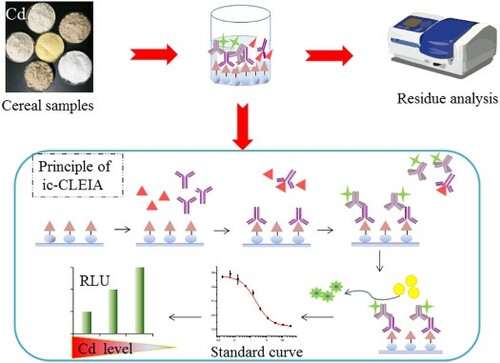
GRAPHICAL ABSTRACT
1. Introduction
Cadmium (Cd), with a white and glossy surface, is a toxic heavy metal and an environmental pollutant found around the world (Ran, Wang, Wang, Zhang, & Zhang, Citation2016). It easily accumulates in the human body and has a biological half-life of longer than 10 years (Jin et al., Citation2013). In addition, it is known to be a mutagenic metal able to induce apoptosis and oxidative stress (Ambily, Olivier, Karen, Emmy, & Ann, Citation2013). Initially, it was thought that only high, long-time exposure to Cd would harm human health. However, numerous data show that even low exposure to Cd can be damaging to the health of those exposed (Wallin et al., Citation2016). Cd exposure is reported to decrease bone density, increase the DNA methylation status of the liver and damage the kidneys and even the whole body (Callan, Devine, Qi, Ng, & Hinwood, Citation2015; Garcia & Corredor, Citation2004; Pierron, Baillon, Sow, Gotreau, & Gonzalez, Citation2014). Therefore, Cd contamination has posed an increasingly greater threat to humans in recent years because of its persistence, bioaccumulation and high toxicity (Singh & Kumar, Citation2017).
However, the development of technological progress and industrialization has led to the growing use of Cd, resulting in its widespread distribution (Li et al., Citation2014; Zhu et al., Citation2016). Such pollution is mainly due to anthropogenic activities, associated with mining activities, landfill leachate or industrial and domestic effluents, resulting in high levels of residual Cd in the surrounding soils, dust and water (Abdullah, Citation2013; Candeias et al., Citation2014; Singh et al., Citation2008). In some mine area, the maximum Cd value in rhizosphere soils, road dust and vegetables could be up to 3.4, 19.40 and 0.4 mg/kg, respectively (Candeias et al., Citation2014). Plants, especially rice grown on a contaminated field, can accumulate high levels of Cd, and if the level of Cd in the soil is higher, the concentration of Cd in rice can increase significantly (Nuapia, Chimuka, & Cukrowska, Citation2018). The way that metals accumulate in plants plays an important role in the transfer of Cd into food chains, since the main sources of ingested Cd in a diet are staple foods such as wheat, rice and potatoes, which provide approximately 40–50% of the average total Cd intake (Chen et al., Citation2018; Huang, Zhou, Sun, & Zhao, Citation2008; Orisakwe, Nduka, Amadi, Dike, & Bede, Citation2012). In addition, the daily intake of Cd through the diet varies greatly from differing countries depending on their levels of pollution. The highest intake of Cd is noted in Cd-polluted areas in Thailand, reaching 188–224 μg a day (Satarug et al., Citation2013), while the lowest is recorded in Sweden, amounting to 10 μg per day (Sand & Becker, Citation2012). However, according to the world health organization (WHO) and the Food and Agriculture Organization of the United Nations (FAO), the Provisional Tolerable Monthly Intake (PTMI) for Cd intake has been re-established to be 25 μg/kg bw (FAO/WHO, Citation2010).
It is necessary to develop analytical methods to monitor Cd in cereals that are consumed by humans daily. Currently, the Cd in some samples is mainly analysed by instrumental methods, such as graphite furnace atomic absorption spectroscopy (GFAAS) (Ahmadi, Khanmohammadi, Jafarpour, & Eftekhari, Citation2008), atomic fluorescence spectrometry (AFS) (Yang, Chi, Wang, & Zhang, Citation2015), inductively coupled plasma mass spectrometry (ICP-MS) (Nardi et al., Citation2009) and inductively coupled plasma atomic emission spectrometry (ICP-AES) (Sun, Zhang, Zhao, Wang, & Li, Citation2016). Other techniques such as the screen-printed carbon nanotubes electrodes assay (Simpson et al., Citation2018) and electrochemical impedance spectroscopy (Petovar, Xhanari, & Finšgar, Citation2018) are also mostly used in the laboratory. These techniques rely on sophisticated instruments and skilled technicians. In addition, the pretreatment of the samples is time-consuming, and the digestion process often requires large amounts of strong acids that can harm the environment. By contrast, immunoassays, primarily relying on the specific reaction between the antibody and the antigen, exhibit some unique characteristics such as being rapid, simple to perform, cost-effective and friendly to the environment, which enable them to satisfy the demands of high-throughput and on-site screens (He et al., Citation2011; Zhou et al., Citation2011).
Arai, Nakamura, Yoshida, and Tawarada (Citation2016), Song, Zou, Zhu, Liu, and Kuang (Citation2018) and Xing et al. (Citation2014) developed immunochromatographic strips for semi-quantitative detection of cadmium. Johnson (Citation1999) reported a fluorescence polarization immunoassay for cadmium. Until now, several ELISA methods for Cd determination have been well developed for environment samples. Zhan, Xi, and Zhou (Citation2015) obtained a cadmium-chelate specific polyclonal antibody and developed an indirect competitive ELISA to measure Cd in water. The assay exhibited cross-reactivity with Hg2+ (5.8%). He, Liu, Yang, and Sun (Citation2009) and Zhu et al. (Citation2007) developed indirect and direct competitive ELISA respectively, to detect Cd in aqueous samples. There are only a few cases of the application of ELISA to detect Cd in grains (Abe et al., Citation2011, Citation2014; Liu et al., Citation2009) with the limit of detection (LOD) among 0.20 and 5 ng/mL. To date no report on CLEIA for Cd detection is available to the best of our knowledge.
A chemiluminescent immunoassay (CLEIA) using a chemiluminescent substrate instead of traditional chromogenic substrates provides greater sensitivity by 2–3 orders of magnitude (Botchkareva et al., Citation2003). In addition, due to more rapid colorimetric procedures, the time for the CLEIA can be reduced by 20–30 min compared with ELISA, which makes it more suitable for rapid analysis. In this study, a high-sensitive indirect competitive CLEIA was developed for the trace determination of Cd in cereals. Instead of strong acid digestion, this assay extracts Cd with diluted HNO3 in the pretreatment step, which makes it safer, more rapid and convenient.
2. Material and methods
2.1. Materials and reagents
Cd, Hg, Pb, As, Ag, Fe, Cu, and Cr (1000 μg/mL in 2% HNO3) were purchased from Aladdin Industrial Co. (Shanghai, China). Ovalbumin (OVA), 2-[4-(2-Hydroxyethyl)-1-piperazinyl] ethanesulfonic acid (HEPES) and horseradish peroxidase (HRP)-labeled goat anti-mouse IgG were purchased from Sigma-Aldrich (St. Louis, MO, USA). White, opaque, high-binding 96-well polystyrene microtiter plates were purchased from Shenzhen Jincanhua Industrial Co. Ltd. (Shenzhen, China). Anti-Cd-EDTA monoclonal antibody (mAb) was obtained from Wuxi Jieshengjiekang Biotechnology Co. Ltd. (Wuxi, China). Isothiocyanatobenzylethylenediamine-N,N,N′,N′-tetraacetic acid (ITCBE) was purchased from Dojindao Laboratories (Shanghai, China).The Super Signal West Pico CL substrate (stable peroxide buffer, A; luminol/enhancer, B) was obtained from Guangzhou Wanlian Biotechnology Co. Ltd. (Guangzhou, China). All other reagents were purchased from Qixiang Trade Co. Ltd. (Guangzhou, China). Microtiter plates were washed in a DEM-3 microplate washer (Tuopu, Beijing, China). A Spectra Max M5 microplate reader was purchased from Molecular Devices (CA, USA). Atomic absorption spectroscopy equipped with the graphite tube was used for GFAAS verification (ZEEnit 650P, Analytik Jena AG, Germany).
2.2. Buffers
Carbonate buffer (0.1 mol/L, pH 9.6); phosphate buffered saline (PBS, 0.1 mol/L, pH 7.4 or pH 9.0); PBST (PBS containing 0.05% Tween-20, pH 7.4); HBS buffer (0.1 mol/L HEPES, pH 7.4); HBS-EDTA (HBS containing 0.1 μmol/L EDTA, pH 7.4).
2.3. Preparation of the coating antigen
Two milligrams of ITCBE was dissolved in 200 μL of DMSO; 20 mg of OVA was dissolved in 500 μL of PBS (0.1 mol/L, pH 9.0), and the ITCBE solution was then slowly added dropwise into the OVA solution. After stirring at room temperature for 24 h, the mixture was dialysed against PBS (0.1 mol/L, pH 7.4) for 2 days. After this, 1.10 mL of Cd2+ solution (1000 μg/mL) was added to the ITCBE-OVA solution, and the pH of the mixture was adjusted to 7.0 before stirring at room temperature for 3 h. The small unconjugated molecules were removed by buffer dialysing with PBS (0.1 mol/L, pH 7.4) for 2 days (Blake et al., Citation1996; Song et al., Citation2018).
2.4. Procedure of CLEIA
The white, opaque 96-well polystyrene microtiter plate was coated with 100 μL/well of Cd-ITCBE-OVA in 0.1 mol/L carbonate buffer (pH 9.6). After incubation at 37°C overnight, the plate was washed with washing buffer (PBS containing 2% Tween-20, pH 7.4) twice and then blocked with 120 μL of 2% BSA in PBS (0.1 mol/L, pH 7.4) each well for 3 h at 37°C. After these steps, 50 μL of the sample or Cd standard solution (HBS-EDTA buffer, containing 0.1 μmol/L of HBS, pH 7.4) was added to each well. For the competition reactions, 50 μL of purified mAb was immediately added to each well, and the plate was incubated at 37°C for 30 min. Then the plate was washed five times, and 100 μL/well HRP-labeled goat anti-mouse IgG was added, and the plate was incubated at 37°C for 30 min. Then 100 μL/well of supersignal chemiluminescence substrate solution (A was mixed with an equivalent volume of B) was added and measured using a Spectra Max M5 microplate reader immediately. The relative luminescent unit (RLU) of each well was determined and analysed individually (Yu et al., Citation2016).
2.5. Optimization of the assay conditions and standard curve
Several experimental parameters, including the concentrations of the coating antigen and antibody, working buffer systems, concentration of EDTA, reaction time and pH were optimized to improve the CLEIA sensitivity. For each condition, standard curve was established, and the maximum RLU (RLUmax), 50% decrease point in RLUmax (IC50) and RLUmax/IC50 ratio were obtained from the curves, based on which the appropriate value of each parameter was determined. Under the optimized working conditions, calibration curves were fitted using 11 concentration levels of standard solution ranging from 0.005 to 333.33 ng/mL, each measured in triplicate. Standard curves were obtained by plotting the RLU/RLU0 values against the logarithm of analyte concentration, where RLU and RLU0 were the values of the wells with and without Cd-EDTA solution, respectively. The results were calculated by using Origin version 8.0 (OriginLab, Northampton, MA, USA).
2.6. Determination of cross-reactivity
The cross-reactivity (CR) for several metal ions including Cd2+, Hg2+, Pb2+, As2+, Ag+, Fe3+, Cu2+, Cr2+, Au3+, Ca2+, Mg2+, Mn2+ and Zn2+ was tested using CLEIA. Metal ions with different concentrations that ranged from 0.01 to 2000 ng/mL were mixed with 0.1 μmmol/L EDTA. The CR values were calculated as CR (%) = [IC50 (Cd-EDTA) / IC50 (other metal chelate)] × 100% (Cui, Zhang, Huang, Yu, & Peng, Citation2011).
2.7. Sample preparation
Twenty-five samples were obtained from the local supermarket including rice (n = 5), wheat (n = 5), maize (n = 5), brown rice (n = 5) and glutinous rice (n = 5). The samples were ground and weighed, and 1.0–1.5 g samples were placed in 15 mL polypropylene centrifuge tubes. Then 4 mL of 2 mol/L ultrapure nitric acid was added. After vortexing, the samples were precipitated for 20 min to be completely extracted. After centrifugation at 4000 rpm for 15 min, the upper layer was further centrifuged at 13,000 rpm for 10 min. Then, 2 mL of supernatant was accurately taken, and the pH was adjusted to 7.4 with 4 mol/L NaOH, finally bringing the volume to 4 mL. The solution after pretreatment was analysed using this developed CLEIA and GFAAS at a wavelength of 228.8 nm (Li et al., Citation2010).
2.8. Recovery
Cd was added to the ground sample solution to produce final concentrations of 37, 200, and 375 ng/g. All of the spiked samples were prepared as described in the “2.7. Sample preparation” section and detected with CLEIA. The recovery (%) was calculated using the following formula: recovery (%) = [(quantity measured)] / (quantity spiked)] × 100%.
3. Results and discussion
3.1. Optimization of CLEIA
3.1.1. Optimization of coating antigen concentration and antibody concentration
For coating antigen concentration and antibody concentration, a preliminary checkerboard assay was performed to assess the optimal coating concentration (ranging from 62.5 to 500 ng/mL) and the antibody concentration (ranging from 39.5 to 400 ng/mL), under which the IC50 was the lowest, and the RLUmax/IC50 was the highest, the result indicated that the pairing of coating concentration (250 ng/mL) and antibody concentration (110 ng/mL) provided the highest sensitivity.
3.1.2. Optimization of working buffer systems
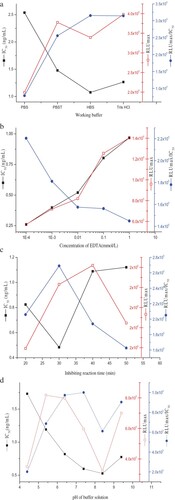
The reaction of antigen and antibody is characterized by weak intermolecular bonds that can be easily affected by reaction systems (Xing et al., Citation2009). Four buffer systems (PBS, PBST, HBS and Tris-HCl, 0.1 mol/L, pH 7.4) were used for the potential working buffer. The results indicated that there was no significant difference between HBS (1.08 ng/mL) and Tris-HCl (1.27 ng/mL) for IC50, but the higher RLUmax/IC50 was obtained using HBS ((a)). Therefore, the HBS buffer system is more suitable for this antibody–antigen interaction. PBS and PBST were considered to not be useful for these experiments because of their high IC50.
Figure 1. Optimized parameters on the CLEIA performance for Cd. (a) The effect of different working buffer for dilution. (b) The effect of different concentrations of EDTA. (c) The effect of different inhibiting reaction time. (d) The effect of different pH of buffer solution.
3.1.3. Optimization of concentration of EDTA
Since the antibody could only specifically recognize Cd-EDTA chelate instead of free Cd, it was necessary to add EDTA to the sample prior to measurement (Sasaki et al., Citation2008), thus the concentration of EDTA was an important and necessary influencing factor among the metal-CLEIA procedures. The Cd2+ was diluted in HBS that contained EDTA at concentrations of 0.0001, 0.001, 0.01, 0.1 and 1 mmol/L. The mixture of Cd2+ and EDTA was added to the wells. With the increasing of EDTA concentration, the IC50 increased from 0.26 to 0.97 ng/mL. This effect was probably due to the inhibitory effect of EDTA on the enzyme activity. The highest level of sensitivity was obtained with 0.0001 mmol/L EDTA in HBS. The result indicated that 0.0001 mmol/L EDTA was sufficient enough to chelate a low dose of Cd2+ for measurement ((b)).
3.1.4. Optimization of inhibition reaction time
Interaction of antigen and antibody is a dynamic equilibrium reaction and the reaction time is of great importance for the result. Different inhibition reaction times (20, 30, 40 and 50 min) were compared. The 30 min incubation was enough for the antigen–antibody equilibrium interaction, and it had the lowest IC50, which was 0.48 ng/mL ((c)).
3.1.5. Optimization of reaction buffer pH
Generally, the methods for extracting Cd involve the use of acid solutions, mostly nitric acid, since Cd only dissolves in acidic solutions. However, extreme acidity or alkalinity would damage the antibody, leading to false positives or negatives. Therefore, it was necessary to examine the pH tolerance of the CLEIA. As shown in (d), the IC50 decreased with increasing HBS pH values from the range of 4.4 to 8.4 and then began to increase. At the same time, a gradual increase in RLUmax/IC50 of the assay was observed with increasing pH values from 4.4 to 7.4, with the RLUmax/IC50 reaching its low at pH 8.4. Considering the multiple factors affecting the CLEIA method, pH 7.4 for HBS was chosen to be the optimal pH for the reaction system. Additional studies of the pH indicated that when the pH of the assay was below 4.4 or above 9.4, no effective curve was available. This confirms that it was a critical step to adjust the pH before detection.
3.2. Standard curves
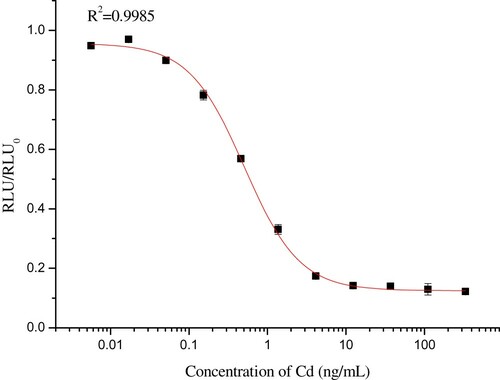
Under the optimized parameters, the standard curve was obtained using 11 concentration levels of standard solution and was plotted in the form of RLU/RLU0 against the logarithm of the concentrations (). The established CLEIA system for Cd detection is highly sensitive with an IC50 of 0.50 ng/mL and a LOD of 0.06 ng/mL.
Figure 2. Standard curve of the CLEIA procedure under the optimized parameters.
3.3. Cross-reactivity and stability of CLEIA
The specificity of the developed CLEIA was examined by testing the cross-reactivity rates of several metal ions (Hg2+, Pb2+, As2+, Ag+, Fe3+, Cu2+, Cr2+, Au3+, Ca2+, Mg2+, Mn2+ and Zn2+). As shown in , the antibody exhibited negligible cross-reactivity with any of the metals tested (CR% < 0.1%), which demonstrated that the antibody was highly specific to Cd2+. In addition, EDTA and the EDTA-based chelates combined with the metal ions mentioned above also showed no reaction with the antibody (results not shown).
Table 1. Cross-reactivity with different metal ions and EDTA.
3.4. Sample pretreatment and matrix effects elimination
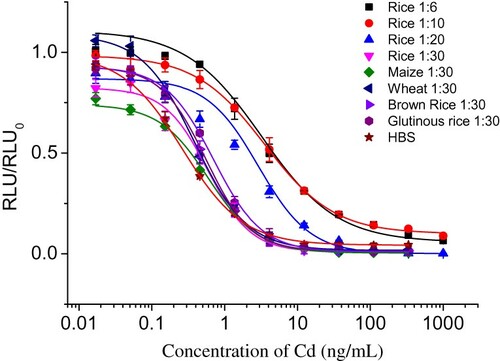
To develop an immunoassay, it was of great importance to deal with the matrix effects. The acid residues would cause non-specific interference with some types of proteins and pigments. In this study, the dilution method was used to eliminate the matrix effects. After the pretreatment of rice samples, the supernatants were diluted 6-, 10-, 20- and 30-fold. As shown in , the matrix effects were reduced to acceptable levels when the samples were diluted 30-fold. The diagram shows that the 30-fold dilution supernatant of the rice sample had an IC50 of 0.44 ng/mL, a linear range of 0.26–3.23 ng/mL and an LOD (IC10) of 0.18 ng/mL, similar to the HBS buffer. This trend was also apparent among the maize, wheat, brown rice and glutinous rice samples when the supernatant was diluted 30-fold (). Therefore, it was apparent that sample preparation with 30-fold dilution can reduce the matrix effect.
Figure 3. Matrix effects and their elimination of five cereals samples.
3.5. Determination of recovery
Five kinds of negative cereal samples were spiked with Cd at three concentrations and determined using both the CLEIA and the GFAAS to evaluate the recovery rates of the developed CLEIA. The analysis was performed in triplicate for each concentration. The results are shown in . The recoveries for both methods ranged from 79.2% to 120.0%, and the RSD values were from 6.0% to 15.8%.
Table 2. Recoveries of Cd from spiked cereal samples by CLEIA and GFAAS.
3.6. Screening and analysis of practical samples
The commercial cereal samples (n = 25) were analysed using both the CLEIA and the GFAAS. The results were listed in . The correlation coefficient of the CLEIA and the GFAAS was 0.984, indicating good reliability and accuracy ().
Figure 4. Comparison of GFAAS and CLEIA for screening Cd in different food sample.
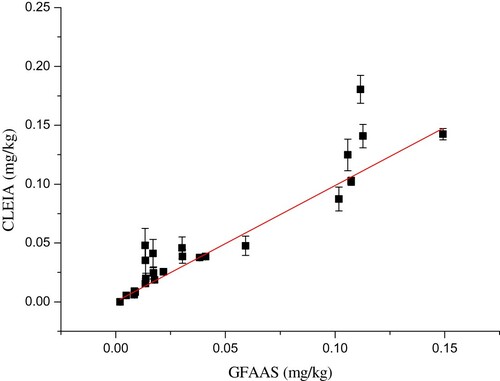
Table 3. Concentration of Cd in practical cereal samples determined by CLEIA and GFAAS.
4. Conclusion
In this paper, a sensitive and reliable CLEIA was developed to determine the levels of Cd in cereals. The optimized CLEIA provided a linear detection range from0.16 to 1.56 ng/mL, and the IC50 was 0.5 ng/mL. The method showed a detection limit of 0.06 ng/mL without cross-reactivity with 12 other metals or their chelates. The recoveries of spiked cereal samples ranged from 79.2% to 120.0%. There was a good correlation between the CLEIA and the GFAAS method. This developed CLEIA could be a suitable tool to rapidly screen for Cd in cereal samples at the locations where facilities for acid digestion and atomic absorption spectroscopy analysis are not available.
Disclosure statement
No potential conflict of interest was reported by the authors.
Additional information
Funding
References
- Abdullah, E. J. (2013). Quality assessment for Shatt Al-Arab river using heavy metal pollution index and metal index. Journal of Environment and Earth Science, 3(5), 2224–3216.
- Abe, K., Nakamura, K., Arao, T., Sakurai, Y., Nakano, A., Suginuma, C., … Sasaki, K. (2011). Immunochromatography for the rapid determination of cadmium concentrations in wheat grain and eggplant. Journal of the Science of Food and Agriculture, 91(8), 1392–1397. doi: https://doi.org/10.1002/jsfa.4321
- Abe, K., Nakamura, K., & Naito, S. (2014). Interlaboratory study of immunochromatography for the rapid determination of cadmium concentrations in cereals and soybeans. Journal of AOAC International, 97(3), 913–920. doi: https://doi.org/10.5740/jaoacint.12-319
- Ahmadi, F., Khanmohammadi, A., Jafarpour, J., & Eftekhari, S. A. (2008). Micelle mediated methodology for the determination of heavy metals in real samples by flame atomic absorption spectrometry. Kuwait Journal Ofence and Engineering, 37(1A), 85–98.
- Ambily, R. A., Olivier, D. G., Karen, S., Emmy, V. K., & Ann, C. (2013). Cadmium-induced pathologies: Where is the oxidative balance lost (or not)? International Journal of Molecular Sciences, 14(3), 6116–6143. doi: https://doi.org/10.3390/ijms14036116
- Arai, H., Nakamura, K., Yoshida, Y., & Tawarada, K. (2016). Development of quantitative immunochromatographic kit and visual screening immunoassay strip for cadmium. Analytical and Bioanalytical Chemistry, 408(22), 6063–6068. doi: https://doi.org/10.1007/s00216-016-9475-2
- Blake, D. A., Chakrabarti, P., Khosraviani, F. M., Hatcher, F. M., Westhoff, C. M., Geoebel, P., … Blake, R. C. (1996). Metal binding properties of a monoclonal antibody directed toward metal-chelate complexes. Journal of Biological Chemistry, 271(44), 27677–27685. doi: https://doi.org/10.1074/jbc.271.44.27677
- Botchkareva, A. E., Eremin, S. A., Montoya, A., Manclus, J. J., Mickova, B., Rauch, P., … Girotti, S. (2003). Development of chemiluminescent ELISAs to DDT and its metabolites in food and environmental samples. Journal of Immunological Methods, 283(1-2), 45–57. doi: https://doi.org/10.1016/j.jim.2003.08.016
- Callan, A. C., Devine, A., Qi, L., Ng, J. C., & Hinwood, A. L. (2015). Investigation of the relationship between low environmental exposure to metals and bone mineral density, bone resorption and renal function. International Journal of Hygiene and Environmental Health, 218(5), 444–451. doi: https://doi.org/10.1016/j.ijheh.2015.03.010
- Candeias, C., Melo, R., Ávila, P. F., Silva, E. F., Salgueiro, A. R., & Teixeira, J. P. (2014). Heavy metal pollution in mine–soil–plant system in S. Francisco de Assis – Panasqueira mine (Portugal). Applied Geochemistry, 44(3), 12–26. doi: https://doi.org/10.1016/j.apgeochem.2013.07.009
- Chen, L., Zhou, S. L., Shi, Y. X., Wang, C. H., Li, B. J., Li, Y., & Wu, S. (2018). Heavy metals in food crops, soil, and water in the Lihe River Watershed of the Taihu Region and their potential health risks when ingested. Science of the Total Environment, 615, 141–149. doi: https://doi.org/10.1016/j.scitotenv.2017.09.230
- Cui, J. L., Zhang, K., Huang, Q. X., Yu, Y. Y., & Peng, X. Z. (2011). An indirect competitive enzyme-linked immunosorbent assay for determination of norfloxacin in waters using a specific polyclonal antibody. Analytica Chimica Acta, 688(1), 84–89. doi: https://doi.org/10.1016/j.aca.2010.12.030
- Food and Agricuture Organization/World Health Organization (FAO/WHO). (2010). Joint FAO/WHO Expert Committee on Food Additives. Seventy-third meeting, Geneva, 8–7 June, 2010. Summany and conclusions, p. 24.
- Garcia, T. A., & Corredor, L. (2004). Biochemical changes in the kidneys after perinatal intoxication with lead and/or cadmium and their antagonistic effects when coadministered. Ecotoxicology and Environmental Safety, 57(2), 184–189. doi: https://doi.org/10.1016/S0147-6513(03)00063-0
- He, H., Liu, Z. Y., Yang, S. G., & Sun, C. (2009). Preparation of anti-cadmium-EDTA complex polyclonal antibody and its application for determination of cadmium in aqueous solution. Analytical Letters, 42(2), 409–424. doi: https://doi.org/10.1080/00032710802514832
- He, H., Tang, B., Sun, C., Yang, S. G., Zheng, W. J., & Hua, Z. C. (2011). Preparation of hapten-specific monoclonal antibody for cadmium and its ELISA application to aqueous samples. Frontiers of Environmental Science and Engineering in China, 5(3), 409–416. doi: https://doi.org/10.1007/s11783-011-0349-8
- Huang, M., Zhou, S., Sun, B., & Zhao, Q. G. (2008). Heavy metals in wheat grain: Assessment of potential health risk for inhabitants in Kunshan, China. Science of the Total Environment, 405(1-3), 54–61. doi: https://doi.org/10.1016/j.scitotenv.2008.07.004
- Jin, L., Zhang, L., Li, Z., Liu, J. M., Rrongwei, Y., & Aiguo, R. (2013). Placental concentrations of mercury, lead, cadmium, and arsenic and the risk of neural tube defects in a Chinese population. Reproductive Toxicology, 35(1), 25–31. doi: https://doi.org/10.1016/j.reprotox.2012.10.015
- Johnson, D. K. (1999). A fluorescence polarization immunoassay for cadmium(II). Analytica Chimica Acta, 399(1-2), 161–172. doi: https://doi.org/10.1016/S0003-2670(99)00587-5
- Li, N., Fang, G., Liu, B., Zhang, J., Zhao, L., & Wang, S. (2010). A novel hydrophobic task specific ionic liquid for the extraction of Cd(II) from water and food samples as applied to AAS determination. Analytical Sciences the International Journal of the Japan Society for Analytical Chemistry, 26(4), 455–459. doi: https://doi.org/10.2116/analsci.26.455
- Li, W. L., Xu, B. B., Song, Q. J., Liu, X. M., Xu, J. M., & Brookes, P. C. (2014). The identification of “hotspots” of heavy metal pollution in soil-rice systems at a regional scale in eastern China. Science of the Total Environment, 472, 407–420. doi: https://doi.org/10.1016/j.scitotenv.2013.11.046
- Liu, G. L., Wang, J. F., Li, Z. Y., Liang, S. Z., Liu, J. H., & Wang, X. N. (2009). Development of direct competitive enzyme-linked immunosorbent assay for the determination cadmium residue in farm produce. Applied Biochemistry and Biotechnology, 159(3), 708–717. doi: https://doi.org/10.1007/s12010-009-8539-6
- Nardi, E. P., Evangelista, F. S., Tormen, L., Saintpierre, T. D., Curtius, A. J., de Souza, S. S., & Barbosa, F. (2009). The use of inductively coupled plasma mass spectrometry (ICP-MS) for the determination of toxic and essential elements in different types of food samples. Food Chemistry, 112(3), 727–732. doi: https://doi.org/10.1016/j.foodchem.2008.06.010
- Nuapia, Y., Chimuka, L., & Cukrowska, E. (2018). Assessment of heavy metals in raw food samples from open markets in two African cities. Chemosphere, 196, 339–346. doi: https://doi.org/10.1016/j.chemosphere.2017.12.134
- Orisakwe, O. E., Nduka, J. K., Amadi, C. N., Dike, D. O., & Bede, O. (2012). Heavy metals health risk assessment for population via consumption of food crops and fruits in Owerri, South Eastern, Nigeria. Chemistry Central Journal, 6(1), 77–83. doi: https://doi.org/10.1186/1752-153X-6-77
- Petovar, B., Xhanari, K., & Finšgar, M. (2018). A detailed electrochemical impedance spectroscopy study of a bismuth-film glassy carbon electrode for trace metal analysis. Analytica Chimica Acta, 1004, 10–21. doi: https://doi.org/10.1016/j.aca.2017.12.020
- Pierron, F., Baillon, L., Sow, M., Gotreau, S., & Gonzalez, P. (2014). Effect of low-dose cadmium exposure on DNA methylation in the endangered European Eel. Environmental Science and Technology, 48(1), 797–803. doi: https://doi.org/10.1021/es4048347
- Ran, J., Wang, D., Wang, C., Zhang, G., & Zhang, H. L. (2016). Heavy metal contents, distribution, and prediction in a regional soil-wheat system. Science of the Total Environment, 544, 422–431. doi: https://doi.org/10.1016/j.scitotenv.2015.11.105
- Sand, S., & Becker, W. (2012). Assessment of dietary cadmium exposure in Sweden and population health concern including scenario analysis. Food and Chemical Toxicology, 50(3-4), 536–544. doi: https://doi.org/10.1016/j.fct.2011.12.034
- Sasaki, K., Oguma, S., Glass, T., Namiki, Y., Sugiyama, H., Ohmura, N., & Blake, D. A. (2008). Simple method to reduce interference from excess magnesium in cadmium immunoassays. Journal of Agricultural and Food Chemistry, 56(17), 7613–7616. doi: https://doi.org/10.1021/jf8011147
- Satarug, S., Swaddiwudhipong, W., Ruangyuttikarn, W., Ruangyuttikarn, W., Nishijo, M., & Ruiz, P. (2013). Modeling cadmium exposures in low- and high-exposure areas in Thailand. Environmental Health Perspectives, 121(5), 531–536. doi: https://doi.org/10.1289/ehp.1104769
- Simpson, A., Pandey, R. R., Chusuei, C. C., Ghosh, K., Patel, R., & Wanekaya, A. K. (2018). Fabrication characterization and potential applications of carbon nanoparticles in the detection of heavy metal ions in aqueous media. Carbon, 127, 122–130. doi: https://doi.org/10.1016/j.carbon.2017.10.086
- Singh, U. K., & Kumar, B. (2017). Pathways of heavy metals contamination and associated human health risk in Ajay River basin, India. Chemosphere, 174, 183–199. doi: https://doi.org/10.1016/j.chemosphere.2017.01.103
- Singh, U. K., Kumar, M., Chauhan, R., Jha, P. K., Ramanathan, A. L., & Subramanian, V. (2008). Assessment of the impact of landfill on groundwater quality: A case study of the Pirana site in western India. Environmental Monitoring and Assessment, 141(1-3), 309–321. doi: https://doi.org/10.1007/s10661-007-9897-6
- Song, S. S., Zou, S. Z., Zhu, J. P., Liu, L. Q., & Kuang, H. (2018). Immunochromatographic paper sensor for ultrasensitive colorimetric detection of cadmium. Food and Agricultural Immunology, 29(1), 3–13. doi: https://doi.org/10.1080/09540105.2017.1354358
- Sun, J., Zhang, J., Zhao, Y., Wang, Y., & Li, W. (2016). Determination and multivariate analysis of mineral elements in the medicinal Hoelen Mushroom, Wolfiporia extensa (Agaricomycetes), from China. International Journal of Medicinal Mushrooms, 18(5), 433–444. doi: https://doi.org/10.1615/IntJMedMushrooms.v18.i5.70
- Wallin, M., Barregard, L., Sallsten, G., Lundh, T., Karlsson, M. K., Lorentzon, M., … Mellström, D. (2016). Low-level cadmium exposure is associated with decreased bone mineral density and increased risk of incident fractures in elderly men: The MrOs Sweden study. Journal of Bone and Mineral Research, 31(4), 732–741. doi: https://doi.org/10.1002/jbmr.2743
- Xing, C., Kuang, H., Hao, C., Liu, L., Wang, L., & Xu, C. (2014). A silver enhanced and sensitive strip sensor for cadmium detection. Food and Agricultural Immunology, 25(2), 287–300. doi: https://doi.org/10.1080/09540105.2013.781140
- Xing, W. W., He, L., Yang, H., Sun, C. J., Li, D. W., Yang, X. M., … Deng, A. (2009). Development of a sensitive and group-specific polyclonal antibody-based enzyme-linked immunosorbent assay (ELISA) for detection of malachite green and leucomalachite green in water and fish samples. Journal of the Science of Food and Agriculture, 89(13), 2165–2173. doi: https://doi.org/10.1002/jsfa.3695
- Yang, X. A., Chi, M. B., Wang, Q. Q., & Zhang, W. B. (2015). Efficient generation of volatile species for cadmium analysis in seafood and rice samples by a modified chemical vapor generation system coupled with atomic fluorescence spectrometry. Analytica Chimica Acta, 869, 11–20. doi: https://doi.org/10.1016/j.aca.2015.03.010
- Yu, S. C., Yu, F., Li, Y. P., Liu, L., Zhang, H. Q., Qu, L. B., & Wu, Y. J. (2016). Magnetic nanoparticles replacing microplate as immobile phase could greatly improve the sensitivity of chemiluminescence enzymatic immunoassay for deoxynivalenol. Food Control, 60, 500–504. doi: https://doi.org/10.1016/j.foodcont.2015.08.012
- Zhan, X. J., Xi, T., & Zhou, P. (2015). Preparation of a polyclonal antibody against the cadmium–DTPA complex and its application for determination of cadmium. Food and Agricultural Immunology, 26(6), 794–803. doi: https://doi.org/10.1080/09540105.2015.1036354
- Zhou, Y., Tian, X. L., Li, Y. S., Zhang, Y. Y., Yang, L., Zhang, J. H., … Liu, Z.-S. (2011). A versatile and highly sensitive probe for Hg(II), Pb(II) and Cd(II) detection individually and totally in water samples. Biosensors and Bioelectronics, 30(1), 310–314. doi: https://doi.org/10.1016/j.bios.2011.08.034
- Zhu, P., Liang, X. X., Wang, P., Wang, J., Gao, Y. H., Hu, S. G., … Yang, X.-F. (2016). Assessment of dietary cadmium exposure: A cross-sectional study in rural areas of south China. Food Control, 62, 284–290. doi: https://doi.org/10.1016/j.foodcont.2015.10.046
- Zhu, X. X., Xu, L., Lou, Y., Yu, H. N., Li, X., Blake, D. A., & Liu, F. Q. (2007). Preparation of specific monoclonal antibodies (MAbs) against heavy metals: MAbs that recognize chelated cadmium ions. Journal of Agricultural and Food Chemistry, 55(19), 7648–7653. doi: https://doi.org/10.1021/jf071025l