
 ?Mathematical formulae have been encoded as MathML and are displayed in this HTML version using MathJax in order to improve their display. Uncheck the box to turn MathJax off. This feature requires Javascript. Click on a formula to zoom.
ABSTRACT
Herein, we present a direct competitive biomimetic enzyme-linked immunosorbent assay (BELISA) method for the determination of semicarbazide (SEM) using a molecularly imprinted polymer (MIP) film as the bionic antibody. The best monomer (methacrylic acid) and molar ratio of monomer to template (4:1) were determined with the aid of computational simulation methods based on density functional theory (DFT). The MIP film was characterised by scanning electron microscopy and adsorption experiments. The results showed that the imprinted film was successfully synthesised with good adsorption performance. Under optimal conditions, the calibration curve was linear in the range of 1.0–1.0×10⁴ ng/mL (R2 = 0.9863). The detection limit (IC15) and sensitivity (IC50) were 1.0 and 85.7 ng/mL, respectively. This BELISA method was further applied to the analysis of SEM in food samples; recoveries ranged from 86.1% to 90.8%. These observations indicated that the developed method could be adapted for SEM quantification in food.
Introduction
Semicarbazide (SEM), a food contaminant, has been found in a wide variety of foodstuffs, arising from multiple pathways for its formation (Wang & Chan, Citation2016). Previous studies indicate that SEM is a protein-bound metabolite of nitrofurazone, which is abused in animal farming (Park, Kim, & Kang, Citation2017; Radovnikovic, Moloney, Byrne, & Danaher, Citation2011). Therefore, SEM usually acts as an excellent metabolic marker to indicate the illegal use of nitrofurazone in food production (EC, Citation2010; Stadler, Verzegnassi, Seefelder, & Racault, Citation2015). SEM is also a thermal degradation product of the dough improver azodicarbonamide used extensively in bread production (Chen et al., Citation2016). Emerging evidence suggests that SEM residue in food may be released from plastic package containing azodicarbonamide, or by absorption from water environments (Tian et al., Citation2017). In spite of the uncertain toxicity of SEM in humans, potential genotoxicity and carcinogenicity in rats has been demonstrated (Wang, Wong, & Chan, Citation2016). Therefore, sensing the presence of SEM in food samples is of significant importance not only for consumer exposure assessment concerning SEM, but also for identifying abuse of the illegal antibiotic nitrofurazone.
A number of analytical methods have been explored for the measurement of SEM in various samples. These include high-performance liquid chromatography with tandem mass spectrometry (HPLC-MS/MS) (An et al., Citation2012; Du, Chen, et al., Citation2014), enzyme-linked immunosorbent assay (ELISA) (Jiang et al., Citation2012; Li, Liu, & Wang, Citation2009), and immunochromatographic analysis (Tang, Xu, Wang, Xiang, & Yang, Citation2011). Among these methods, HPLC-MS/MS has been widely used due to its high sensitivity and accuracy (Li, Wei, & Jiang, Citation2016). However, HPLC-MS/MS methodology for the detection of SEM involves cumbersome extraction, expensive instrumentation, purification steps, and time-consuming derivatisation processes (Jin, Yang, Shao, & Qin, Citation2013). In contrast, immunochemical methods have attracted wide attention because of their high specificity, speed, and good feasibility. ELISA is a simple, sensitive, economical, and high-throughput method for specific antigen–antibody detection (Hu, Huang, Jiang, Fang, & Yang, Citation2010). However, this method requires antibodies produced by immunised animals, in which the immune cycle is long. Biological antibodies obtained after repeated immunisation are unstable in nature and cannot be stored at room temperature. Biomimetic antibodies prepared by molecular imprinting can overcome these defects inherent to biological antibodies (Wang, Sang, Liu, Liang, & Wang, Citation2017; Zhang, Cui, Han, Yu, & Shi, Citation2017). The molecular imprinting technique (MIT) is a method for the preparation of functional materials (Kriz, Ramström, & Mosbach, Citation1997). Molecularly imprinted polymer (MIP) prepared by this technique is a type of synthetic material which can bind to template molecules with high affinity. It can perform biomimetic recognition similar to antibody–antigen or enzyme–substrate systems and selectively adsorb template molecules (Kong, Pan, Fang, He, & Wang, Citation2014). MIP has been widely used in various fields, for example, food, environment, biology, chemistry, medicine, and other arenas due to its distinct merits, such as low cost, easy preparation, high selectivity, and chemical stability (Sarafraz-Yazdi & Razavi, Citation2015; Tang et al., Citation2018). The effectiveness of MIPs as biomimetic antibodies mainly depends on their adsorption and selectivity. Some studies have added MIP artificial antibodies to test tubes to develop ELISAs based on MIPs (Chianella et al., Citation2002; Surugiu et al., Citation2000). However, this method requires centrifugation or filtration to remove MIPs, which is cumbersome and time-consuming. Artificial MIP antibodies against different targets can be directly coated on the well surfaces of microtiter plates for competitive bionic ELISA, which can make this technique more convenient to operate (Du, Zhang, Zhang, Wen, & Saren, Citation2014; Sun, Xu, Ma, Qiao, & Xu, Citation2014; Tang et al., Citation2017). However, the artificial antibodies are synthesised on the surface of micro-porous plates based on molecular imprinting technology so as to conduct bionic ELISA for SEM residues in food, which has not been reported yet.
The aim of this study was to establish a rapid, accurate, and sensitive immunosorbent assay method for the determination of SEM residues in food samples. A computational modelling method based on density functional theory (DFT) was used to select functional monomers and to optimise the molar ratio of template to functional monomers. We directly synthesised an artificial MIP antibody on the well surface of a microtiter plate, and its applicability to replace the biological antibody in ELISA is described and discussed in detail below. A direct competitive biomimetic ELISA (BELISA) method using MIP as a bionic antibody was developed for SEM detection in genuine food samples under optimised conditions, with high selectivity and specificity.
Materials and methods
Materials
SEM (99.9%) was purchased from Yuanye Co. Ltd. (Shanghai, China), azobisisobutyronitrile (AIBN). methylene succinic acid was obtained from Tianli Chemical Reagent Co. Ltd. (Tianjin, China). Ethylene dimethacrylate (EGDMA), methacrylic acid (MAA), horseradish peroxidase (HRP), were provided by Sigma-Aldrich (St. Louis, MO, USA). Potassium chloride, sodium acetate, acetic acid, and NaOH were purchased from the National Group Chemical Reagent Co. (Beijing, China).
Solutions
Phosphate-buffered saline (PBS) – 0.1 M sodium phosphate-buffered saline (pH 7.4).
PBS-T – PBS buffer with 0.05% Tween-20.
TMB substrate solution – Add 3.3 mg TMB in 250 μL dimethyl sulfoxide to 25 mL phosphate citrate buffer (pH 4.3) containing 3.25 μL 30% H2O2 solution.
Stopping solution – 1.25 M H2SO4.
Instruments
A scanning electron microscope (Hitachi High-Technologies Corporation, Tokyo, Japan) was used for observing the surface topography of the MIP. A Fourier-transform infrared (FTIR) (PerkinElmer Co., Ltd, MA, USA) was used, Immunoassay absorbance was measured with a Multiskan Spectrum microplate spectrophotometer (Thermo Scientific Instrument Co., Ltd, CA, USA), SHA-B Constant temperature oscillator (WuYou Co., Ltd, Shanghai, China).
Computational modelling
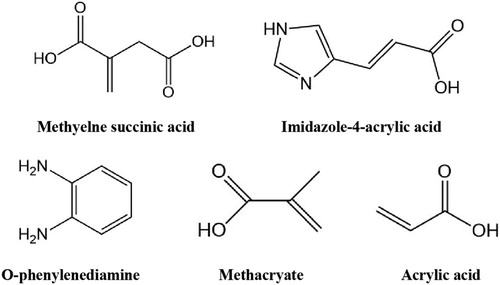
A computational modelling method based on DFT and commutative correlation function (M062X) was developed with Gaussian 09 software for the calculation of the binding energy (ΔE) between SEM and different functional monomers () (Sun & Wang, Citation2011; Worachartcheewan, Nantasenamat, Isarankura-Na-Ayudhya, Prachayasittikul, & Prachayasittikul, Citation2011). The three-dimensional structure, bond lengths, and bond angles of the complexes of SEM and different functional monomers were also analysed. ΔE was calculated according to Equation (1):
Figure 1. Molecular structures of different functional monomers.
Spectral analysis of template molecules and functional monomers in solution system
Using methanol–acetonitrile (1:1, v/v) as solvent, the ratios of template molecule SEMs to functional MAA monomers were 1:0, 1:2, 1:4, 1:6, and 1:8. The mixed solution was oscillated in a thermostatic water bath for 12 h. UV absorption spectra were measured with the corresponding concentration of functional monomer solution as a reference, and wavelength shifts were investigated.
Methanol–acetonitrile (1:1, v/v) was used as a solvent. 20 mM SEM solution and 200 mM MAA solution were prepared, then mixed in a 5:2 ratio, and methanol/acetonitrile (1:1, v/v) was used as control for FTIR analysis and comparison. The bonding reaction between SEM and MAA can be judged by analysing changes to the stretching vibration peaks of groups between the spectra before and after the bonding of SEM and MAA.
Preparation of MIP film
The preparation of MIP is shown in . Firstly, 0.2 mmol SEM and 0.8 mmol MAA were placed in 16 mL acetonitrile/methanol (1:1, v/v) with magnetic stirring at 37°C for 1 h. 2.4 mmol EGDMA and 20 mg AIBN were added in turn, with magnetic stirring at 37°C for 1 h. The mixed liquor was added to a 96 well-microtiter plate, with 200 μL/well, and the microtiter plate was placed in a sealed bag filled with nitrogen, and polymerised at 37°C for 24 h.
Figure 2. Schematic diagram of synthesis strategy for semicarbazide MIP artificial antibody on the well surface of microtiter plate.
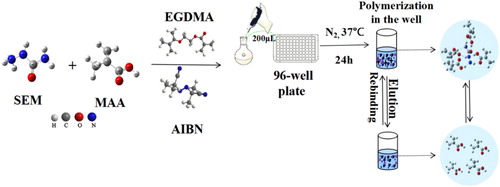
After polymerisation, the microtiter plate contents were eluted by ultrasound in methanol-acetic acid eluent (9:1, v/v), and the eluent was changed every 2 h until it no longer contained SEM (12 h). Then the microtiter plate was washed in methanol solution for 2 h to remove acetic acid and dried at 37°C for 2 h. As a control, the preparation of NIP (non-molecularly imprinted polymer) was the same as that of MIP except without SEM.
Characterisation of MIP film
The surface morphology of MIP and NIP was observed by scanning electron microscopy to compare the differences between them, the procedures for scanning electron microscopy were as follows: the sample (100 μg) was fixed on the cylindrical support with conductive tape, followed by vacuum gold spraying under the acceleration voltage of 10 kV. The samples were sputter-coated with gold for 30 s at 10 mA prior to the observation. The observation time should be as short as possible to avoid electron damage caused by long-term electron beam irradiation.
SEM standard solutions (200 μL) at different concentrations (10–100 mg/L) were added into each well of the prepared MIP microtiter plate. The plate was shaken at 500 rpm on an oribital shaker for 1 h at 25°C. The concentrations of SEM were determined by HPLC-MS/MS. According to the changes in SEM concentration before and after adsorption, the adsorption capacity of MIPs to SEM was calculated. As a control, the processing of NIP was the same as for MIP.
SEM solution (20 mg/L) was added to the MIP microtiter plate well with 200 μL/well. The microtiter plate was placed on an orbital shaker at 25°C and shaken (500 rpm) for different times (5, 10, 20, 30, 40, 50, 60, 80, and 100 min) at 25°C. At different times, the content of non-adsorbed SEM in the solution was determined. The adsorption capacity of MIP was calculated and generated an adsorption kinetics curve.
Adsorption capacity (Q) was calculated according to Equation (2):(2)
(2) In the formula, Q (μg/well) represents the adsorption capacity, C0 (μg/mL) represents the initial concentration of SEM, C (μg/mL) represents the concentration of SEM in the supernatant after adsorption, and V (mL) represents the volume of standard solution added to each well.
Preparation of enzyme-labelled antigen
A total of 5 mg HRP was dissolved in 1 mL deionised water and then 0.2 mL of 0.1 M NaIO4 was added. The mixture was stirred at 37°C for 20 min, dripped with 0.2 mL ethylene glycol and stirred for 30 min. After dialysis against 1 M sodium acetate buffer at 4°C overnight, 2 mL of 5 mg/mL SEM solution was added and the pH was adjusted to 9.5. The mixture was then stirred for 1 h in the dark, 0.1 mL of 4 mg/mL NaBH4 was added, left at 4°C for 2 h, and dialysed against 0.1 M PBS buffer (pH = 7.4) for three days. An equal volume of glycerol was added, and then the preparation was stored at −20°C. The prepared enzyme-labeled antigen concentration was 5 mg/mL.
Development of BELISA
The stock solution of SEM at 1 g/L was first diluted to different concentrations (10,000, 1000, 100, 10, and 1 ng/mL). These SEM standard solutions were added to the MIP microtiter plate (100 μL/well), and the SEM-HRP solution at a 1:800 dilution ratio (100 μL per well) was added to the same well. The control and blank wells were set up at the same time. The control well was filled with 100 μL PBST and 100 μL SEM-HRP solution at a 1:800 dilution ratio, while the blank well was filled with 200 μL PBST. The microtiter plate was put on a scrolling mixer for 2 min and incubated at 37°C for 1 h. Then, the solution in the microtiter plate was discarded, the plate was washed with PBST every 3 min five times, and patted on a clean filter paper for drying.
The prepared substrate solution (150 μL) was added to each well and incubated at 37°C for 30 min. The solution in each well was then transferred to the corresponding well of a new microtiter plate, and the reaction was terminated by adding 50 μL of 1.25 M H2SO4 solution per well. Then, the OD value was determined using a Multiskan Spectrum microplate spectrophotometer at 450 nm. With the concentration of SEM as the abscissa (x), the inhibition rate of corresponding concentrations was calculated according to the formula, and the inhibition concentration curve was drawn with the concentration as the ordinate (y). The inhibitory concentration was calculated according to Equation (3):(3)
(3) The MIP microtiter plate was put into methanol-acetic acid eluent (9:1, v/v) for 4 h, which was changed three times, then washed with pure methanol for 1 h, and dried for 2 h at 37°C, after which it could be reused next time.
Sample preparation and method validation
Approximately 2 g of the investigated sample (beef, pork, and shirmp) was homogenised using a high-speed food blender. After that, the homogenised sample was packed into a 50 mL centrifuge tube and spiked with SEM solution at three levels of 1, 10 and 20 μg/kg, then 7.5 mL deionised water and 0.5 mL 1 M hydrochloric acid were added. This mixture was then vortex-mixed thoroughly for 30 s. The pH was adjusted to 7.5. After vortex-mixing for 5 min, 10 mL of ethyl acetate was added. The mixture was left at 25°C for 20 min. Afterwards, the sample was centrifuged at 2400 g for 10 min at 25°C. The ethyl acetate layer was collected and dried under a nitrogen stream at 40°C. The residue was reconstituted with 2 mL methanol-PBS solution (1:1, v/v), and centrifuged at 2400 g for 10 min. The lower layer was collected for the following BELISA analysis.
The accuracy and applicability of the BELISA method was evaluated by recovery testing through a standard addition method of SEM involving real samples. Moreover, we used conventional ELISA and HPLC-MS/MS methods for SEM analysis of the real food samples and compared the results with established methods. Additionally, HPLC-MS/MS was used as a reference method (Yu, Liu, Tian, Li, & Wang, Citation2018).
Statistical analysis
All of the experiments were performed at least in triplicates. Each value is presented as mean ± standard deviation (SD). The statistical analyses of the data were conducted using the SPSS software package (Statistical Package for the Social Sciences, version 19, SPSS Inc., Chicago, IL, USA). Results were subjected to analysis of variance (ANOVA). Significance was set at p < 0.05.
Results and discussion
Computational modelling
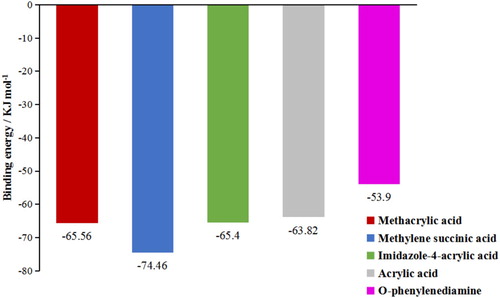
The use of computational simulation as an analytical tool was very important for selection of the monomers used in MIP synthesis. The interaction of each monomer with the template (SEM) was based on structural and functional affinity. No evaluation was made of physicochemical parameters or interaction of the template with the monomer at the molecular or electronic level. The energy released on approach between each monomer and the template (SEM) is shown in . Higher energy release (indicated by values that are more negative) was indicative of greater selectivity of the MIP, with increased affinity between the monomer and the template (Tang et al., Citation2018). shows that the methylene succinic acid and MAA monomers presented better binding energies. Hence, from the 5 monomers analysed in computational simulations, the monomers of methylene succinic acid and MAA with high binding energies were selected for further comparison.
Figure 3. Binding energies between different functional monomers and SEM.
To further optimise the experimental model, the binding energies (ΔE) of the complexes formed between SEM and each functional monomer (methylene succinic acid and MAA) under different molar ratios were calculated and are listed in . The results showed that ΔE values of the complexes were all low when the ratio of SEM to each functional monomer was 1:1, and it was easy to induce self-polymerisation of functional monomers at this ratio, affecting the formation of specific recognition sites. Therefore, it was necessary to increase the proportion of template molecules in the system. As shown in the , ΔE values increased significantly when the proportion of functional monomers was increased, and the values of ΔESEM-MAA were greater than ΔESEM-methylene succinic acid when the ratio of SEM to each functional monomer was 1:2, 1:3, and 1:4. The values of ΔESEM-MAA were maximal at a ratio of 1:4, and the average distance and average angles were 1.91 and 161.4°, respectively. This indicated that MAA interactions with SEM were stronger at this ratio, so the complex of SEM-MAA (1:4) was chosen in the following experiments. We suggested that SEM with MAA at the molar ratio of 1:4 contained the most effective sites, which allowed the templates in and out easily. The molecular structure diagrams formed between SEM and MAA under different molar ratios are shown in . Molecular structure diagrams formed between SEM and methylene succinic acid under different molar ratios are shown in Figure S1.
Figure 4. Molecular structure diagrams formed between SEM and MAA interacting under different molar ratios: (a) 1:1, (b) 1:2, (c) 1:3, (d) 1:4.
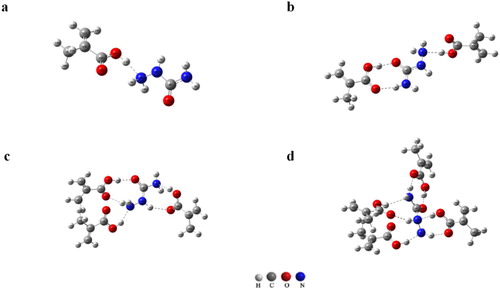
Table 1. The binding energies of the complexes formed between SEM and each functional monomer under different molar ratios.
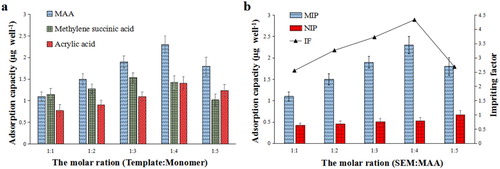
To verify the model’s inference, the adsorption capacities of the MIP for SEM and different functional monomers, under different molar ratios of SEM to functional monomer, were investigated. The results showed that an homogeneous coating was not possible when imidazole-4-acrylic acid or o-phenylenediamine were chosen as the functional monomer. Acrylic acid, MAA, and methylene succinic acid were able to form polymer films on the enzyme label plate. Therefore, the adsorption capacity and imprinting factor (IF, α) of the MIP films formed by the above three functional monomers were compared in this study. The adsorption capacity and IF of MIP was greatest when MAA was used as the functional monomer and the molar ratio of SEM to MAA was 1:4 (). It can be seen that the experimental results were in agreement with the results calculated by DFT.
Figure 5 . (a) Adsorption capacity of MIP formed by different functional monomers, (b) Adsorption capacity and imprinting factor of MIP formed by SEM and MAA at different molar ratios.
Spectroscopic analysis
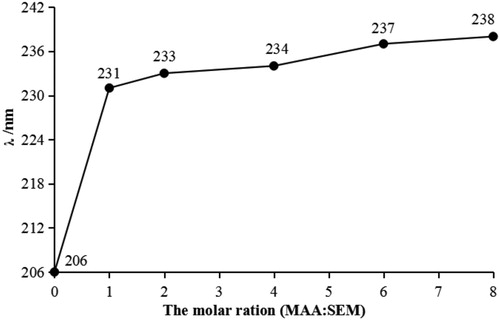
shows the wavelength shift revealed by ultraviolet scanning after the interaction between SEM and MAA. It can be seen from the graph that after the interaction between SEM and MAA, the ultraviolet absorption wavelength became redshifted, with increased ratios of functional monomer to template molecules, and this shift tended to be gradual. This showed that functional monomer and template molecules underwent interaction forces; it might be speculated that the force between the SEM and functional monomer MAA was hydrogen bonding. As hydrogen bonds were formed, the maximum absorption wavelength was redshifted, which is consistent with the results of DFT simulations.
Figure 6. The maximum absorption wavelength of MAA and SEM mixed solutions at different molar ratios.
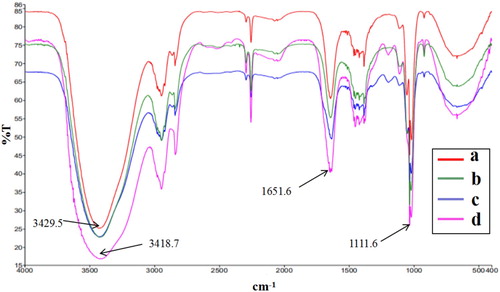
The results of FT-IR analysis were shown in . The FT-IR spectrum of acetonitrile/methanol ((b)) was used as a control to remove the influence of solvent. As can be seen from (a,d), the N–H stretching vibration peak shifted from 3429.6 cm−1 (SEM solution) to 3418.7 cm−1 (SEM and MAA mixed solution). The peak of 3418.7 cm−1 was not observed in the MAA solution ((c)). Thus, we speculated that this shift was caused by the interaction between the H atom of N–H and O atom of O–H (Yin, Zhong, Jiang, & Luo, Citation2010). Additionally, N–H bending and C–N were observed at 1651.6 and 1111.6 cm−1, respectively. These results demonstrate that strong intermolecular hydrogen bond binding force was generated between SEM and MAA molecules. This finding is in agreement with the UV results and also confirms the molecular simulation results.
Figure 7. FTIR spectra of SEM solutions in acetonitrile/methanol (a), MAA solutions in acetonitrile/methanol (b), acetonitrile/methanol (c), and MAA and SEM mixed solutions in acetonitrile/methanol at a molar ratio of 1:4 (d).
Characterisation of MIP film
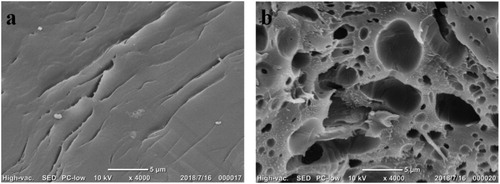
As shown in , scanning electron microscopy images of NIP (left) and MIP (right) showed that MIP had more cavities of different sizes, shapes, and larger surface areas than NIP had, which was more conducive to the adsorption of SEM and enzyme-labelled antigens.
Figure 8. Scanning electron micrograph of MIP and non-MIP surfaces (a: NIP; b: MIP).
To evaluate the binding properties of MIP film to SEM molecules, adsorption isotherm curves of MIP and NIP were established using a series of SEM standard solutions (0–120 mg/L). The results showed that MIP exhibited much higher adsorption capacity than NIP at the same SEM concentrations ((a)). Adsorption capacity increased along with SEM concentration. With the concentration of SEM at 80 mg/L, the adsorption capacity tended to be stable, and NIP showed little change in the SEM standard solution at different concentrations, with an inconspicuous upward trend. A comparison between the adsorption isotherm curves of MIP and NIP showed that there were more SEM-specific recognition sites on MIP film, which could bind to SEM molecules, and thus had better SEM adsorption performance.
Figure 9. Adsorption isotherm of SEM onto MIP and NIP films (a); Scatchard plot analysis of the binding of SEM to MIP and NIP (b); Adsorption kinetics of SEM and MIP films (c).
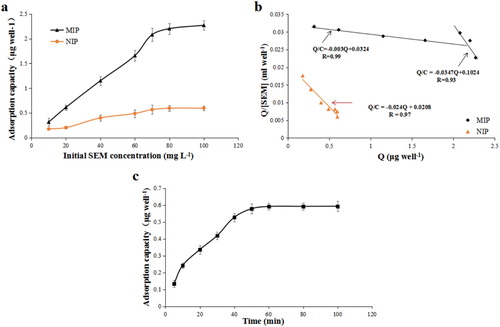
The Scatchard equation could be used to determine the specific adsorption capacity of the synthesised SEM MIP to SEM. The calculation formula is as follows (4):(4)
(4)
Q (μg/well) represents the adsorption capacity of MIPs to SEM, and [SEM] (μg/mL) represents the initial concentration of template molecule SEM. Qmax (μg/well) represents the maximum binding capacity of MIPs, and Kd (μg/mL) represents the dissociation constant.
From (b), we can see that the Scatchard curve for MIP is quite different from that of NIP. The Scatchard equation for MIP was composed of two parts with a intersection and a different slope, which indicated that there were two binding sites with high affinity and low affinity in MIP. The Kd of high affinity sites was 333.33 μg/mL, Qmax was 10.80 μg/well, while the Kd of low affinity sites was 28.81 μg/mL and Qmax was 2.95 μg/well. The Scatchard curve for NIP was composed of a single part, which indicated that the binding sites of NIP were single, low affinity and non-specific. Kd was 41.67 μg/mL and Qmax was 0.86 μg/well. The results of Scatchard curve analysis showed that MIP exhibited better binding properties and adsorption capacity for SEM molecules than non-MIP films.
The adsorption rate of target SEM molecules by MIP reflected the adsorption capacity of prepared MIPs. In this study, a MIP adsorption kinetics curve was generated by measuring the adsorption capacity of MIP for SEM over different adsorption times. As shown in (c), the adsorption capacity of MIP for SEM increased with increasing adsorption time, and the growth rate was higher, the adsorption capacity had plateaued by the first 40 min. 88.9% of the equilibrium adsorption capacity was achieved between 50 and 60 min, and the adsorption capacity did not increase. This indicated that MIPs could reach adsorption equilibrium in a relatively short time, and that the adsorption rate was higher. This strategy was suitable for SEM adsorption detection by MIPs. At the same time, it also showed that there were more binding sites in the MIP, and also that its specific binding ability was greater.
Establishment of BELISA method
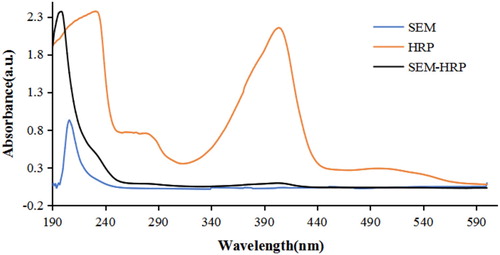
As seen in , the UV–VIS spectra of SEM-HRP showed the characteristic peaks of both SEM and HRP, indicating the successful synthesis of the conjugate. It is important to optimise the concentration of enzyme-labelled antigen for improving the sensitivity of BELISA. In the present study, we compared the performance of different buffer an doptimal solubilising solvent for sample pretreatment, optimised the dilution ratio of enzyme-labeled antigen and the pH of buffer solution. The optimised results were that the optimal dilution ratio of enzyme-labeled antigen was 1:800 (Figure S2), the optimal buffer solution was PBST (Figure S3a), the optimal pH of buffer solution (PBST) was 8 (Figure S3b), and the optimal solubilising solvent for sample pretreatment was 50% Methanol-PBS (Figure S3c). Based on the above optimal detection conditions, a standard curve of SEM BELISA was established (Figure S4). The linear regression equation was y = 8.2657 ln (x) + 13.211 (R2 = 0.9863), and the method exhibited a good linear relationship over the range 1–10,000 ng/mL. The limit of detection (LOD) and half maximal inhibitory concentration (IC50) were 1 and 85.7 ng/mL, respectively (Wang et al., Citation2017). The LOD value met the EU MRPL for SEM in animal tissues, which demonstrated that our newly established method met the requirements for SEM detection in foods.
Figure 10. UV–VIS spectra characterisation of prepared enzyme-labelled antigen.
Compared with other published methods for SEM detection, as shown in , the proposed BELISA method displays a relatively lower detection limit and a broader linear range.
Table 2. Comparison of the BELISA method with other published methods for SEM detection.
To evaluate the specificity of the BELISA method, the mid-plate relative standard deviation (RSD) and inter-plate RSD were tested. As shown in , the average coefficient of variation in the mid-plate was 6.8, and the average coefficient of variation was 7.0 for reuse, which indicated that the BELISA method had good repeatability and specificity and could be applied for the determination of SEM.
Table 3. The mid-plate RSD and inter-plate RSD of BELISA method (n = 6).
Selectivity of the BELISA method
To assess the selectivity of the BELISA method, interference by nitrofurazone (NFZ), 3-amino-5-morpholinomethyl-2-oxazolidinone (AMOZ), urea, 3-amino-2-oxazolidinone (AOZ) and 1-aminohydantoin hydrochloride (AHD) at the same concentration were investigated. The specificity of the method was estimated by the cross reactivity (CR) of SEM and the interfering compound. CR values were calculated according to Equation (5).(5)
(5)
demonstrates that CR between SEM and different interfering agents was <10%. The CR between SEM and urea was the highest, reaching 9.5%, which can plausibly be explained by the high structural similarity between SEM and urea. The CR values for SEM and nitrofurans (AOZ, AMOZ, AHD and NFZ) were <5%. These results suggested that the MIP film prepared in this study had good selectivity for SEM.
Table 4. Selectivity of the BELISA method.
Real sample applications and accuracy of BELISA
To test the utility of the validated method, beef, pork and shrimp were selected for recovery testing through the standard addition method. The SEM was spiked into the selected samples at three levels of 1, 10, and 20 μg/kg. The recovery data are shown in . The average recoveries ranged from 86.1% to 90.8% with relative standard deviations (RSD) < 5%. These results demonstrated that the established BELISA method was applicable for the detection of SEM residue in animal-derived foods.
Table 5. Recoveries of the BELISA method for the determination of spiked SEM in animal-derived food.
Furthermore, the beef, pork and shrimp samples spiked with SEM were also analysed using ELISA and HPLC-MS/MS methods. Compared with ELISA and HPLC-MS/MS methods, BELISA has the advantages of lower cost and shorter detection time. Figure S5 shows the correlation of recovery results determined by the BELISA method with ELISA and HPLC-MS/MS techniques. The correlation coefficient (R2) was greater than 0.99, which indicates that the established BELISA method in this study had an excellent linear relationship with the other two methods and further confirms the reliability and applicability of the BELISA method.1
Conclusions
This study describes a direct competitive ELISA method using an imprinted film as artificial antibody for the determination of SEM abundance in animal-derived food. It is anticipated that the method will be able to provide sufficient sensitivity to accurately measure SEM at levels of 1–10,000 ng/mL. The developed BELISA method was successfully applied to the determination of SEM in beef, pork and shrimp samples. It is likely that with minimal changes this method could be generally applied to the determination of SEM in environmental and food product samples.
Supplemental Material
Download MS Word (347.8 KB)Acknowledgements
The authors are also grateful to Dr Chen and Beijing Hongjian Technology Co., Ltd for the kind cooperation extended in Gaussian calculations.
Disclosure statement
No potential conflict of interest was reported by the authors.
Additional information
Funding
Related Research Data
References
- An, H., Henry, M., Cain, T., Tran, B., Paek, H. C., & Farley, D. (2012). Determination of total nitrofuran metabolites in shrimp muscle using liquid chromatography/tandem mass spectrometry in the atmospheric pressure chemical ionization mode. Journal of AOAC International, 95(4), 1222–1233.
- Casella, I. G., & Contursi, M. (2015). Electrocatalytic oxidation and flow detection analysis of semicarbazide at based IrOx chemically modified electrodes. Sensors & Actuators B Chemical, 209(209), 25–31.
- Chen, L., Cui, H., Dong, Y., Guo, D., He, Y., Li, X., & Zhou, H. (2016). Simultaneous detection of azodicarbonamide and the metabolic product semicarbazide in flour by capillary electrophoresis. Food Analytical Methods, 9(5), 1106–1111.
- Chianella, I., Lotierzo, M., Piletsky, S. A., Tothill, I. E., Chen, B., Karim, K., & Turner, A. P. F. (2002). Rational design of a polymer specific for microcystin-LR using a computational approach. Analytical Chemistry, 74(6), 1288–1293.
- Du, N. N., Chen, M. M., Sheng, L. Q., Chen, S. S., Xu, H. J., Liu, Z. D., … Qiao, R. J. (2014). Determination of nitrofuran metabolites in shrimp by high performance liquid chromatography with fluorescence detection and liquid chromatography – tandem mass spectrometry using a new derivatization reagent. Journal of Chromatography A, 1327, 90–96.
- Du, X., Zhang, F., Zhang, H., Wen, Y., & Saren, T. (2014). Substitution of antibody with molecularly imprinted 96-well plate in chemiluminescence enzyme immunoassay for the determination of chloramphenicol residues. Food and Agricultural Immunology, 25(3), 411–422.
- European Commission. (2010). Commission regulation 37/2010. Official Journal of the European Communities, L15, 1.
- He, B., & Du, G. (2017). Rapid detection of semicarbazide based on glassy carbon electrode modified with carboxylated multi-walled carbon nanotubes. Chinese Journal of Analytical Chemistry, 45(10), 1511–1516.
- Hu, K., Huang, X., Jiang, Y., Fang, W., & Yang, X. (2010). Monoclonal antibody based enzyme-linked immunosorbent assay for the specific detection of ciprofloxacin and enrofloxacin residues in fishery products. Aquaculture, 310(1–2), 1–12.
- Jiang, W., Luo, P., Wang, X., Chen, X., Zhao, Y., Shi, W., … Shen, J. (2012). Development of an enzyme-linked immunosorbent assay for the detection of nitrofurantoin metabolite, 1-amino-hydantoin, in animal tissues. Food Control, 23(1), 1–25.
- Jin, W. J., Yang, G. J., Shao, H. X., & Qin, A. J. (2013). A novel label-free impedimetric immunosensor for detection of semicarbazide residue based on gold nanoparticles-functional chitosan composite membrane. Sensors & Actuators B Chemical, 188(11), 271–279.
- Kong, L., Pan, M., Fang, G., He, X., & Wang, S. (2014). Molecular imprinting based biomimetic sensors and its application in food safety detection. Journal of Chinese Institute of Food Science and Technology, 14(9), 176–182.
- Kriz, D., Ramström, O., & Mosbach, K. (1997). Peer reviewed: Molecular imprinting: New possibilities for sensor technology. Analytical Chemistry, 69(11), 345A–349A.
- Li, J., Liu, J. X., & Wang, J. P. (2009). Multidetermination of four nitrofurans in animal feeds by a sensitive and simple enzyme-linked immunosorbent assay. Journal of Agricultural and Food Chemistry, 57(6), 2181–2185.
- Li, J., Wei, L., & Jiang, J. (2016). Preparation and application of semicarbazide electrochemical sensor based on molecularly imprinting technique. Chinese Journal of Analytical Chemistry, 44(1), 103–109.
- Park, M. S., Kim, K. T., & Kang, J. S. (2017). Development of an analytical method for detecting nitrofurans in bee pollen by liquid chromatography–electrospray ionization tandem mass spectrometry. Journal of Chromatography B, 1046, 172–176.
- Radovnikovic, A., Moloney, M., Byrne, P., & Danaher, M. (2011). Detection of banned nitrofuran metabolites in animal plasma samples using UHPLC–MS/MS. Journal of Chromatography B Analytical Technologies in the Biomedical & Life Sciences, 879(2), 159–166.
- Sarafraz-Yazdi, A., & Razavi, N. (2015). Application of molecularly-imprinted polymers in solid-phase microextraction techniques. TrAC Trends in Analytical Chemistry, 73, 81–90.
- Stadler, R. H., Verzegnassi, L., Seefelder, W., & Racault, L. (2015). Why semicarbazide (sem) is not an appropriate marker for the usage of nitrofurazone on agricultural animals. Food Additives & Contaminants: Part A, 32(11), 1842–1850.
- Sun, T., & Wang, Y. (2011). Calculation of the binding energies of different types of hydrogen bonds using GGA density functional and its long-range, empirical dispersion correctlon method. Acta Physico-Chimica Sinica, 27(11), 2553–2558.
- Sun, Q., Xu, L., Ma, Y., Qiao, X., & Xu, Z. (2014). Study on a biomimetic enzyme-linked immunosorbent assay method for rapid determination of trace acrylamide in French fries and cracker samples. Journal of the Science of Food and Agriculture, 94(1), 102–108.
- Surugiu, I., Ye, L., Yilmaz, E., Dzgoev, A., Danielsson, B., Mosbach, K., & Haupt, K. (2000). An enzyme-linked molecularly imprinted sorbent assay. The Analyst, 125(1), 13–16.
- Tang, Y., Gao, J., Liu, X., Gao, X., Ma, T., Lu, X., & Li, J. (2017). Ultrasensitive detection of clenbuterol by a covalent imprinted polymer as a biomimetic antibody. Food Chemistry, 228, 62–69.
- Tang, T., Wei, F., Wang, X., Ma, Y., Song, Y., Ma, Y., & Hu, Q. (2018). Determination of semicarbazide in fish by molecularly imprinted stir bar sorptive extraction coupled with high performance liquid chromatography. Journal of Chromatography B, 1076, 8–14.
- Tang, Y., Xu, J., Wang, W., Xiang, J., & Yang, H. (2011). A sensitive immunochromatographic assay using colloidal gold–antibody probe for the rapid detection of semicarbazide in meat specimens. European Food Research & Technology, 232(1), 9–16.
- Tian, X., Xu, Y., Gong, X., Han, D., Wang, Z., Zhou, Q., & Xia, C. (2017). Environmental status and early warning value of the pollutant semicarbazide in Jincheng and Sishili Bays, Shandong Peninsula, China. Science of the Total Environment, 576, 868–878.
- Wang, Y., & Chan, W. (2016). Automated in-injector derivatization combined with high-performance liquid chromatography-fluorescence detection for the determination of semicarbazide in fish and bread samples. Journal of Agricultural and Food Chemistry, 64(13), 2802–2808.
- Wang, J., Sang, Y., Liu, W., Liang, N., & Wang, X. (2017). The development of a biomimetic enzyme-linked immunosorbent assay based on the molecular imprinting technique for the detection of enrofloxacin in animal-based food. Analytical Methods, 9(47), 6682–6688.
- Wang, Y., Wong, T. Y., & Chan, W. (2016). Quantitation of the DNA adduct of semicarbazide in organs of semicarbazide-treated rats by isotope-dilution liquid chromatography-tandem mass spectrometry: A comparative study with the RNA adduct. Chemical Research in Toxicology, 29(9), 1560–1564.
- Worachartcheewan, A., Nantasenamat, C., Isarankura-Na-Ayudhya, C., Prachayasittikul, S., & Prachayasittikul, V. (2011). Predicting the free radical scavenging activity of curcumin derivatives. Chemometrics & Intelligent Laboratory Systems, 109(2), 207–216.
- Yin, X., Zhong, X., Jiang, Y., & Luo, Y. (2010). The spectroscopy analysis of intermolecular interaction between the template molecule and functional monomer before polymerization. Spectroscopy and Spectral Analysis, 30(8), 2211–2214.
- Yu, W., Liu, W., Tian, W., Li, X., & Wang, X. (2018). Semicarbazide universality study and its speculated formation pathway. Journal of Food Safety, 39, 1.
- Zhang, C., Cui, H., Han, Y., Yu, F., & Shi, X. (2017). Development of a biomimetic enzyme-linked immunosorbent assay based on molecularly imprinted polymers on paper for the detection of carbaryl. Food Chemistry, 240, 893–897.