
 ?Mathematical formulae have been encoded as MathML and are displayed in this HTML version using MathJax in order to improve their display. Uncheck the box to turn MathJax off. This feature requires Javascript. Click on a formula to zoom.
ABSTRACT
In a previous study, we developed a dihydropteroate synthase (DHPS)-based biosensor for multi-sulfonamides (SAs), which could detect 29 SAs with IC50 values below 100 ng mL−1. The purpose of the present study was to apply the DHPS-based biosensor to different food matrices and evaluate the influence of matrix effects on the performance of the biosensor by using sulfamethazine (SMZ) as a reference analyte. The results show that different sample pretreatment procedures were required for each food sample to ensure the accuracy and precision of the biosensor. The limit of detection (LOD) for SMZ in chicken, pork, egg and honey was 17.82, 20.55, 23.22, and 5.57 μg kg−1, respectively. The recovery values ranged from 47.6% to 135.1%, and the coefficients of variation (CV) were less than 25.6%. Taken together, our findings show that the DHPS-DHPPP biosensor is a suitable screening method for the screening of multi-SAs in different food matrices.
1. Introduction
Sulfonamides (SAs) are a group of synthetic chemotherapeutics with a common p-aminobenzene sulfonamide moiety. SAs are commonly applied in veterinary practice for the treatment of infectious diseases and are utilized as growth-promoting feed additives (Cháfer-Pericás, Maquieira, Puchades, Miralles, & Moreno, Citation2011). According to the latest sales report for veterinary antimicrobial agents in 30 European countries in 2015, SAs (11.8%), along with tetracyclines (32.8%) and penicillins (25.0%), accounted for approximately 70% of the total medicines used in food-producing species (European Medicines Agency, Citation2017). In addition, the consumption of SAs in animal husbandry was estimated to be around 6721.8 tons in the year 2013 in China, accounting for 8.6% of the total usage of 36 frequently used antibiotics in animals (Zhang, Ying, Pan, Liu, & Zhao, Citation2015). However, the widespread use of SAs in animal husbandry, and noncompliance with withdrawal time before slaughter, can result in the presence of these chemical residues in animal-derived foods. A summary of the national veterinary drug residue screening programme of China from 2012 to 2016 showed that SAs residues are 11.5% of total positive animal-origin food samples (Liang et al., Citation2019). The presence of SAs residue in foodstuff is harmful to consumers due to adverse allergic and toxic effects, alteration of intestinal microflora, suppression of enzyme activity, induction of antibiotic resistance, and carcinogenicity (Lienert, Güdel, & Escher, Citation2007; Ola E. Sköld, Citation2017; Wang et al., Citation2013). In order to protect consumers from these risks, the European Union, USA and China have established maximum residue limits (MRLs) for total SAs in edible animal tissues and milk of 100 μg kg−1 (EU, Citation2010; FDA, Citation2018). In China, the determination of five SAs, sulfamethazine (SMZ), sulfadimethoxine (SDM), sulfaquinoxaline (SQX), sulfamonomethoxine (SMM), and sulfamethoxazole (SMX), in meat, eggs, and milk is compulsory (PRC Ministry of Agriculture, Citation2002).
Chromatography and mass spectrometry are the most commonly used analytical methods for the detection of SAs (Chiesa et al., Citation2016; Karageorgou, Manousi, Samanidou, Kabir, & Furton, Citation2016; Summa, Lo Magro, Armentano, & Muscarella, Citation2015). These methods are sensitive and specific but require well-equipped laboratories, high capital expenditures, highly trained personnel, and generally involve time-consuming sample preparation steps. Recently, analytical methods that rely on immunosensors based on antibody–antigen interactions have become popular because of their high sensitivity, simplicity, and cost-effectiveness (Isanga et al., Citation2017; Pastor-Navarro, Maquieira, & Puchades, Citation2009). For SAs with a common substructure, it is critical that the antibody recognizes all of these compounds, with broad specificity and uniform affinity. However, the heterogeneity of the R groups of sulfonamide molecules invariably limits the possibility to raise antibodies with broad specificity; thus, these immunosensors suffer from non-uniform and low affinity (Liang et al., Citation2019).
To overcome this limitation and to achieve the goal of universal SAs detection, the development of alternatives to antibodies, with high affinity and broad specificity, is a tremendously important area of research. Motivated by this meaningful idea, in our previous study, we prepared dihydropteroate synthase (DHPS) from the R6 strain of S. pneumonia and developed the first receptor-based assay for multi-SAs. In the assay, nine SAs and p-aminobenzoic acid (PABA) could be detected at concentrations less than 100 ng mL−1. Twenty-eight SAs were determined, with IC50 values ranging from 426 to 50,000 ng mL−1, which did not meet the requirements of regulatory agencies (Liang et al., Citation2013). We then used a DHPS-DHPPP (6-hydroxymethyl-7, 8-dihydropterin diphosphate) binary complex, in which DHPPP acts as the first substrate for DHPS, to develop a fluorescence polarization assay (FPA). The FPA had uniform affinities for all SAs tested (Wang et al., Citation2015). In our previous study, DHPS-DHPPP was used to develop a direct competitive ELISA-type biosensor for detecting 29 SAs in milk (Liang et al., Citation2019). However, the applicability of these methods for other animal-derived foods–such as eggs, chicken, pork and honey–has not been evaluated. Due to the different matrix conditions, different extraction methods and buffer solutions must be used to detect SAs in chicken, pork, eggs and honey to eliminate the interference components of the matrix and create appropriate antigenic reaction conditions. Thus, it is necessary to explore different extraction methods and buffer solutions for different samples to ensure the sensitivity, specificity, homogeneity and reproducibility of detection (Ahmed et al., Citation2020; Galarini et al., Citation2014). Therefore, we performed a direct competitive ELISA-type biosensor based on the DHPS-DHPPP binary complex for SAs in eggs, chicken, pork, and honey to comprehensively evaluate the applicability of the DHPS-DHPPP binary complex in these complex matrices.
2. Materials and methods
2.1. Chemicals and materials
SMZ, SDM, SQX, SMM, and SMX were obtained from Sigma-Aldrich (St. Louis, MO) or Dr. Ehrenstorfer (Augsburg, Germany). Hapten of SAs, 4-[(4-amino-phenyl) sulfonylamino] benzoic acid (CS) was synthesized previously in our laboratory (Liang et al., Citation2019). The chemical structures of SAs and hapten are shown in Figure S1. DHPS and DHPPP were previously generated in our laboratory (Liang et al., Citation2013; Liang et al., Citation2019; Wang et al., Citation2015). Common solvents and salts were of analytical reagent grade and supplied by Beijing Reagent Corporation (Beijing, People’s Republic of China).
Apparatus. Polystyrene microplates were purchased from Costar Inc. (Costar 2592, Milpitas, CA). The SpectraMax M5 microplate reader (Molecular Devices, Sunnyvale, CA) was used for ELISA. Water was purified using a Milli-Q system from Millipore Inc. (Bedford, MA).
Buffers and Standard Solutions. Phosphate-buffered saline (PBS) consisted of NaCl (145 mM), KCl (2.7 mM), NaH2PO4•2H2O (3.8 mM), and Na2HPO4•12H2O (8.1 mM) at pH 7.4. Phosphate buffer contained Na2HPO4•12H2O (89 mM), KH2PO4•2H2O (8 mM) and MgCl2 (5 mM), pH 7.73. Coating buffer consisted of Tris-HCl (20 mM) and MgCl2 (30 mM) at pH 8.0. Blocking buffer contained skim milk (2%, w/v) in PBS buffer. Washing buffer consisted of PBS and 0.05% Tween-20. Assay buffer consisted of Tris-HCl (20 mM), MgCl2 (5 mM) and DHPPP (0.15%, v/v), pH 8.0. All buffers were made using RO water. Standard solutions were made by diluting a stock solution of each sulfonamide to 0.01, 1.37, 4.11, 12.34, 37.04, 111.11, 333.33, and 1000 ng mL−1 with assay buffer.
2.2. Direct competitive ELISA-type biosensor procedure
The standard biosensor procedure is described in the Electronic Supplementary Material, according to our previous study with some modifications (Liang et al., Citation2019).
2.3. Curve fitting and statistical analysis
The results are expressed in percentages of the maximum absorbance (B/B0) using the following Equation (1):(1)
(1)
The limit of detection (LOD) for SAs was defined as 10% inhibition of the CS-HRP. The sigmoidal curve was used to fit ELISA-type biosensor data by OriginPro 8.0 (OriginLab Corp., Northampton, MA, USA) for the construction of standard curves. The four-parameter logistic equation was used to fit the immunoassay data as follows:(2)
(2) where A is the response at the high asymptote; D is the response at the low asymptote; X is the calibration concentration; C is the concentration corresponding to 50% specific binding (IC50); and B is the slope.
2.4. Cross-reactivity studies
The relative cross-reactivity (CR) of each antibiotic was calculated based on the IC50 values using the following equation:(3)
(3)
2.5. Sample pretreatment method development and optimization
One of the most common challenges of immunosorbent assays for food analysis is matrix interference, which often has a high potential for nonspecific binding to non-target analytes (Sun, Liu, Zhang, & Wang, Citation2009). Chemical substances present in samples or sample extracts – such as solvents, pigments, and other compounds – might affect the binding between DHPS and analyte, leading to reduced sensitivity and reliability of the assay, as well as false-positive results caused by hindered colour development (Krotzky & Zeeh, Citation1995). To study possible matrix interferences, four different matrices – including chicken, pork, eggs and honey – were chosen to evaluate the method. All samples were obtained from the National Veterinary Drug Safety Evaluation Center (Beijing, China) and were kept frozen until use. The detailed optimization procedure of sample pretreatment is provided in the Electronic Supplementary Material.
2.5.1. Chicken and pork
One gram of chicken or pork and 5 mL PBS with 0.1% BSA and 5 mM MgCl2 were thoroughly mixed for 2 min and centrifuged at 10,000 rpm for 15 min at 4°C. The supernatant liquid layer was diluted 5-fold with PBS containing 0.1% BSA and 5 mM MgCl2 for analysis.
2.5.2. Eggs
Yolk and egg white were mixed adequately and stored at −20°C. Samples were thawed prior to experiments. One gram of sample and 3 mL PBS with 5 mM MgCl2 were gently mixed and vortexed for 1 min. Subsequently, the samples were mixed by hand shaking for 11 min and were then centrifuged at 5000 g for 15 min at 4°C. The supernatant liquid layer was diluted nine-fold with PBS containing 5 mM MgCl2 for analysis.
2.5.3. Honey
Three grams of honey were accurately weighed into a 50 mL polypropylene centrifuge tube, and 3 mL of 2 M HCl was added. The sample was vortexed for approximately 30 s, followed by shaking on a shaker at 400 rpm for 30 min. After the addition of 17 mL of distilled water, the sample was centrifuged at 4500 rpm for 10 min and loaded onto an SPE SCX (100 mg/ 3 mL) cartridge, which was previously activated with 5 mL of methanol and equilibrated with 5 mL of 0.5 M HCl. The cartridge was sequentially washed with 3 mL of 0.5 M HCl, 3 mL of n-hexane, and 3 mL of methanol. Finally, SAs were eluted with 4 mL of a mixture of 30% ammonia solution/methanol (30/ 70, v/ v), and the eluate was evaporated under an N2 stream at 56°C. The dry residue was resuspended in 3 mL of assay buffer.
2.5.4. Recovery
For recovery studies, chicken and pork samples were fortified with five analytes – SMZ, SDM, SQX, SMM, and SMX – at 30, 50, and 100 μg kg−1. Egg samples were spiked with a mixture of the five SAs at 45, 90, and 135 μg kg−1. Honey samples were spiked with the five SAs at 5, 10, and 15 μg kg−1. Then, the chicken, pork, egg, and honey samples were pretreated using the method described above. The average absorbance values (B) determined at each concentration by the optimized biosensor were interpolated with a standard curve prepared in assay buffer, with each data point being an average of four replicates for intra-assay and three replicates for inter-assay.
3. Results and discussion
3.1. Optimization of biosensor
The biosensor was carried out according to our previous study, with some modifications (Liang et al., Citation2019). The concentrations of CS-HRP and DHPS were optimized by the chessboard experiment (Table S1), and the results show that the optimal DHPS concentration and CS-HRP dilution were at 6 μg mL−1 and 1/400 dilution, respectively. The B0, Amax, or ODmax (the absorbance value at zero analyte concentration) of the biosensor was approximately 1.5 for the optimized conditions. All the other physicochemical factors of the biosensor were the same as those used in our previous study (Liang et al., Citation2019).
3.2. Sensitivity and cross-reactivity of biosensor
The Agricultural Ministry of China requires monitoring of the sensitivity and cross-reactivity of any assay used in food sample analysis. Thus, the sensitivity and cross-reactivity (CR) of the biosensor, calculated for the five SAs – SMZ, SDM, SQX, SMM, and SMX – were determined under the optimized conditions. Figure S2 shows the typical standard curves of the biosensors for the five SAs, and the five IC50 values were used to calculate the CRs. The results are summarized in Table S2. The IC50 values for SMZ, SDM, SQX, SMM, and SMX were 8.59, 7.80, 6.87, 10.32, and 10.30 ng mL−1, respectively, with CR values ranging from 83.23% to 125.0%. These results are consistent with those of our previous study (Liang et al., Citation2019).
3.3. Sample pretreatment method development and optimization
Matrix interference is one of the most common challenges of immunoassays for food analysis, which could reduce the sensitivity and reliability of the competitive immunoassay and cause false positives by lowering the colour development (Zhang et al., Citation2007). The DHPS-based biosensor also has a high potential for nonspecific binding between non-target analytes and DHPS; thus, it is prone to matrix effects. In the present study, interferences were quantified by comparing a standard curve obtained in assay buffer with a calibration curve generated in the sample matrix. If the two curves could be superimposed, the effect of the matrix was not significant, and the samples could be analysed according to the calibration curve prepared in the assay buffer.
3.3.1. Chicken
One of the critical steps in sample analysis is the selection of the most appropriate SAs extraction method. The SAs extraction method may influence the accuracy and sensitivity of the assay. Therefore, the extraction method was optimized, via assessing various extraction buffers and dilution factors of the food samples, to choose the most appropriate SAs extraction method for chicken samples.
Although an organic solvent was chosen as extraction solvent for SAs from muscle tissues for most of the time, aqueous solutions were more user-friendly than were organic solvents. Therefore, different aqueous solutions were tested for an optimal extraction buffer. SAs in the chicken sample were first extracted with PBS, and then the sample extract was diluted 5, 10, 15, 20, and 25 times. As shown in (A), even if the sample extract was diluted 25 times, the B0 value of the biosensor was still too low (less than 0.6) for detection. Then, Tris-HCl (20 mM, pH 8.0) containing MgCl2 (5 mM) was used as an extraction buffer, and the sample extract was diluted 5, 10, 15, 20, and 25 times. The B0 values for these dilutions were approximately 1.2 ((A)); thus, the sample extract was diluted 10, 15, 20, and 25 times. However, the recoveries were too low (data not shown). (B) shows the standard curves produced in assay buffer and chicken extract after 5-, 10- and 15-fold dilutions with PBS (containing 5 mM MgCl2). Although the IC50 values were similar, the standard curves could not be superimposed, indicating that the matrix effects were not sufficiently reduced by PBS containing 5 mM MgCl2. In order to increase the OD values obtained from the assay buffer and to correct the matrix effect of chicken, 0.2% skimmed milk (W/V) and 0.2% (W/V) casein were then added to the assay buffer. However, as shown in (C), the OD values obtained from assay buffer added with skimmed milk and casein were greatly reduced, compared with that obtained from assay buffer. This suggests that matrix interferences could not be corrected by 0.2% skimmed milk (w/v) or 0.2% (w/v) casein. Finally, the extraction buffer was optimized by adding skimmed milk (0.1% and 0.2%, w/v), NaCl (1% and 3%, w/v), and BSA (0.1% and 0.2%, w/ v) to PBS containing 5 mM MgCl2. (D) shows the comparison of the standard curves produced in chicken muscle extracts extracted by PBS (5 mM Mg2+) containing 0.1% or 0.2% skimmed milk and in assay buffer alone. The two curves were superimposed in the range of IC20 to IC80. Because of the limitation of the storage time for PBS with skim milk, the PBS containing 0.1% or 0.2% skimmed milk was not optimized subsequently. Salt ion is often selected to reduce the OD value in the sample extract and eliminate matrix effects of food samples. Accordingly, 1% and 3% NaCl were added to PBS (containing 5 mM MgCl2) to increase the salt concentration of the extraction buffer. As shown in (E), the OD values obtained from chicken extracts with PBS containing 1% and 3% NaCl were significantly reduced, with atypical S-type standard curves. The results suggest that even at low concentrations, NaCl could dramatically reduce the activity of DHPS. Therefore, this additive was not incorporated into the extraction method. The standard curves produced in chicken extracts extracted with PBS (5 mM MgCl2) containing 0.1% and 0.2% BSA and in assay buffer are depicted in (F). The standard curves prepared in the assay buffer and in 0.1% BSA-containing extract were superimposed in the working range of IC20 to IC80. Moreover, the BSA component is singular and does not affect the analysis of SAs in chicken samples. Thus, PBS (5 mM MgCl2) containing 0.1% BSA was selected as the chicken sample extraction buffer for further optimization. (G) shows the two superimposed curves, indicating the matrix effects were eliminated by a five-fold dilution with PBS (5 mM MgCl2) containing 0.1% BSA. The LOD value for SMZ in the chicken sample was 17.82 μg kg−1.
Figure 1. (A) Comparison of ODmax using PBS and Tris-HCl containing 5 mM MgCl2 as extraction buffers for chicken. (B) Matrix effect of chicken with different dilution ratios using PBS containing 5 mM MgCl2 as an extraction buffer. (C) Matrix effect of chicken using Tris-HCl containing 0.2% milk and 0.2% casein as extraction buffers. (D) Matrix effect of chicken extracts with different concentrations of skim milk. (E) Matrix effect of chicken extracts with different concentrations of NaCl. (F) Matrix effect of chicken extracts with different concentrations of BSA. (G) Standard curves of SMZ in chicken after 1/5 dilution in PBS containing 5 mM MgCl2 and 0.1% BSA. (H) Comparison of different extraction methods for chicken in terms of ODmax and IC50 values.
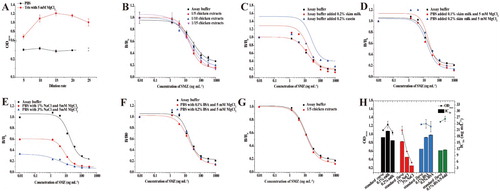
In addition, the different extraction methods were systematically compared in terms of ODmax and IC50 values in this study. As shown in (H), the ODmax and IC50 values obtained from standard curves produced in assay buffer and extracts containing NaCl were significantly different. However, there was little difference between the data obtained from the standard curves prepared in assay buffer and extracts containing skim milk and BSA. When the sample extract was diluted five-fold with PBS containing 5 mM MgCl2 and 0.1% BSA, the OD and IC50 values were in good agreement with those from the assay buffer. Therefore, recovery studies were carried out using this extraction method. As summarized in , the mean recovery values of SMZ, SDM, SQX, SMM, and SMX at 30, 50, and 100 ng mL−1 ranged from 60.3% to 107.3%, with CVs below 19.5%.
Table 1. Recovery studies from chicken, pork, eggs and honey with five SAs at three levels by DHPS-based biosensor.
3.3.2. Pork
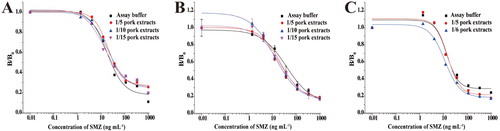
Initially, PBS containing 5 mM MgCl2 was selected as an extraction buffer for pork samples; however, the matrix effects were not eliminated at the 5-, 10-, and 15-fold dilutions. Moreover, the B/B0 values were comparatively high, suggesting that a lower inhibition rate was obtained even at the highest SMZ concentration ((A)). Considering the high-fat content of pork samples, the samples were frozen at −20°C to remove fat. (B) shows the standard curves prepared in pork sample extracts (fat removed) after 5-, 10-, and 15-fold dilutions with PBS containing 5 mM MgCl2 and those obtained from assay buffer. The curves could not be superimposed. These results indicate that PBS containing 5 mM MgCl2 was not suitable as the extraction buffer for pork. The effect of adding 0.1% BSA to PBS (containing 5 mM MgCl2) was also examined, and there was an obvious improvement with this addition. The supernatant liquid layer was diluted 1:5 with PBS containing 5 mM MgCl2 and 0.1% BSA, and this procedure did sufficiently reduce the matrix effects, allowing for the detection of SAs in pork samples ((C)). The LOD value for SMZ in pork samples was 20.55 μg kg−1.
Figure 2. (A) Matrix effect of pork with different dilution ratios, using PBS containing 5 mM MgCl2 as an extraction buffer. (B) Matrix effect of pork (fat removed), with different dilution ratios using PBS containing 5 mM MgCl2 as an extraction buffer. (C) Matrix effect of pork with different dilution ratios of PBS containing 5 mM MgCl2 and 0.1% BSA.
The results of recovery studies and CVs are summarized in . Using the developed method, recoveries for SMZ, SDM, SQX, SMM, and SMX were between 60.8% and 110.5%. In addition, the CVs between analyses remained below 19.8%.
3.3.3. Eggs
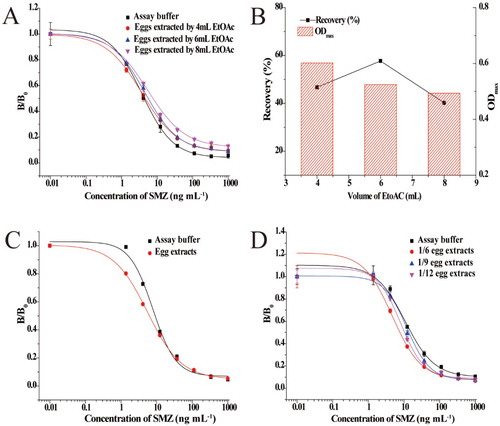
Because of the abundant protein in eggs, different volumes of ethyl acetate were initially selected to precipitate proteins and remove them from the sample. After removal of the ethyl acetate under N2 stream, the extracts were dissolved in assay buffer prior to analysis. As shown in (A), the standard curves generated in egg extracts and in assay buffer could not be superimposed, indicating that this procedure did not sufficiently reduce the matrix effects. The effects of different volumes of ethyl acetate on the recoveries and B0 values are shown in (B). The recoveries for SMZ extracted by different volumes of ethyl acetate ranged from 40% to 60%, suggesting that slight differences in ethyl acetate volume did not severely affect the recoveries. However, a clear decrease in B0 values was observed when the volume of the ethyl acetate increased. A mixed solvent (4 mL ethyl acetate and 2 mL acetonitrile) was also investigated for extraction. As shown in (C), standard curves prepared in assay buffer were not superimposable with those obtained from egg extracts in the mixed solvent. It can be seen that the matrix effect could not be ignored by the mixed solvent. The above results indicate that although the ethyl acetate or acetonitrile could precipitate protein in eggs, they also affected the performance of the biosensor. Therefore, we selected PBS containing 5 mM MgCl2 as an extraction buffer. (D) showed the standard curves of SMZ in egg sample extracts after 6-, 9-, and 12-fold dilutions with PBS containing 5 mM MgCl2, as well as in assay buffer. The standard curve prepared in assay buffer was almost superimposable with that produced in extracts of egg samples diluted nine-fold with PBS containing 5 mM MgCl2. The LOD value for SMZ in egg samples was 23.22 μg kg−1.
Figure 3. (A) Matrix effect of egg samples using different volumes EtoAC as an extraction buffer. (B) The effect of EtoAC concentration on recovery and ODmax values. (C) Matrix effect of egg samples using mixed solvent (4 mL ethyl acetate and 2 mL acetonitrile) as an extraction buffer. (D) Matrix effect of egg samples with different dilution ratios of PBS containing 5 mM MgCl2 and 0.1% BSA as extraction buffer.
Egg samples were spiked with SMZ, SDM, SQX, SMM, and SMX at 45, 90, and 135 ng mL−1, and the recoveries of each analyte were determined. Recoveries and CV (%) are provided in . Recoveries for the five SAs in spiked egg samples were in the range of 83.0–128.6%, which is within an acceptable analysis range. In addition, the CVs between analyses remained below 22.9%.
3.3.4. Honey
Due to the high sugar content of honey, sugar–sulfonamide conjugates are easily formed through the amino group of the aniline ring of SAs (Valera, Muriano, Pividori, Sánchez-Baeza, & Marco, Citation2013). Therefore, it is important to separate the sugar in honey and SAs during the pretreatment of honey samples. The extraction procedure for honey samples was initially carried out according to a published procedure (CitationBeijing Kwinbon Biotechnology Co.). The standard curves of SMZ in honey sample extracts after one-, two- and three-fold dilutions are shown in (A). The recoveries were not satisfactory to meet regulatory standards. With the aim of developing an optimal extraction procedure for honey samples, the influence of the pH of extraction buffer, extraction times, and the addition of PBS were then examined. Since the SAs are zwitterions, it was necessary to adjust the pH to achieve a neutral charge on the SAs in solution and to maximize the extraction efficiency. Therefore, the pH value of the extraction buffer was optimized to find an optimal pH value, which produced the highest recovery and optimum B0 of approximately 1.0. The highest recovery (35%) was obtained at pH 6.0 for the extract buffer, with a B0 value around 1.0 ((B)). In order to improve the recovery, the extraction times were also optimized. As shown in (C), the recovery slightly increased after two extractions. However, the amount of organic reagent increased with two extractions and more impurities were extracted. Thus, the binding of DHPS to the enzyme-labeled antigen was inhibited, resulting in a decrease in the OD values. Since adding salt to the organic reagent could promote the transfer of SAs from the aqueous phase to the organic phase and increase the recoveries of SAs in honey samples, PBS was added to the extraction buffer. It was hoped that the influence of the organic reagent on the B0 values was reduced by increasing the dilution factors. However, the matrix effects were not eliminated by the extraction method ((D)). The comparison of B0 values and recoveries using different extraction methods are depicted in (E). The highest recovery (60%) was obtained with acetonitrile as the extraction buffer, but the B0 value was the lowest. The highest B0 value was observed when using ethyl acetate; however, the recovery was comparatively lower (about 30%). In addition, adding PBS to the extraction buffer could improve the recovery dramatically. We compared the effects of the above extraction procedure on the performance of DHPS and antibody 4D11 in terms of recovery, and the results are depicted in Figure S3. Recoveries for SMZ in spiked honey samples using 4D11 ranged from 52.8% to 103.1%, with a CV less than 19.4%. However, the recoveries for SMZ in spiked honey samples using DHPS were approximately 20%, which could not meet the requirements of regulatory agencies. The above results indicate the effect of the honey matrix on the performance of 4D11 was less, while the performance of DHPS was seriously influenced.
Figure 4. (A) Matrix effect of honey samples extracted with different dilution ratios. (B) The effect of pH values on the recovery and ODmax values. (C) The effect of extraction times on recovery and ODmax values. (D) Matrix effect of honey samples with PBS added and different dilution ratios. (E) The effect of different extraction solvents on recovery and ODmax values. (F) The standard curves of SMZ in honey sample extract by SCX.
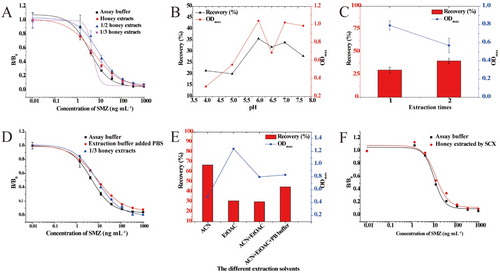
Finally, SAs were eluted from honey samples with a strong cation-exchange column, SCX ion-exchange column. As shown in (F), the standard curves of the sample extracts separated by SCX and the curves produced in assay buffer were almost superimposable, indicating that that the matrix interference was basically eliminated by SCX. The LOD value for SMZ in honey was 5.57 μg kg−1. As shown in , the mean recovery for 5 SAs ranged from 47.60% to 135.1%, with precision values less than 25.6%.
4. Conclusions
In summary, a biosensor based on a DHPS-DHPPP binary complex was used to successfully determined SAs in chicken, pork, eggs, and honey, with concentrations below the level of MRL for the first time. The matrix effects of chicken, pork, egg, and honey samples had significantly different impacts in the assay; thus, different sample pretreatment procedures were required for each food sample to ensure the accuracy and precision of DHPS-based biosensor. SAs were analysed by simple extraction and dilution using PBS containing 5 mM MgCl2 or BSA in PBS containing 5 mM MgCl2 without any concentration or cleanup steps. The only exception was the honey samples, which were pretreated by SCX column. Furthermore, the recoveries and CVs for five SAs – SMZ, SQX, SDM, SMM, and SMX – were also satisfactory, indicating that the optimized biosensor is an acceptable alternative for multi-SAs detection.
Supplemental Material
Download MS Word (551.9 KB)Disclosure statement
No potential conflict of interest was reported by the author(s).
Additional information
Funding
Related Research Data
References
- Ahmed, S., Ning, J., Cheng, G., Maan, M. K., Chen, T., Ahmad, I., et al. (2020). Development and validation of an enzyme-linked receptor assay based on mutant protein I188K/S19C/G24C for 40 beta-lactams antibiotics detection in 13 food samples. Microchemical Journal, 152, 104354. doi: 10.1016/j.microc.2019.104354
- Beijing Kwinbon Biotechnology Co. L ELISA Kit for detection of sulfonamides (seven in one) residues.
- Cháfer-Pericás, C., Maquieira, Á, Puchades, R., Miralles, J., & Moreno, A. (2011). Multiresidue determination of antibiotics in feed and fish samples for food safety evaluation. Comparison of immunoassay vs LC-MS-MS. Food Control, 22, 993–999. doi: 10.1016/j.foodcont.2010.12.008
- Chiesa, L. M., Nobile, M., Panseri, S., Biolatti, B., Cannizzo, F. T., Pavlovic, R., & Arioli, F. (2016). A liquid chromatography–tandem mass spectrometry method for the detection of antimicrobial agents from seven classes in calf milk replacers: Validation and application. Journal of Agricultural and Food Chemistry, 64, 2635–2640. doi: 10.1021/acs.jafc.6b00155
- European Medicines Agency. (2017). Sales of veterinary antimicrobial agents in 30 European countries in 2015, in Seventh European Surveillance of Veterinary Antimicrobial Consumption Report, 2017. Available via the Internet. Retrieved from https://www.ema.europa.eu/en/veterinaryregulatory/overview/antimicrobial-resistance/european-surveillance-veterinary-antimicrobial-consumption-esvac
- European Union. (2010). Commission regulation (EU) No 37/2010 of 22 December 2009 on pharmacologically active substances and their classification regarding maximum residue limits in foodstuffs of animal origin. Official Journal of the European Union, 15, 1–72.
- Food and Drug Administration. (2018). Tolerances for Residues of New Animal Drugs in Food; Title 21: Food and Drugs, Part 556. Code of Federal Regulations; Office of the Federal Register: Washington, DC, USA.
- Galarini, R., Diana, F., Moretti, S., Puppini, B., Saluti, G., & Persic, L. (2014). Development and validation of a new qualitative ELISA screening for multiresidue detection of sulfonamides in food and feed. Food Control, 35, 300–310. doi: 10.1016/j.foodcont.2013.07.014
- Isanga, J., Mukunzi, D., Chen, Y., Suryoprabowo, S., Liu, L., Kuang, H., & Xu, C. (2017). Development of a monoclonal antibody assay and a lateral flow strip test for the detection of paromomycin residues in food matrices. Food and Agricultural Immunology, 28, 355–373. doi: 10.1080/09540105.2016.1272551
- Karageorgou, E., Manousi, N., Samanidou, V., Kabir, A., & Furton, K. G. (2016). Fabric phase sorptive extraction for the fast isolation of sulfonamides residues from raw milk followed by high performance liquid chromatography with ultraviolet detection. Food Chemistry, 196, 428–436. doi: 10.1016/j.foodchem.2015.09.060
- Krotzky, A. J., & Zeeh, B. (1995). Pesticides report 33. Immunoassays for residue analysis of agrochemicals: Proposed guidelines for precision, standardization and quality control (Technical Report) vol 67. doi:10.1351/pac199567122065.
- Liang, X., Li, C., Zhu, J., Song, X., Yu, W., Zhang, J., … Wang, Z. (2019). Dihydropteroate synthase based sensor for screening multi-sulfonamides residue and its comparison with broad-specific antibody based immunoassay by molecular modeling analysis. Analytica Chimica Acta, 1050, 139–145. doi: 10.1016/j.aca.2018.11.005
- Liang, X., Wang, Z., Wang, C., Wen, K., Mi, T., Zhang, J., & Zhang, S. (2013). A proof-of-concept receptor-based assay for sulfonamides. Analytical Biochemistry, 438, 110–116. doi: 10.1016/j.ab.2013.03.028
- Lienert, J., Güdel, K., & Escher, B. I. (2007). Screening method for Ecotoxicological Hazard Assessment of 42 Pharmaceuticals Considering Human Metabolism and Excretory Routes. Environmental Science and Technology, 41, 4471–4478. doi: 10.1021/es0627693
- Pastor-Navarro, N., Maquieira, Á, & Puchades, R. (2009). Review on immunoanalytical determination of tetracycline and sulfonamide residues in edible products. Analytical and Bioanalytical Chemistry, 395, 907–920. doi: 10.1007/s00216-009-2901-y
- PRC Ministry of Agriculture. (2002). Bulletin No 235, Maximum Residue Limits of Veterinary Medicinal Products in Foodstuffs of Animal Origin; Ministry of Agriculture and Rural Affairs: Beijing, China.
- Sköld, O. E. (2017). Sulfonamides and Trimethoprim. In D. L. Mayers (Ed.), Antimicrobial drug resistance (pp. 345–358). New York, NY: Humana Press.
- Summa, S., Lo Magro, S., Armentano, A., & Muscarella, M. (2015). Development and validation of an HPLC/DAD method for the determination of 13 sulphonamides in eggs. Food Chemistry, 187, 477–484. doi: 10.1016/j.foodchem.2015.04.070
- Sun, J.-W., Liu, B., Zhang, Y., & Wang, S. (2009). Development of an enzyme-linked immunosorbent assay for metolcarb residue analysis and investigation of matrix effects from different agricultural products. Analytical and Bioanalytical Chemistry, 394, 2223–2230. doi: 10.1007/s00216-009-2911-9
- Valera, E., Muriano, A., Pividori, I., Sánchez-Baeza, F., & Marco, M. P. (2013). Development of a Coulombimetric immunosensor based on specific antibodies labeled with CdS nanoparticles for sulfonamide antibiotic residues analysis and its application to honey samples. Biosensors and Bioelectronics, 43, 211–217. doi: 10.1016/j.bios.2012.12.017
- Wang, Z., Beier, R. C., Sheng, Y., Zhang, S., Jiang, W., Wang, Z., … Shen, J. (2013). Monoclonal antibodies with group specificity toward sulfonamides: Selection of hapten and antibody selectivity. Analytical and Bioanalytical Chemistry, 405, 4027–4037. doi: 10.1007/s00216-013-6785-5
- Wang, Z., Liang, X., Wen, K., Zhang, S., Li, C., & Shen, J. (2015). A highly sensitive and class-specific fluorescence polarisation assay for sulphonamides based on dihydropteroate synthase. Biosensors and Bioelectronics, 70, 1–4. doi: 10.1016/j.bios.2015.03.016
- Zhang, H., Wang, L., Zhang, Y., Fang, G., Zheng, W., & Wang, S. (2007). Development of an enzyme-linked immunosorbent assay for seven sulfonamide residues and investigation of matrix effects from different food samples. Journal of Agricultural and Food Chemistry, 55, 2079–2084. doi: 10.1021/jf062896i
- Zhang, Q.-Q., Ying, G.-G., Pan, C.-G., Liu, Y.-S., & Zhao, J.-L. (2015). Comprehensive evaluation of antibiotics emission and fate in the river basins of China: Source analysis, multimedia modeling, and linkage to bacterial resistance. Environmental Science and Technology, 49, 6772–6782. doi: 10.1021/acs.est.5b00729