
 ?Mathematical formulae have been encoded as MathML and are displayed in this HTML version using MathJax in order to improve their display. Uncheck the box to turn MathJax off. This feature requires Javascript. Click on a formula to zoom.
ABSTRACT
Lead (Pb) is a toxic metal that can accumulate in the body and negatively impact human health. In this study, we prepared a highly sensitive and specific monoclonal antibody, 2C3, that can recognize Pb(II) with an IC50 and linear range of 0.5 ng/mL and 0.08–1.86 ng/mL, respectively. Additionally, based on this antibody we developed a fluorescent test strip, which can be used for both qualitative and quantitative detection of Pb(II) in brown rice with a detection range of 4.67–47.8 ng/mL. Therefore, the method we developed has high sensitivity suitable for the detection of Pb(II) in brown rice.
Introduction
Lead is very common in nature due to its stability, and it accumulates in ecosystems for its difficulty to degrade. It is mainly found in trace amounts in soil, plants and water, and commonly used in batteries, automobiles, paint, ceramics, plastics, etc. Therefore, it is human activity that causes high dose exposure to lead, and lead enters the food chain of animals or humans by infiltration into groundwater systems (Beyer et al., Citation2013; Lee et al., Citation2019; Mason, Harp, & Han, Citation2014). Long-term consumption of lead-containing foods or water results in lead accumulation in the body (Metryka et al., Citation2018), which causes nervous and regenerative system disorders, stunting, anemia, and hypertension (Flora, Gupta, & Tiwari, Citation2012; Lee et al., Citation2019; Mason et al., Citation2014). Several countries have reported on the hazards of lead exposure (Aksu, Balkis, Taskin, & Ersan, Citation2011; Caravanos et al. ; Sampson & Winter, Citation2016; Yakub & Iqbal, Citation2010), and have set maximum permissible limits. In China, the maximum permissible limit of lead in grains is 0.2 mg/kg.
At present, the detection method of lead is mainly concentrated in ICP (Julshamn et al., Citation2013; Shao et al., Citation2016), electrochemistry method(Liu, Chen, Hou, & Huang, Citation2014; Tan et al., Citation2016; Wei et al., Citation2012), and aptamer-based technologies (Li, Fan, Liang, Liu, & Jiang, Citation2018). While highly sensitive, these methods are costly and time-consuming. Therefore, there is a need for simple, rapid, and inexpensive lead detection methods. The fluorescence immunochromatographic detection technology developed in this study has several advantages of quantitative detection, few false positives, good repeatability, and simple operation (Lin et al., Citation2014; Majdinasab et al., Citation2015; Zhang et al., Citation2015), it has been already developed for the detection of many harmful and toxic substances.(Peng et al., Citation2011; D. Wang et al., Citation2011; Wang, Zhang, Li, Zhang, & Zhang, Citation2016; Zhang et al., Citation2017). In this study, we developed a fluorescent quantitative detection test strip for the detection of lead in brown rice. Compared with existing detection technologies, it does not require expensive large-scale instruments, fast and quantifiable, and easy to implement real-time field testing. Therefore, it is ideal for large-scale screening of agricultural products.
Materials and methods
Materials and instruments
Pb(II), Cr(III), Hg(II), Cd(II), Cu(II), and Mn(II) standards were purchased from the National Institute of Metrology P. R. China (Beijing, China). Isothiocyanobenzyl-EDTA (ITCBE) was obtained from Dojindo Laboratories (Shanghai, China). BSA, KLH, enzyme immunoassay-grade horseradish peroxidase (HRP)-labeled goat anti-mouse immunoglobulin, and Tween-20 were acquired from Sigma Chemical Co. (St. Louis, MO, USA). Cell fusion reagents were supplied by Sunshine Biotechnology Co., Ltd. (Nanjing, China). Other reagents and chemicals were obtained from the National Pharmaceutical Group Chemical Reagent Co., Ltd. (Shanghai, China). Nitrocellulose (NC) membrane was acquired from Sartorius Stedim Biotech GmbH (Goettingen, Germany). Sample pad (glass fibre membrane, GL-b01), polyvinylchloride (PVC) backing card, and absorption pad (SX18) were supplied by GoldBio Tech Co. (Shanghai, China).
Antigen preparation
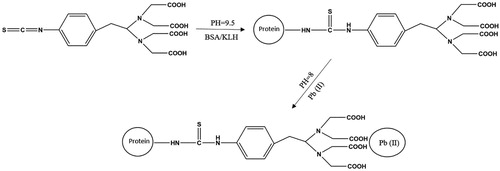
Lead(Pb(II)) is too small to be an antigen epitope and elicit an immune response in mice. Therefore, we selected ITCBE, a structurally complex bifunctional chelating agent, which chelates Pb(II) and binds to the protein carrier BSA or KLH via the thiocyanate group (Blake et al., Citation2001; Kuang et al., Citation2013) (). Briefly, we dissolved 10 mg of ITCBE in 1 mL DMSO and stored the mixture at −20°C. BSA (20 mg) dissolved in 5 mL HBS (0.01 M, pH 9), and added 66 μL ITCBE solution to the BSA solution, mixed at room temperature for 8 h. Subsequently, we added 596 μL (1 mg/mL) Pb(II) dropwise and adjusted the pH to 8.5 using 0.5 M NaOH. After 1 h of reaction, we centrifuged the solution in an Amicon Ultra-4 Ultracel-3 K ultrafiltration centrifuge tube (cut-off value: 3000 Da) at 6500 rpm for 20 min. The suspension was mixed with 3 mL of HBS. The ultrafiltration step was repeated three times, and 10 mL of HBS was added to achieve a final protein concentration of 2 mg/mL. The solution was stored at −20°C. The immunogen Pb-ITCBE-KLH was synthesized by the same method. The antigens were identified by UV and/or gel electrophoresis.
Figure 1. The process of synthesize Pb-ITCBE-KLH and Pb-ITCBE-BSA.
Ic-ELISA
Indirect competitive enzyme-linked immunosorbent assay (ic-ELISA) was slightly different with previously reported (Xu, Liu, Cui, Wu, & Kuang, Citation2019). First, we diluted the antigen Pb-ITCBE-BSA with CB buffer, and added to the microplate(100 μL/well), the microplate was incubated at 37°C for 2 h.then the wells were rinsed, and closed with gelatin for 2 h (200 μL/well), rinsed, and dried. Subsequently, we performed competitive ELISA. First, we added ITCBE (20 μM) diluted standard (50 μL/well) and primary antibody (50 μL/well) to the plate and ITCBE (50 μL/well) andprimary antibody (50 μL/well) to the control well. The plate was incubated for 30 min, rinsed, and added HRP-labeled goat anti-mouse secondary antibody (100 μL/well). Following a 30-min incubation, the plate was rinsed. We added colouring solution for 15 min. Finally, 2 M H2SO4 (50 μL/well) was added to stop the action. Absorbance was measured at 450 nm using a microplate reader. All incubations were performed at 37°C.
MAb preparation
The immunization of mice is a standard method performed in our laboratory (Guo et al., Citation2019; Li, Liu, Song, Kuang, & Xu, Citation2018; Song, Suryoprabowo, Liu, Zheng, & Kuang, Citation2019; Zeng, Liu, Kuang, Cui, & Xu, Citation2019). Briefly, Pb-ITCBE-KLH (immunogen) was mixed with Freund’s adjuvant and administered subcutaneously to female BALB/c mice (6–8 weeks of age) at multiple points. For the first immunization, the immunogen was emulsified with Freund’s complete adjuvant and administered at 100 μg per mouse. For the second boost immunization, the immunogen was emulsified in Freund’s incomplete adjuvant and administered at 50 μg per mouse. After the third immunization, blood samples were collected every other week to analyse serum titres and inhibition. Ic-ELISA was used to screen among the mice. The mouse with the highest serum antibody titre and optimal inhibition was sacrificed, and its spleen cells were fused with tumour cells.
Cell fusion and cell line establishment
Mouse spleen cells and mouse myeloma cells were fused by the polyethylene glycol (PEG 4000) method, and the cells were selected using selective medium (HAT medium) and cultured in HT medium. One week after fusion, positive cells were detected by ic-ELISA, and the inhibitory effect of the positive cells was further confirmed by ic-ELISA. Positive cells with optimum inhibition were subcloned by the limiting dilution method. After one week, the cells were tested and subcloned. After three subclones, hybridoma cell line 2C3, which produced mAbs against Pb(II), was selected.
Heavy metal lead ion antibody purification
Hybridoma cell line 2C3 was cultured and injected into the abdominal cavity of mice to induce ascites formation. The purification process of the antibody is as follows: first, added 1 mL sodium acetate buffer (pH 4) to 1 mL ascites, and bitter acid (33.3 μL) was added to the mixture, which was shaken at room temperature for 30 min and centrifuged at 8000 rpm for 10 min to obtain a supernatant. Subsequently, saturated ammonium sulfate (pH 7; 2 mL) was added in the centrifuge tube and stored at 4°C. Following a 2-h incubation, the mixture was centrifuged at 8000 rpm for 10 min. The resulting precipitate was dissolved in PBS and dialysed for 3 d to obtain mAb 2C3 against Pb(II).
Specificity of mAb
The specificity of mAb 2C3 was assessed by measuring cross-reactivity (CR) with Cr(III), Hg(II), Cd(II), Cu(II), and Mn(II) using ic-ELISA . CR was calculated using the following formula.
Fluorescent microsphere-labelled mAb
We used fluorescent microsphere-labelled antibodies to quantitatively detect Pb(II). First, 120 μL fluorescent microspheres were mixed with boric acid (400 μL, 0.05 M, pH 8) in a 2 mL centrifuge tube. Second, mAbs were labelled with the fluorescent microspheres. Briefly, 20 μL EDC (10 mg EDC dissolve in 1 mL DMF) was activated at room temperature for 15 min and centrifuged at 10,000 rpm at 10°Cfor 10 min. The resulting precipitate was mixed with 0.5 mL boric acid buffer (0.05 M, pH 8) and subjected to ultrasound. MAb 2C3 was added to a final protein concentration of 30 μg/mL and shaken at 250 rpm for 2 h. The solution was blocked with BSA; the final concentration of BSA in the solution was 1%. After centrifugation at 2000 rpm for 10 min, the precipitate was reconstituted with 0.5 mL boric acid buffer. Fluorescent microsphere-labelled mAbs were obtained after ultrasonic dispersion and stored at 4°C.
Preparation of fluorescent microsphere-based test strip
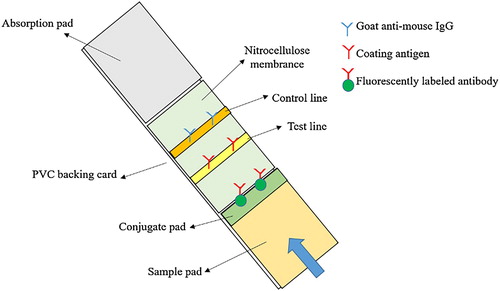
The test strip was slightly modified as previously reported (Ge, Suryoprabowo, Xu, Zheng, & Kuang, Citation2018; L. Guo, Wu, Liu, Kuang, & Xu, Citation2018; Li, Sun, & Chen, Citation2019; Min, Suryoprabowo, Hong, Liu, & Hua, Citation2018). The test strip consists of a PVC backing card, a sample pad, a conjugate pad, an absorption pad, and a nitrocellulose membrane (). Antigen and goat anti-mouse IgG were sprayed on the nitrocellulose membrane uniformly to obtain test line and control line, respectively.
Figure 2. Composition of fluorescent strip.
Sample preparation
First, the brown rice was crushed into the power, and weighed to 50 mL centrifuge tubes (1 g/tube) followed by the addition of different concentrations of Pb(II) (0.1, 0.25, 0.4, 0.5 μg/g). For the extraction process, 4 mL of 0.5 M HCl and 1 mL of 1 M HNO3 were added in the tubes and mixed for 3 min, centrifuged at 8000 rpm for 5 min. An aliquot of the supernatant (500 μL) was mixed with 1 mL n-Hexane, and adjust the lower solution to pH 7 with 0.5M NaOH and make a blank control.
Result and discussion
Characterization of antigen
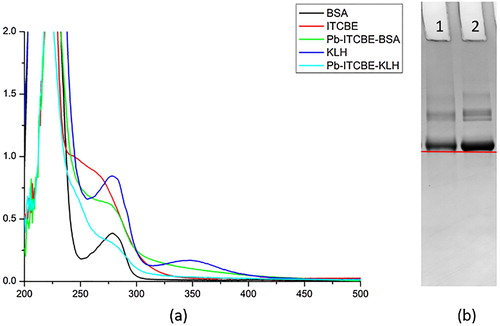
We identified Pb-ITCBE-BSA using both UV and gel electrophoresis, and Pb-ITCBE-KLH using only UV, because KLH cannot be identified by gel electrophoresis. The results are presented in . The peaks corresponding to Pb-ITCBE-BSA and Pb-ITCBE-KLH at 280 nm were broader than those corresponding to BSA and KLH ((a)). In addition, we further identified Pb-ITCBE-BSA by electrophoresis, the band of Pb-ITCBE-BSA lagged behind the band of BSA, which indicated that the antigen was successfully synthesized ((b)). Considering that Pb-ITCBE-KLH was synthesized in the same way as Pb-ITCBE-BSA, Pb-ITCBE-KLH was also successfully synthesized.
Figure 3. (a) The UV–Vis spectra of Pb-ITCBE-BSA and Pb-ITCBE-KLH, (b) The polyacrylamide gel electrophoresis image of Pb-ITCBE-BSA (1 Pb-ITCBE-BSA, 2 BSA).
MAb characterization
We obtained mAb 2C3 after the purification of ascites and used ic-ELISA to evaluate the IC50, linear range, and CR. Based on the standard curve (), IC50 and linear range were 0.5 ng/ml and 0.08–1.86 ng/mL, respectively. Therefore, the mAb 2C3 has good sensitivity. shows the CR values of mAb 2C3 and the structural analogs of Cr(III), Hg(II), Cd(II), Cu(II), and Mn(II). We can see that the CR values are all less than 0.1%, this indicate that there was no cross reactivity with the structural analogs. Therefore, mAb 2C3 has adequate specificity. To sum up, mAb 2C3 has good sensitivity and specificity.
Figure 4. The standard curve of developed ic-ELISA method.
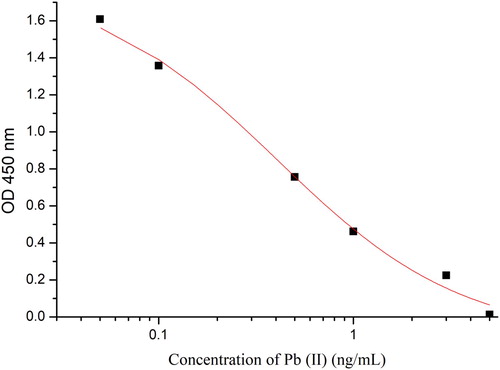
Table 1. The CR value of 2C3 against Pb(II) by the ic-ELISA method.
Detection of pb(II) in HBS
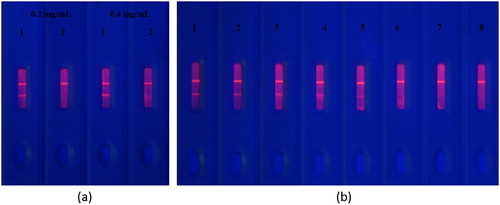
Two kinds of coating concentration (0.2 and 0.4 mg/mL) was optimized ((a)). Pad 1 and Pad 2 added 0 and 100 ng/mL Pb(II) standard, respectively. When the concentration of the standard was 0.2 mg/mL, the T line disappeared completely, indicating that the optimal coating concentration was 0.2 mg/mL. We evaluated the sensitivity of the test strip by diluting different concentrations of Pb(II) (1, 2.5, 5, 10, 25, 50, and 100 ng/mL) with 1 mM ITCBE(0.01 M, pH 7 HBS). (b) shows that as the concentration of Pb(II) increased, the colour of the T line weakened until disappearing completely. At 5 ng/mL Pb(II), the T line weakened. At 25 ng/mL Pb(II), the T line disappeared. Therefore, the detection interval by the naked eye of the test strip was 5–25 ng/mL.
Figure 5. (a) Optimization of two kinds of coating concentration. (0.2 and 0.4 mg/mL, and pad 1 = 0 ng/mL and pad 2 = 100 ng/mL). (b) The sensitivity of the test strip (n = 8). 1 = 0 ng/mL, 2 = 1 ng/mL, 3 = 2.5 ng/mL, 4 = 5 ng/mL, 5 = 10 ng/mL, 6 = 25 ng/mL, 7 = 50 ng/mL, and 8 = 100 ng/mL.
Detection of pb(II) in brown rice
We optimized the coating concentration again, because the matrix of brown rice is complex ((a)). Added Pb(II) standard to the mixture of extraction solution of brown rice and 1 mM ITCBE (0.01 M, pH 7) to a final concentration of 100 ng/mL, Pad 1 and Pad 2 added 0 and 100 ng/mL Pb(II), respectively. (a) shows that at 0.4 mg/mL coating solution, the T line disappeared completely. Therefore, the optimal coating concentration was 0.4 mg/mL. Under this condition, a standard curve in the brown rice sample was developed in the fluorescence reader, as shown in (b), the detection linear range was 4.6–49.67 ng/mL. We tested brown rice samples by ELISA and fluorescence quantification strip (Figur 6(c)), and the result was showed in . The sensitivity of the fluorescent test strip detection interval by the naked eye was 10–50 ng/mL. The test strip measured on the fluorescence reader was 4.67–47.8 ng/mL. Therefore, our test strips can be used for both qualitative and quantitative detection of Pb(II) in brown rice. The data revealed that the fluorescent quantitative test strip method we developed was highly sensitive, which makes the method suitable for screening Pb(II) in large quantities of samples.
Figure 6. (a) The standard curve of fluorescence strip detection Pb(II) in brown rice. (b) Optimization of two kinds of coating concentration in brown rice. (0.2 and 0.4 mg/mL, and pad 1 = 0 ng/mL and pad 2 = 100 ng/mL). (c) The sensitivity of the fluorescence strip in brown rice. (n = 8). 1 = 0 ng/mL, 2 = 10 ng/mL, 3 = 25 ng/mL, 4 = 40 ng/mL, 5 = 50 ng/mL.
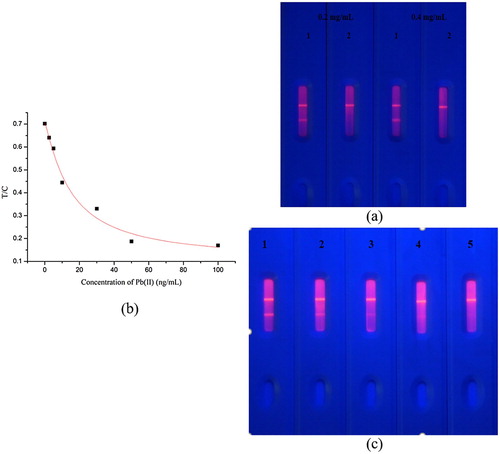
Table 2. The recovery of ELISA and fluorescence quantification strip detection Pb(II) in brown rice (n = 3).
Conclusions
In this study, a highly specific and sensitive monoclonal antibody 2C3 with a linear range of detection of 0.08–1.86 ng/mL by ic-ELISA was obtained. In addition, we developed a fluorescent test strip, which can both qualitative and quantitative detection of Pb(II) in brown rice with a cutoff value of 47.8 ng/mL. Therefore, the fluorescent quantitative test strip is useful for the on-site detection of Pb(II) in multiple samples, which can greatly improve the efficiency of risk assessment and reduce costs.
Disclosure statement
No potential conflict of interest was reported by the author(s).
Additional information
Funding
References
- Aksu, A., Balkis, N., Taskin, O. S., & Ersan, M. S. (2011). Toxic metal (Pb, Cd, As and Hg) and organochlorine residue levels in hake (Merluccius merluccius) from the Marmara Sea, Turkey. Environmental Monitoring and Assessment, 182, 509–521. https://doi.org/10.1007/s10661-011-1893-1
- Beyer, W. N., Franson, J. C., French, J. B., May, T., Rattner, B. A., Shearn-Bochsler, V. I., … Mosby, D. (2013). Toxic exposure of songbirds to lead in the Southeast Missouri Lead Mining District. Archives of Environmental Contamination and Toxicology, 65(3), 598–610. https://doi.org/10.1007/s00244-013-9923-3
- Blake, D. A., Jones, R. M., Blake, R. C., Pavlov, A. R., Darwish, I. A., & Yu, H. (2001). Antibody-based sensors for heavy metal ions. Biosensors and Bioelectronics, 16(9), 799–809. https://doi.org/10.1016/S0956-5663(01)00223-8
- Caravanos, J., Carrelli, J., Dowling, R., Pavilonis, B., Ericson, B., & Fuller, R. Burden of disease resulting from lead exposure at toxic waste sites in Argentina, Mexico and Uruguay. Environmental Health, 15(1), 72. https://doi.org/10.1186/s12940-016-0151-y
- Flora, G., Gupta, D., & Tiwari, A. (2012). Toxicity of lead: A review with recent updates. Interdisciplinary Toxicology, 5(2), 47–58. https://doi.org/10.2478/v10102-012-0009-2
- Ge, W., Suryoprabowo, S., Xu, L., Zheng, Q., & Kuang, H. (2018). Rapid detection of penbutolol in pig urine using an immunochromatographic test strip. Food and Agricultural Immunology, 29(1), 1126–1136. https://doi.org/10.1080/09540105.2018.1520203
- Guo, L., Wu, X., Liu, L., Kuang, H., & Xu, C. (2018). Gold nanoparticle-based paper sensor for simultaneous detection of 11 benzimidazoles by one monoclonal antibody. Small, 14(6), 1701782. https://doi.org/10.1002/smll.201701782
- Guo, M., Wu, X., Song, S., Zheng, Q., Luo, P., Kuang, H., … Ye, L. (2019). Ultrasensitive anti-melamine monoclonal antibody and its use in the development of an immunochromatographic strip. Food and Agricultural Immunology, 30(1), 462–474. https://doi.org/10.1080/09540105.2019.1590318
- Julshamn, K., Maage, A., Norli, H. S., Grobecker, K. H., Jorhem, L., Fecher, P., & Dowell, D. (2013). Determination of arsenic, cadmium, mercury, and lead in foods by pressure digestion and inductively coupled plasma/ mass spectrometry: First action 2013.06. Journal of AOAC International, 96(5), 1101–1102. https://doi.org/10.5740/jaoacint.13-143
- Kuang, H., Xing, C., Hao, C., Liu, L., Wang, L., & Xu, C. (2013). Rapid and highly sensitive detection of lead ions in drinking water based on a strip immunosensor. Sensors (Basel), 13(4), 4214–4224. https://doi.org/10.3390/s130404214
- Lee, J. W., Choi, H., Hwang, U. K., Kang, J. C., Kang, Y. J., Kim, K. I., & Kim, J. H. (2019). Toxic effects of lead exposure on bioaccumulation, oxidative stress, neurotoxicity, and immune responses in fish: A review. Environmental Toxicology and Pharmacology, 68, 101–108. https://doi.org/10.1016/j.etap.2019.03.010
- Li, C., Fan, P., Liang, A., Liu, Q., & Jiang, Z. (2018). Aptamer based determination of Pb(II) by SERS and by exploiting the reduction of HAuCl 4 by H 2 O 2 as catalyzed by graphene oxide nanoribbons. Mikrochimica Acta, 185(3), 177. https://doi.org/10.1007/s00604-018-2714-9
- Li, H., Sun, B., & Chen, T. (2019). Detection of clothianidin residues in cucumber and apple juice using lateral-flow immunochromatographic assay. Food and Agricultural Immunology, 30(1), 1112–1122. https://doi.org/10.1080/09540105.2019.1667309
- Li, Y., Liu, L., Song, S., Kuang, H., & Xu, C. (2018). A rapid and semi-quantitative gold nanoparticles based strip sensor for polymyxin B sulfate residues. Nanomaterials, 8(3), 144. https://doi.org/10.3390/nano8030144
- Lin, G., Huang, H., Liu, T., He, C., Liu, J., Chen, S., … Wu, Y. (2014). A time-resolved fluoroimmunoassay for the quantitation of rabies virus nucleoprotein in the rabies vaccine. Journal of Virological Methods, 206, 89–94. https://doi.org/10.1016/j.jviromet.2014.06.002
- Liu, G., Chen, J., Hou, X., & Huang, W. (2014). A highly-sensitive electrochemical sensor for the simultaneous detection of Cd2+ and Pb2+ using liquid phase-exfoliated graphene. Analytical Methods, 6(15), 5760–5765. https://doi.org/10.1039/C4AY00405A
- Majdinasab, M., Sheikhzeinoddin, M., Soleimanianzad, S., Li, P., Zhang, Q., Li, X., … Li, J. (2015). A reliable and sensitive time-resolved fluorescent immunochromatographic assay (TRFICA) for ochratoxin A in agro-products. Food Control, 47(47), 126–134. https://doi.org/10.1016/j.foodcont.2014.06.044
- Mason, L. H., Harp, J. P., & Han, D. Y. (2014). Pb Neurotoxicity: Neuropsychological effects of lead toxicity. BioMed Research International, 2014, 1–8. https://doi.org/10.1155/2014/840547
- Metryka, E., Chibowska, K., Gutowska, I., Falkowska, A., Kupnicka, P., Barczak, K., … Baranowska-Bosiacka, I. (2018). Lead (Pb) exposure enhances expression of factors associated with inflammation. International journal of molecular sciences, 19(6). https://doi.org/10.3390/ijms19061813
- Min, F., Suryoprabowo, S., Hong, T., Liu, L., & Hua, K. (2018). Rapid detection of clonidine and its cross-reactivity with apraclonidine in pig urine using an immunochromatographic test strip. Food & Agricultural Immunology, 29(1), 1–12. https://doi.org/10.1080/09540105.2017.1341400
- Peng, H., Cheng, Y., Dai, C., King, A. L., Predmore, B. L., Lefer, D. J., & Wang, B. (2011). A fluorescent probe for fast and quantitative detection of hydrogen sulfide in blood. Angewandte Chemie (International ed. in English), 50(41), 9672–9675. https://doi.org/10.1002/anie.201104236
- Sampson, R. J., & Winter, A. S. (2016). The racial ecology of lead poisoning: Toxic inequality in Chicago neighborhoods, 1995–2013. Du Bois Review, 13(2), 261–283. https://doi.org/10.1017/S1742058X16000151
- Shao, Y., Chen, Y., Liu, J., Wu, P., Ying, Y., & Xie, J. (2016). ICP-MS determination of potential toxic elements in soil and rice (Oryza sativa L.) and related health risk. Food Analytical Methods, 9(12), 3501–3508. https://doi.org/10.1007/s12161-016-0536-0
- Song, S., Suryoprabowo, S., Liu, L., Zheng, Q., & Kuang, H. (2019). Development of an immunochromatographic strip test for rapid detection of sodium nifurstyrenate in fish. Food and Agricultural Immunology, 30(1), 236–247. https://doi.org/10.1080/09540105.2019.1571566
- Tan, Y., Qiu, J., Cui, M., Wei, X., Zhao, M., Qiu, B., & Chen, G. (2016). An immobilization free DNAzyme based electrochemical biosensor for lead determination. The Analyst, 141(3), 1121–1126. https://doi.org/10.1039/C5AN02114F
- Wang, D., Zhang, Z., Li, P., Zhang, Q., & Zhang, W. (2016). Time-resolved fluorescent immunochromatography of Aflatoxin B1 in soybean sauce: A rapid and sensitive quantitative analysis. Sensors (Basel), 16(7). https://doi.org/10.3390/s16071094
- Wang, L., Chen, W., Ma, W., Liu, L., Ma, W., Zhao, Y., … Xu, C. (2011). Fluorescent strip sensor for rapid determination of toxins. Chemical Communications, 47(5), 1574–1576. https://doi.org/10.1039/C0CC04032K
- Wei, Y., Gao, C., Meng, F., Li, H., Wang, L., Liu, J., & Huang, X. (2012). Sno2/reduced graphene oxide nanocomposite for the simultaneous electrochemical detection of Cadmium(II), Lead(II), Copper(II), and Mercury(II): An interesting favorable mutual interference. Journal of Physical Chemistry C, 116(1), 1034–1041. https://doi.org/10.1021/jp209805c
- Xu, X., Liu, L., Cui, G., Wu, X., & Kuang, H. (2019). Development of an immunochromatography assay for salinomycin and methyl salinomycin in honey. Food and Agricultural Immunology, 30(1), 995–1006. https://doi.org/10.1080/09540105.2019.1649370
- Yakub, M., & Iqbal, M. P. (2010). Association of blood lead (Pb) and plasma homocysteine: A cross sectional survey in Karachi, Pakistan. Plos One, 5(7). https://doi.org/10.1371/journal.pone.0011706
- Zeng, L., Liu, L., Kuang, H., Cui, G., & Xu, C. (2019). A paper-based colorimetric assay for rapid detection of four macrolides in milk. Materials Chemistry Frontiers, 3(10), 2175–2183. https://doi.org/10.1039/C9QM00429G
- Zhang, J., Na, L., Jiang, Y., Han, D., Lou, D., & Jin, L. (2017). A fluorescence-quenching method for quantitative analysis of Ponceau 4R in beverage. Food Chemistry, 221, 803–808. https://doi.org/10.1016/j.foodchem.2016.11.100
- Zhang, Z., Tang, X., Wang, D., Zhang, Q., Li, P., & Ding, X. (2015). Rapid on-site sensing Aflatoxin B1 in food and feed via a chromatographic time-resolved fluoroimmunoassay. Plos One, 10(4). https://doi.org/10.1371/journal.pone.0123266