
ABSTRACT
Diabetes mellitus is a metabolic disorder disease. Diabetes models can be established using diet and/or chemical agents. However, the effects of these methods on the intestinal microbiota are poorly understood. In this study, C57BL/6 mice were fed with a high-fat or high-sucrose-fat diet (HFD/HSFD), followed by 1 or 2 injections of streptozotocin (STZ) to induce type 2 diabetes mellitus. HFD-fed mice showed more severe dyslipidemia compared to HSFD-fed mice. The abundance of Bacteroidetes decreased in HFD-fed mice compared to HSFD-fed mice. After STZ injection, all the mice developed more severe hyperglycaemia, particularly in HFD-fed mice. Although the compositions of intestinal microbiota between the diet- and STZ-induced mice were similar, STZ injection increased the abundance of Ruminiclostridium and [Eubacterium] oxidoreducens and decreased the abundance of PrevotellaceaeUCG_001. In summary, HFD and HSFD had different metabolic phenotypes and gut microbiota. Diets play a more vital role than STZ injection in reshaping gut microbiota.
Abbreviations
| T2DM | = | type 2 diabetes mellitus |
| T1DM | = | type 1 diabetes mellitus |
| STZ | = | streptozotocin |
| HSD | = | high-sucrose diets |
| HFD | = | high-fat diet |
| HSFD | = | high-sucrose-fat diet |
| HFD_STZ1 | = | the mice fed with HFD combined with a single intraperitoneal injection of STZ |
| HFD_STZ2 | = | the mice fed with HFD combined with twice intraperitoneal injections of STZ |
| HSFD_STZ1 | = | the mice fed with HSFD combined with a single intraperitoneal injection of STZ |
| HSFD_STZ2 | = | the mice fed with HSFD combined with twice intraperitoneal injections of STZ |
| TC | = | total cholesterol |
| TG | = | total triglyceride |
| HDL-C | = | high-density lipoprotein cholesterol |
| LDL-C | = | low-density lipoprotein cholesterol |
| OGTT | = | oral glucose tolerance test |
| AUC | = | total area under the curve |
| HOMA-IR | = | homeostatic model assessment for insulin resistance |
| HE | = | hematoxylin and eosin |
| FBG | = | Fasting blood glucose |
Introduction
Type 2 diabetes mellitus (T2DM) is a chronic metabolic disease with a growing prevalence worldwide. Many scientific studies at the forefront of scientific advancements in drug evaluation used small rodent disease models, especially diabetic mice, to investigate the mechanisms and pharmacological therapies of diabetes (Kleinert et al., Citation2018). Recently, monogenic (Lepob/ob mice, Leprdb/db mice), polygenic (KK mice, NZO mice), diet-induced and chemical-induced models have been widely used (Okon et al., Citation2007; Wang et al., Citation2018). However, monogenic diabetes models do not accurately represent human pathogenesis, considering that diabetes is rarely caused by a monogenic mutation. Polygenic models provide a more accurate picture of the clinical situation of human diabetes, but lack wild-type controls. Diet-induced diabetes is associated with obesity and is more similar to diabetes in human.
Obesity is one of the major risk factors for T2DM, which can induce insulin resistance. Consequently, many current animal models of T2DM are obese (Moura-Assis et al., Citation2018; Sampey et al., Citation2011). Mice are fed with high-calorie foods (such as high fat, sucrose, and fructose) to achieve obesity followed by the development of insulin resistance (Do et al., Citation2018; Hamza et al., Citation2012; Ramos-Romero et al., Citation2018). A high-fat diet (60% energy from fat) is often used to establish obesity and insulin resistance, which is inconsistent with the daily calories of human (30% energy from fat) (Al Zoubi et al., Citation2018; Campbell et al., Citation2019; Vadiveloo et al., Citation2014). Excessive sugar intake also plays a vital role in obesity and metabolic disease (Stanhope, Citation2016). In addition to a high-fat diet, high-fructose, high-glucose and high-sucrose diet (HSD) were used to induce diabetes and obesity in animal models (Tran et al., Citation2009). However, diet-induced diabetes is time-consuming and costly. To further accelerate the deterioration of the disease and shorten the timeframe required to generate the model, a glucosamine-nitrosourea compound (Streptozotocin, STZ), that is selectively toxic to β cells has been used to prepare hyperglycemic animal models (Szkudelski, Citation2001). In the period study, diet combined with a single intraperitoneal injection of STZ at a small dose (100 mg/kg) in mice is used to induce T2DM. Others reported that multiple low-dose injections of STZ also could be used (Zhang et al., Citation2008). Different from a single injection of STZ that induce rapid destruction of β cells, multiple low doses is a gradual, autoimmune destruction (Howarth et al., Citation2005). Obviously, different diets and forms of injection of STZ affect stability of the model. Unfortunately, there are still few studies in-depth regarding these methods to induce stability T2DM mice model.
An altered gut microbiota composition is associated with many chronic diseases including obesity and diabetes (Alam et al., Citation2011; Backhed et al., Citation2007). HFD and HSD cause variations in body conditions, imbalance of the gut microbiota and damage to the gut barrier (Kless et al., Citation2015; Serino et al., Citation2012; Shin et al., Citation2014). Animal studies found that HFD rather than HSD reduces gut microbiota diversity (Magnusson et al., Citation2015). The decrease of Bacteroidetes was observed in HFD-fed mice and HSD-fed mice, and the increase of Firmicutes was only found in HSD-fed mice (Kong et al., Citation2019). Intraperitoneal injection of STZ does not pass into the intestinal tract and can selectively destroy β cells in the pancreatic islets of Langerhans. However, decreases in the Bacteroidetes: Firmicutes (B:F) ratio, and increased proportions of Lactobacillus and Bifidobacterium were observed with time after a single STZ injection (Patterson et al., Citation2015). STZ-injected mice also could alter the composition of gut microbiota at the genera (Bacteroides, Oscillospira, Sutterella, Bifidobacterium genera were increased), and mice treated with broad-spectrum antibiotics were fully protected from STZ-induced type 1 diabetes mellitus (T1DM), indicating that the composition of gut microbiota could be alter by STZ and play a role in STZ-induced T1DM (Costa et al., Citation2016). Although the effect of STZ on intestinal microbiota has been mainly studied in T1DM, there is a lack of systematic research on the differences in pathology and intestinal microbiota between diet-induced and STZ-induced T2DM.
In this study, HFD and HSFD were applied to cause insulin resistance followed by low-dose STZ injection to induce mild dysfunction in insulin secretion. This study aimed to (i) explore the effects of HFD and HSFD on the glycolipid metabolism and composition of intestinal flora, then determine which diet is more suitable for establishing stability T2DM mouse model; (ii) examine the effects of a single and twice injections of STZ on the glycolipid metabolism and composition of intestinal flora, then determine which injection form is more suitable for establishing stability T2DM mouse model; (iii) investigate how the diet might affect STZ capability to induce T2DM.
Materials and methods
Animal treatments
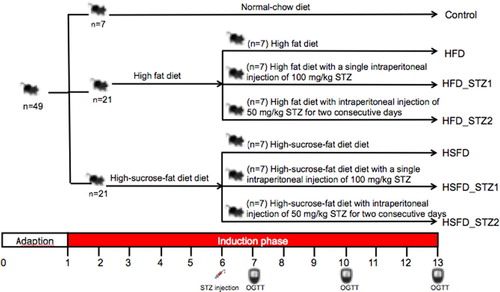
Forty-nine, four-week-old male C57BL/6 mice were purchased from the Vital River Laboratory Animal Technology Co. Ltd. (Beijing, China). Mice were housed at 22 ± 2 °C in a humidity-controlled (55 ± 5%) animal room with a 12-h:12-h light–dark cycle and maintained in groups of no more than 6 mice per cage with free access to food and water. After 1 week of acclimation, according to equal fasting blood glucose, the 49 mice were randomly divided into 7 groups (n=7), and each group was fed with different diets (1) normal-chow diet (Control) containing 10.4% fat, 22.6% protein, 67% carbohydrate, and 14.21 kJ/g; (2) HSFD containing 31.1% fat, 15.6% protein, 53.3% carbohydrate and 16.47 kJ/g; (3) HSFD with a single intraperitoneal (ip) injection of 100 mg/kg STZ dissolved in 0.1 M citrate buffer (pH 4.5) at the 6th week (HSFD_STZ1); (4) HSFD with intraperitoneal injection of 50 mg/kg STZ for two consecutive days at the 6th week (HSFD_STZ1); (5) HFD containing 60% fat, 20% protein, 20% carbohydrate and 21.90 kJ/g; (6) HFD with a single intraperitoneal injection of 100 mg/kg STZ at the 6th week (HFD_STZ1); (7) HFD with an intraperitoneal injection of 50 mg/kg STZ for two consecutive days at the 6th week (HFD_STZ2). Seven groups were marked as control, HFD, HFD_STZ1, HFD_STZ2, HSFD, HSFD_STZ1, HSFD_STZ2, respectively (). During the experiment, the fasting blood glucose level (after 1 week of STZ injection) and body weights of the mice were measured once a week and food consumption was monitored twice a week. All animal experiments in our research were approved by the Animal Experimental Welfare and Ethical Inspection Committee in China Agricultural University (AW01089102-4).
Figure 1. Animals treatment.
Organ weights
After 13 weeks, mice were fasted for 6 h and sacrificed by cervical dislocation. The pancreas, heart, spleen, kidney, liver, epididymal and perirenal fat pads were removed and weighed immediately. Organ weights were normalized to body weights as organ indices: organ index = organ weight/body weight.
Oral glucose tolerance tests
An oral glucose tolerance test (OGTT) was carried out after being fasted for 6 h at 7, 10, 13 week. Blood glucose levels were measured with a glucometer (Ascensia Diabetes care US Inc.) at 0, 30, 60 and 120 min after glucose administration (2 g/kg BW). Insulin levels were measured with enzyme-linked immunosorbent assay kits (Beijing Winter Song Boye Biotechnology Co. Ltd., China) at 13 week. Total area under the curve (AUC) of OGTT and the homeostasis model assessment for insulin resistance (HOMA-IR) (week 13) were calculated as previously described (Lee & Lim, Citation2018).
Lipids analysis
Blood samples were taken from the orbital venous and centrifuged at 3000 × g for 10 min to obtain plasma. The concentrations of plasma and hepatic tissue total triglyceride (TG), total cholesterol (TC), low-density lipoprotein-cholesterol (LDL-C), high-density lipoprotein-cholesterol (HDL-C) were analyzed using commercial assay kits (Nanjing Jiancheng Bioengineering Institute, China). Hepatic tissue was homogenized, lipids were extracted and the concentrations of liver homogenate TG, TC were measured using assay kits.
Histological analysis
The cecum, colon, pancreas, liver and epididymal fat pads were removed from mice, flushed with physiological saline, fixed in 4% formaldehyde, dehydrated and paraffin-embedded. Specimens were sliced (4 μm in thickness) and stained with hematoxylin and eosin. The stained tissues were observed under an optical microscope (NIKON Eclipse ci, Japan). The areas of the pancreas and epididymal fat pads were quantified using Image-pro plus 6.0 (Media Cybernetics, Inc., Rockville, MD, USA).
High throughput 16s rRNA amplicon sequencing
After the mice were sacrificed, their cecum contents were collected. Using the PSP Spin Stool DNA Plus kit (PSP® Spin Stool DNA Plus Kit, STRATEC Biomedical AG, Birkenfeld, Germany), microbial DNA was isolated from fecal samples according to the manufacturer’s instructions. 16S rRNA gene exists in the genome of almost all bacteria, which is highly conserved and specific. High throughput 16S rRNA amplicon sequencing has become a widely used method for analyzing complex microbial communities (Liu et al., Citation2019). In order to assess the effect of diets and STZ on gut microbiota, the composition of the bacterial community was identified based on sequencing the V3-V4 hypervariable region of the 16S rRNA gene. Amplification primers were generated with the following polymerase chain reaction (PCR) primers: Forward, 5′-TCGTCGGCAGCGTCAGATGTGTATAAGAGACAGCCTACGGGNGGCWGCAG-3′; reverse, 5′-GTCTCGTGGGCTCGGAGATGTGTGTAAGAGACAGGACTACHVGGGTATCTAATCC-3′, which were ligated with overhang Illumina adapter consensus sequences. The program of the first PCR: 95 °C for 3 min, followed by 25 cycles consisting of 95 °C for 30 s, 55 °C for 30 s and 72 °C for 30 s, completed with a final extension at 72 °C for 5 min and then holding at 4 °C. The products of first PCR were excised from 1% agarose gel electrophoresis and then purified by using AMPure XP magnetic beads (Beckman Coulter, Brea CA, USA), followed by index PCR. The mixture of each index PCR reaction contained the purified products of 5 µl of both Nextera XT index primer 1 and primer 2, the first PCR experiment (5 µl), and1X KAPA HiFi Hotstart Ready Mix. To incorporate two unique indices to the 16S amplicons, the program of second PCR reactions were performed: 95 °C for 3 min, followed by 8 cycles of 95 °C for 30 s, 55 °C for 30 s and 72 °C for 30 s, followed by a final extension cycle of 72 °C for 5 min. The index PCR products were purified with AMPure XP beads and the final amplicon libraries were approximately 630 bp. After pooling equally with unique indices, the multiplex amplified libraries were denatured with NaOH and then sequenced by Illumina MiSeq (Illumina, San Diego, CA, USA) with 2 × 300 paired-end V3-V4 sequencing reagents.
Data analysis
The differential abundance of phyla and genera could be determined by a Wilcoxon rank-sum test, and P values were corrected for multiple testing with the Benjamin & Hochberg method. R software was used for plotting and statistical analysis. Data were expressed as the mean ± SEM. The statistical significance of different groups was determined by one-way ANOVA followed by post hoc Tukey’s multiple comparison test. A value of P < 0.05 was considered statistically significant. All analyses were performed using SPSS version 14.0 (SPSS Inc., IBM).
Results
Effects of diet and STZ injection on multiple glucose metabolic parameters in mice
To assess the diversity of pathological characteristics and composition of the gut microbiota in mice, 49 mice were fed with HFD or HSFD for 5 weeks and then injected STZ as described in the methods. After 12 weeks, it was found that HFD- and HSFD-fed mice rather than STZ-injected mice showed significant increases in body weight by 33.41% and 26.01%, respectively (P < 0.05, -A) compared to control mice, which indicates the HFD and HSFD consumption-induced obesity. Furthermore, the energy intake of HFD- and HSFD-fed mice was significantly higher than that of control mice (P < 0.05, S-Figure 1), but was significantly decreased after STZ injection. These findings indicated that STZ injection suppressed the appetite of mice.
Figure 2. The association of glucose metabolism with diet and STZ injection. (A) Weight gain; (B) Fasting blood glucose; (C) Hepatic glycogen; (D) AUC of OGTT; (E) HOMA-IR. Data are presented as the mean ± SEM (n=7 mice/group). Different superscript letters are significantly different (P <0.05).
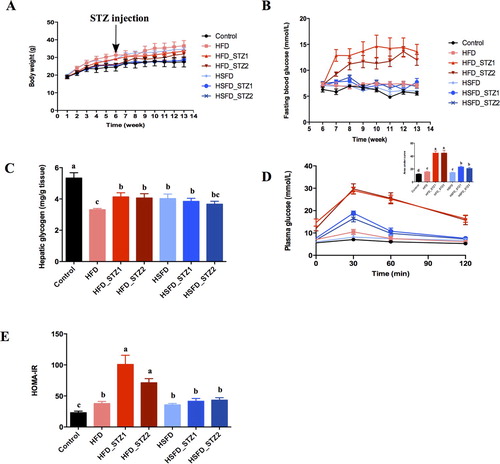
Fasting blood glucose (FBG) (-B), hepatic glycogen (-C) and glucose tolerance tests (-D) were used to examine glucose homeostasis. HFD-fed mice exhibited a significant increase in FBG from the 11th week (-B), which was significantly elevated by 26.41% (compared to control, P < 0.05, Figure2-B) after the 13th week. However, the FBG of HSFD-fed mice were similar to that of control mice. Hepatic glycogen of HFD- and HSFD-fed mice was significantly decreased by 37.79% and 24.51% (-C). From the 7th week, AUC increased in HFD-fed mice (compared to control, P < 0.05, S-Figure 2-A). However, HSFD-fed mice did not show significant changes in AUC until the 13th week (-D, S-Figure 2-A/B). After 12 weeks of HFD and HSFD consumption, HOMAR-IR was significantly increased (-E).
As expected, FBG (-B), AUC (-D) and HOMA-IR (-E) in STZ-injected mice were drastically higher than that of control and HFD-fed mice. FBG of HFD_STZ1 and HFD_STZ2 was 2.20 and 1.58 times higher respectively than that of control and HFD-fed mice after 7 weeks (P < 0.05, S-Figure 2-A) and sustained to 13 weeks (P < 0.05, Figure2-B). Interestingly, significantly higher FBG and AUC levels were observed at the 13th week in HFD_STZ2 than those at the 7th week (P < 0.05, -B and S-Figure 2-A), indicating the further deterioration of glucose intolerance. HSFD_STZ1 and HSFD_STZ2 mice also showed glucose intolerance, whereas their FBG, AUC, and HOMA-IR were lower than HFD_STZ1 and HFD_STZ2 (-B, S-Figure 2, Figure 2-E). These results manifested that HFD-fed mice showed more serious damage in glucose metabolism and higher sensitivity to STZ than HSFD-fed mice.
Effect of diet and STZ injection on multiple lipid metabolic parameters in mice
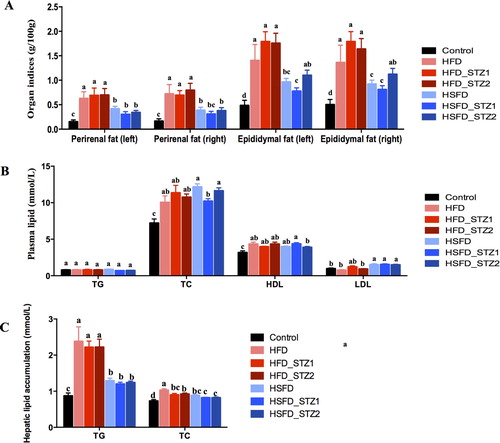
To investigate the effects of diet and STZ on lipid metabolism, we performed fat indices, plasma lipid profiles, and hepatic lipid accumulation analysis (). In comparison to control mice, the indices of perirenal (right/left) and epididymal fat (right/left) in HFD- and HSFD-fed mice were significantly increased, demonstrating that HFD and HSFD consumption could induce obesity (-A). However, the indices of fat accumulation were similar to diet-induced mice in STZ treated mice. Mice had dyslipidemia after 12 weeks of HFD and HSFD consumption, and the concentrations of plasma TC and HDL rather than TG were significantly increased (-B). STZ injection did not affect plasma TC and TG levels in HFD_STZ1 and HFD_STZ2 (compared to HFD), but the concentration of plasma TC in HSFD_STZ1 mice was reduced by 15.91% (compared to HSFD). The level of LDL was increased in HSFD, HSFD_STZ1, and HSFD_STZ2, but there was no significant difference in HFD and HFD with STZ injected mice than those in control mice (-B). Hepatic lipid profile analysis (-C) showed that the TG and TC in HFD- and HSFD-fed mice were significantly higher than those in control mice, indicating that consumption of HFD and HSFD for 12 weeks could induce lipid accumulation in the liver. However, HFD-fed mice showed increased TG and TC concentrations compared to the HSFD-fed mice. Furthermore, STZ injection did not effect lipid accumulation in the liver.
Figure 3. The association of lipid metabolism with diet and STZ injection at 13 week. (A) Indices of perirenal fat and epididymal fat; (B) Plasma lipid; (C) Hepatic lipid accumulation. Data are presented as the mean ± SEM (n=7 mice/group). Different superscript letters are significantly different (P < 0.05).
Impacts of diet and STZ on hepatic steatosis, pancreas apoptosis, adipose tissue hypertrophy, and intestine inflammation
As shown in -A, the liver of HFD-fed mice showed diffuse steatosis of hepatocytes and round vacuoles of different sizes. In comparison, edema degeneration, swelling of the cell body and cytoplasmic loosening were observed in HSFD, HSFD_STZ1, and HSFD_STZ2 mice. Different from HFD-fed mice, HFD_STZ1 and HFD_STZ2 mice exhibited mixed vesicles with fatty degeneration around the central vein. Small focal inflammatory cells infiltration and edema degeneration were also observed.
Figure 4. Hematoxylin and eosin staining of tissue in mice (original magnification, ×200). (A) Liver; (B) Epididymal fat pads; (C) Pancreas; (D) Cecum; (E) Colon. The black arrow pointer indicates fat droplets. The red arrow pointer indicates inflammatory cell infiltration. The blue arrow pointer indicates cytoplasmic loosening.
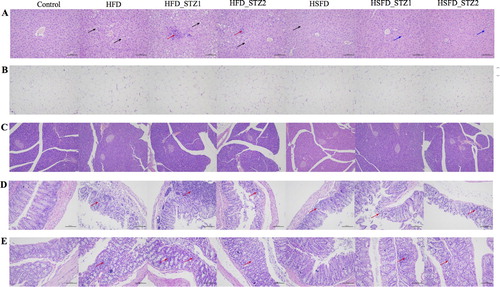
Epididymal adipose tissues of the various groups of mice are shown in -B. The adipose tissue exhibited larger adipocytes in the HFD, HFD_STZ1, HFD_STZ2, and HSFD fed mice, whereas the control group showed normal adipocytes distribution, which was correlated with the indices of epididymal fat. The area of single adipocyte in HFD mice increased by 59.68% compared to control mice (S-Figure 3-A). No inflammatory infiltrates or necrosis was seen in all the mice.
No inflammatory infiltrates or fat accumulation was observed in the pancreas by histopathology analysis. The area of islets decreased in the model groups, especially after STZ injection compared to the control group (S-Figure 3-B). As shown in -D, the intestinal gland of the cecal intestinal tissue was abundant and closely arranged. There was no exfoliation of the epithelial cells in the mucosal layer. After 12 weeks of HFD consumption, the intestinal mucosa structure was destroyed in a large area, and the local intestinal gland structure disappeared. These observations were accompanied by a large number of infiltrated inflammatory cells. Necrosis of the local muscular layer cells and nuclear pyknosis were also observed. However, in the HSFD group, the degree of pathological injury was less severe compared to the HFD group, which showed a low level of small inflammatory cell infiltration, local mucosal epithelial cell exfoliation, partial destruction of the intestinal gland structure, and disappearance of intestinal gland epithelial cells. After STZ injection, HFD_STZ1 and HFD_STZ2 showed similar pathological features with HFD, however, HSFD_STZ1 and HSFD_STZ2 mice indicated the disappearance of intestinal gland structure with more inflammatory cells infiltration compared to HSFD mice.
Similar to cecal pathology, the local mucosal layer structure of the colon intestinal tissue was disorganized (-E). The intestinal gland structure disappeared, and more inflammatory cell infiltration was observed in HFD mice. However, in the HSFD group, no specific abnormalities were observed. With STZ injection in the HFD group, connective tissue hyperplasia and necrosis of mucosal epithelial cells appeared. The colon of the HSFD_STZ1 and HSFD_STZ2 groups exhibited loose intestinal glands, partial intestinal gland destruction, intestinal gland epithelial cell necrosis and small focal inflammatory cell infiltration.
Association of gut microbiota with diet and STZ injection
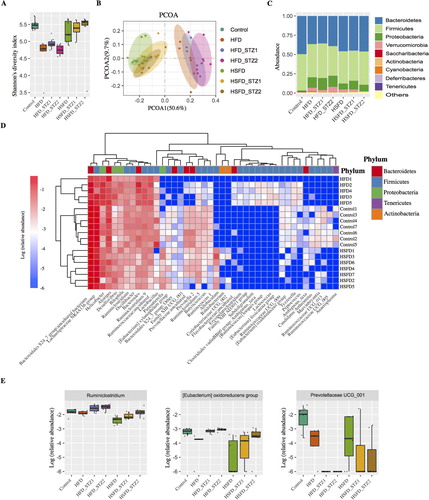
The median Shannon diversity of bacterial communities in each experimental group was calculated and found to be lower in mice fed with HFD (P < 0.01). There were no significant differences between the mice fed with a normal diet and HSFD (P > 0.05). Furthermore, STZ injection had no significant effects on the Shannon diversity of bacterial communities in mice fed with HFD and HSFD (All P > 0.05, -A). Similarly, there were no significant differences in the beta-diversity of gut microbiota composition according to STZ injection except for the HFD_STZ2 group when compared with the HFD group (ADONIS analysis of beta-diversity, P = 0.046). However, a significant correlation between the beta-diversity of microbiota composition and diet (ADONIS P < 0.001, -B) was observed, showing that diet plays a vital role in shaping the mouse gut microbiota. Furthermore, we investigated if the relative abundance of any taxa at various phylogenetic assignment levels differed amongst these groups using the Kruskal–Wallis H test. We observed that the abundance of the Phylum Bacteroidetes was lower (P < 0.01) in the HFD group than in the controls. The abundance of Proteobacteria was higher (both P < 0.01) in the HFD and HSFD groups than in the control group (-C). However, gut microbiota at the phylum level did not discriminate amongst the subgroups of HFD or HFSD according to STZ injection, indicating that STZ injection had limited effects on gut microbiota. At the bacterial genus level, we observed that 42 genera in gut microbiota were associated with diet (adjusted P < 0.05, -D). These included a lower abundance of Ruminococcaceae UCG_005, Ruminococcaceae UCG_013, Ruminococcaceae.UCG_009, and [Eubacterium] oxidoreducens group (which were associated with fiber degradation and short-chain fatty acid (SCFA) production) in the HFD or HSFD groups than the control (all P < 0.01). In contrast, the abundance of Bacteroides was higher in the HFD group than the control (P < 0.01), and the abundance of Bifidobacterium was lower in the HSFD group than the controls (P < 0.05). Although the alpha and beta- diversity analysis of the gut microbiota did not discriminate between subgroups of each diet according to STZ injection, a significant increase in the abundance of Ruminiclostridium and [Eubacterium] oxidoreducens group was observed along with a decrease in PrevotellaceaeUCG_001 after STZ injection (all P < 0.05, -E).
Figure 5. The association of gut microbiota with diet and STZ injection. Alpha-diversity of gut microbiota based on the OTU table, measured by (A) Shannon index and (B) PCoA of Bray-Curtis distances based on the genus level of gut microbiota: each dot represents a sample and each color denotes a group. (C) The relative abundance of each Phylum of gut microbiota in each group. (D) Differentiated genera among the controls, HFD, and HSFD groups and (E) special genera associated with STZ injection.
Discussion
We established diabetic mice models using HFD (60% fat), HSFD (30% fat and 20% sucrose) and the above-mentioned diets supplemented with a small dose STZ injection. In this study, mice fed with HFD and HSFD showed obvious abnormal glycolipid metabolism. HFD-fed mice had more severe impaired glucose tolerance (IGT), fat accumulation and hepatic lipid accumulation than HSFD-fed mice. These data indicated that HFD was more likely to induce obesity and insulin resistance. Similarly, Do et al. (Citation2018) found that HFD-fed mice had higher body weights with more serious IGT and lipid accumulation than high-glucose or high-fructose diet-fed mice. In contrast to their diet design, in our study, the fat content of HSFD was higher than the reported high sugar diet but significantly lower than the HFD, which partially verified our experimental data.
STZ is often used in the preparation of T1DM to destroy a high percentage of the endogenous β-cells, leading to less endogenous insulin and causing hyperglycaemia and weight loss (King, Citation2012). T1DM was induced by intraperitoneal injection of STZ at a high single dose (∼200 mg/kg) or low dose (40-50 mg/kg) for 5–7 days continuously without the process of diet induction. Both of these injections cause severe damage to the pancreas and dramatically reduce insulin level (Cetkovic-Cvrlje et al., Citation2017; Xiang et al., Citation2009; Yau et al., Citation2018). It is controversial to induce T2DM by STZ injection. In our study, unbalanced dietary-induced insulin resistance in mice, and dietary combination with STZ caused more severe disease in mice owing to β cell damage. As expected, the body weight of mice injected with STZ did not significantly decrease. The level of fasting insulin and the number of islets decreased slightly, but these indices were not significantly different from the control group. The observations indicated that low-dose STZ induced mild impairment rather than complete dysfunction in the pancreas, which is a process similar to the natural pathogenic process of T2DM. It is considered that damage to the pancreatic islets caused by single STZ injection was more serious than multiple injections (Zhang et al., Citation2008). However, in our study, when the total injection dose was fixed, there was no significant difference in the effects of single STZ injection and multiple STZ injection on glucose and lipid metabolism in mice. The FBG, AUC, and HOMA-IR of HSFD-STZ mice were significantly lower than those of the HFD-STZ mice. These findings may be explained as before STZ injection, the HFD mice showed more severe IGT (S-Figure 2-A) than HSFD mice, which reduced the sensitivity of mice to STZ. Our data suggested that depending on the diet rather than the forms of STZ injection, STZ had differential effects on glucose metabolism.
The gut microbiota was highly associated with obesity and T2DM in humans and mice (Blandino et al., Citation2016). Recently, several studies have highlighted the effects of diet on microbial composition and the intestinal barrier (Arias-Jayo et al., Citation2018). Consistent with previous findings, pathological damage and accumulation of inflammation in the intestine, particularly in the cecum, were observed in HFD- and HSFD-fed mice. However, the corresponding intestinal permeability test was not performed and the extent of damage to the intestinal barrier caused by diet and STZ injection could not be quantified. In our study, HFD and HSFD could unbalance the gut microbiota. HFD reshaped the composition of gut microbiota, decreasing the amounts of Bacteroidetes and increasing the amounts of Proteobacteria. Similarly, the abundance of Proteobacteria increased in the HSFD-fed mice. High level of endotoxemia produced by Proteobacteria could decrease gut permeability and tight junction protein expression results in enhanced plasma LPS concentration (Kirpich et al., Citation2015; Miura et al., Citation2017). LPS elevates the level of pro-inflammatory cytokines, triggers inflammation and ultimately leads to obesity and T2DM (Troy & Kasper, Citation2011). It indicated that HFD and HSFD may induce gut dysbiosis by promoting of Proteobacteria. Bacteroidetes in the intestine of obese patients are usually lower than those in healthy people. Ramos-Romero et al. (Citation2018) reported that fat affected IR and IGT earlier than sucrose, and the abundance of Bacteroidetes was higher in HFD-fed animals but did not appear in HSD-fed animals. These data were consistent with our results (HFD showed more severe IGT). Moreover, the effects of HFD and HSFD on intestinal flora composition were also different at the bacterial genus level. The abundance of Ruminococcaceae UCG_005, Ruminococcaceae UCG_013, and Ruminococcaceae.UCG_009 decreased in HFD or HSFD-fed mice compared to control mice. These bacteria belonged to Ruminococcaceae that were closely related to the degradation of fibers and SCFA production and SCFA produced by intestinal flora is key to rectifying metabolism and immunity (Yan et al., Citation2016). The abundance of Bifidobacterium significantly decreased in HSFD compared with control, which had beneficial effects on metabolic syndrome and inflammation by improving mucosal barrier function and reducing intestinal endotoxin levels in the gut (Cani et al., Citation2007). In contrast, the abundance of Bacteroides was higher in HFD, which was found to be more abundant in patients with T2DM (Wan et al., Citation2019). These results indicated that different diets affect insulin resistance in mice by changing the composition of intestinal flora and differences in the intestinal flora caused by HFD and HSFD may be a factor affecting the effect of STZ.
Several lines of evidence show that STZ can alter gut microbiota composition (Vaarala et al., Citation2008). Patterson et al. (Citation2015) demonstrated that STZ is associated with a shift in the B:F ratio and increased Lactobacillus and Bifidobacterium in T1DM rats. However, in our study α- and β- diversity analysis showed that STZ injection did not change the composition of gut microbiota (compared with diet-induced groups) at this range of FBG. Due to the circulating half-life of STZ only have 15 min, the direct effect of STZ on the composition of gut microbiota is limited. The effect of STZ on gut microbiota was likely the result of disease progression. Thus, it is not possible to clarify possible changes in the gut microbiota when a pancreatic injury is more serious. All the mice were likely to be subject to T2DM rather than T1DM in our study, and very little is understood as to whether a single and double intraperitoneal injection of STZ could have effects on gut microbiota composition compared with diet-induced T2DM. We specifically demonstrated significant enrichment of the Ruminiclostridium and [Eubacterium] oxidoreducens group, and impairment of PrevotellaceaeUCG_001 after STZ injection. PrevotellaceaeUCG_001 is associated with polysaccharide degradation and SCFA formation (Heinritz et al., Citation2016). Recent papers reported that [Eubacterium] oxidoreducens is closely related to the production of butyrate, which can significantly improve insulin sensitivity (Duncan, Citation2002). However, this report is contrary to our results in mice with hyperglycemia after STZ injection. In SCFA processing, several environmental and physiological factors can affect fermentation such as disease progression, physical properties, and diet (Xu et al., Citation2019). Previous reports have shown high concentrations of butyrate detected in the intestine of diabetic and obesity mice (Fernandes et al., Citation2014). Zhao et al. (Citation2018) have found that Ruminiclostridium has a significantly positive relationship with hyperglycemia. However, in athymic nude (nu/nu) mice and sterile mice injected with antibiotics (Costa et al., Citation2016), the effect of STZ disappears. The relationship between gut microbiota and STZ injury to the pancreas should be the focus of further research. Clarifying the role of gut microbiota composition in STZ-induced pancreatic injury is conducive to revealing reasons why different diets have differential effects on STZ-induced T2DM.
We have demonstrated that HFD and HSFD mice had different metabolic phenotypes and gut microbiota. Diet plays a vital role in intestinal microbiota rather than STZ and the type of STZ injection. Therefore, when selecting a method for diabetic modeling, especially in the study of the role of gut microbiota, the choice of diet is more important. Our study aims to show how the diet might affect STZ capability to induce T2DM. Further studies should consider the effects of fat or sucrose effect on metabolism, gut microbiota and efficiency of STZ.
Supplemental Material
Download Zip (431.5 KB)Acknowledgement
Author Contributions: Q.S. and X.H. designed the experiments; R.Y. conducted research; Y.X. and R.Y. analyzed the data; J.H. provided analysis tools; R.Y. and Y.X. wrote the paper; Q.S. had primary responsibility for final content. All authors read and approved the final manuscript.
Disclosure statement
No potential conflict of interest was reported by the author(s).
Additional information
Funding
Related Research Data
References
- Alam, C., Bittoun, E., Bhagwat, D., Valkonen, S., Saari, A., Jaakkola, U., Eerola, E., Huovinen, P., & Hänninen, A. (2011). Effects of a germ-free environment on gut immune regulation and diabetes progression in non-obese diabetic (NOD) mice. Diabetologia, 54 (6), 1398–1406. https://doi.org/10.1007/s00125-011-2097-5
- Al Zoubi, S., Chen, J., Murphy, C., Martin, L., Chiazza, F., Collotta, D., Yaqoob, M. M., Collino, M., & Thiemermann, C. (2018). Linagliptin attenuates the cardiac dysfunction associated with experimental sepsis in mice with pre-existing type 2 diabetes by inhibiting NF-kappaB. Frontiers in Immunology, 9, 2996. https://doi.org/10.3389/fimmu.2018.02996
- Arias-Jayo, N., Abecia, L., Alonso-Saez, L., Ramirez-Garcia, A., Rodriguez, A., & Pardo, M. A. (2018). High-fat diet consumption induces microbiota dysbiosis and intestinal inflammation in Zebrafish. Microbial Ecology, 76 (4), 1089–1101. https://doi.org/10.1007/s00248-018-1198-9
- Backhed, F., Manchester, J. K., Semenkovich, C. F., & Gordon, J. I. (2007). Mechanisms underlying the resistance to diet-induced obesity in germ-free mice. Proceedings of the National Academy of Sciences, 104 (3), 979–984. https://doi.org/10.1073/pnas.0605374104
- Blandino, G., Inturri, R., Lazzara, F., Di Rosa, M., & Malaguarnera, L. (2016). Impact of gut microbiota on diabetes mellitus. Diabetes & Metabolism, 42 (5), 303–315. https://doi.org/10.1016/j.diabet.2016.04.004
- Campbell, C. L., Yu, R., Li, F., Zhou, Q., Chen, D., Qi, C., Yin, Y., & Sun, J. (2019). Modulation of fat metabolism and gut microbiota by resveratrol on high-fat diet-induced obese mice. Diabetes, Metabolic Syndrome and Obesity: Targets and Therapy, 12, 97–107. https://doi.org/10.2147/DMSO.S192228
- Cani, P. D., Neyrinck, A. M., Fava, F., Knauf, C., Burcelin, R. G., Tuohy, K. M., Gibson, G. R., & Delzenne, N. M. (2007). Selective increases of bifidobacteria in gut microflora improve high-fat-diet-induced diabetes in mice through a mechanism associated with endotoxaemia. Diabetologia, 50 (11), 2374–2383. https://doi.org/10.1007/s00125-007-0791-0
- Cetkovic-Cvrlje, M., Thinamany, S., & Bruner, K. A. (2017). Bisphenol A (BPA) aggravates multiple low-dose streptozotocin-induced type 1 diabetes in C57BL/6 mice. Journal of Immunotoxicology, 14 (1), 160–168. https://doi.org/10.1080/1547691X.2017.1334722
- Costa, F. R. C., Françozo, M. C. S., de Oliveira, G. G., Ignacio, A., Castoldi, A., Zamboni, D. S., Ramos, S. G., Câmara, N. O., de Zoete, M. R., Palm, N. W., Flavell, R. A., Silva, J. S., & Carlos, D. (2016). Gut microbiota translocation to the pancreatic lymph nodes triggers NOD2 activation and contributes to T1D onset. Journal of Experimental Medicine, 213 (7), 1223–1239. https://doi.org/10.1084/jem.20150744
- Do, M. H., Lee, E., Oh, M. J., Kim, Y., & Park, H. Y. (2018). High-glucose or -fructose diet cause changes of the gut microbiota and metabolic disorders in mice without body weight change. Nutrients, 10 (6), 761. https://doi.org/10.3390/nu10060761
- Duncan, S. H. (2002). Roseburia intestinalis sp. Nov., a novel saccharolytic, butyrate-producing bacterium from human faeces. International Journal of Systematic and Evolutionary Microbiology, 52 (5), 1615–1620. https://doi.org/10.1099/ijs.0.02143-0
- Fernandes, J., Su, W., Rahat-Rozenbloom, S., Wolever, T. M., & Comelli, E. M. (2014). Adiposity, gut microbiota and faecal short chain fatty acids are linked in adult humans. Nutrition & Diabetes, 4 (6), e121–e121. https://doi.org/10.1038/nutd.2014.23
- Hamza, N., Berke, B., Cheze, C., Le Garrec, R., Umar, A., Agli, A.-N., Lassalle, R., Jové, J., Gin, H., & Moore, N. (2012). Preventive and curative effect of Trigonella foenum-graecum L. Seeds in C57BL/6J models of type 2 diabetes induced by high-fat diet. Journal of Ethnopharmacology, 142 (2), 516–522. https://doi.org/10.1016/j.jep.2012.05.028
- Heinritz, S. N., Weiss, E., Eklund, M., Aumiller, T., Louis, S., Rings, A., Messner, S., Camarinha-Silva, A., Seifert, J., Bischoff, S. C., Mosenthin, R., & Zoetendal, E. G. (2016). Intestinal microbiota and microbial metabolites are changed in a pig model Fed a high-Fat/Low-fiber or a Low-Fat/high-fiber diet. PLoS One, 11 (4), e0154329. https://doi.org/10.1371/journal.pone.0154329
- Howarth, F. C., Qureshi, A., Shahin, A., & Lukic, M. L. (2005). Effects of single high-dose and multiple low-dose streptozotocin on contraction and intracellular Ca2+ in ventricular myocytes from diabetes resistant and susceptible rats. Molecular and Cellular Biochemistry, 269 (1), 103–108. https://doi.org/10.1007/s11010-005-3088-y
- King, A. J. (2012). The use of animal models in diabetes research. British Journal of Pharmacology, 166 (3), 877–894. https://doi.org/10.1111/j.1476-5381.2012.01911.x
- Kirpich, I. A., Marsano, L. S., & McClain, C. J. (2015). Gut-liver axis, nutrition, and non-alcoholic fatty liver disease. Clinical Biochemistry, 48 (13-14), 923–930. https://doi.org/10.1016/j.clinbiochem.2015.06.023
- Kleinert, M., Clemmensen, C., Hofmann, S. M., Moore, M. C., Renner, S., Woods, S. C., Huypens, P., Beckers, J., de Angelis, M. H., Schürmann, A., Bakhti, M., Klingenspor, M., Heiman, M., Cherrington, A. D., Ristow, M., Lickert, H., Wolf, E., Havel, P. J., Müller, T. D., & Tschöp, M. H. (2018). Animal models of obesity and diabetes mellitus. Nature Reviews Endocrinology, 14 (3), 140–162. https://doi.org/10.1038/nrendo.2017.161
- Kless, C., Müller, V. M., Schüppel, V. L., Lichtenegger, M., Rychlik, M., Daniel, H., Klingenspor, M., & Haller, D. (2015). Diet-induced obesity causes metabolic impairment independent of alterations in gut barrier integrity. Molecular Nutrition & Food Research, 59 (5), 968–978. https://doi.org/10.1002/mnfr.201400840
- Kong, C., Gao, R., Yan, X., Huang, L., & Qin, H. (2019). Probiotics improve gut microbiota dysbiosis in obese mice fed a high-fat or high-sucrose diet. Nutrition, 60, 175–184. https://doi.org/10.1016/j.nut.2018.10.002
- Lee, H., & Lim, Y. (2018). Tocotrienol-rich fraction supplementation reduces hyperglycemia-induced skeletal muscle damage through regulation of insulin signaling and oxidative stress in type 2 diabetic mice. The Journal of Nutritional Biochemistry, 57, 77–85. https://doi.org/10.1016/j.jnutbio.2018.03.016
- Liu, X., Zheng, H., Lu, R., Huang, H., Zhu, H., Yin, C., Mo, Y., Wu, J., Liu, X., Deng, M., Li, D., Cheng, B., Wu, F., Liang, Y., Guo, H., Song, H., & Su, Z. (2019). Intervening effects of total alkaloids of corydalis saxicola bunting on rats with antibiotic-induced gut microbiota dysbiosis based on 16S rRNA gene sequencing and untargeted metabolomics analyses. Frontiers in Microbiology, 10, 1151. https://doi.org/10.3389/fmicb.2019.01151
- Magnusson, K. R., Hauck, L., Jeffrey, B. M., Elias, V., Humphrey, A., Nath, R., Perrone, A., & Bermudez, L. E. (2015). Relationships between diet-related changes in the gut microbiome and cognitive flexibility. Neuroscience, 300, 128–140. https://doi.org/10.1016/j.neuroscience.2015.05.016
- Miura, K., Ishioka, M., & Iijima, K. (2017). The roles of the gut microbiota and toll-like receptors in obesity and nonalcoholic fatty liver disease. Journal of Obesity & Metabolic Syndrome, 26 (2), 86–96. https://doi.org/10.7570/jomes.2017.26.2.86
- Moura-Assis, A., Afonso, M. S., de Oliveira, V., Morari, J., dos Santos, G. A., Koike, M., Lottenberg, A. M., Ramos Catharino, R., Velloso, L. A., Sanchez Ramos da Silva, A., de Moura, L. P., Ropelle, E. R., Pauli, J. R., & Cintra, D. E. C. (2018). Flaxseed oil rich in omega-3 protects aorta against inflammation and endoplasmic reticulum stress partially mediated by GPR120 receptor in obese, diabetic and dyslipidemic mice models. The Journal of Nutritional Biochemistry, 53, 9–19. https://doi.org/10.1016/j.jnutbio.2017.09.015
- Okon, E. B., Chung, A. W., Zhang, H., Laher, I., & van Breemen, C. (2007). Hyperglycemia and hyperlipidemia are associated with endothelial dysfunction during the development of type 2 diabetes. Canadian Journal of Physiology and Pharmacology, 85 (5), 562–567. https://doi.org/10.1139/Y07-026
- Patterson, E., Marques, T. M., O’Sullivan, O., Fitzgerald, P., Fitzgerald, G. F., Cotter, P. D., Dinan, T. G., Cryan, J. F., Stanton, C., & Ross, R. P. (2015). Streptozotocin-induced type-1-diabetes disease onset in Sprague-Dawley rats is associated with an altered intestinal microbiota composition and decreased diversity. Microbiology, 161 (Pt 1), 182–193. https://doi.org/10.1099/mic.0.082610-0
- Ramos-Romero, S., Hereu, M., Atienza, L., Casas, J., Jáuregui, O., Amézqueta, S., Dasilva, G., Medina, I., Nogués, M. R., Romeu, M., & Torres, J. L. (2018). Mechanistically different effects of fat and sugar on insulin resistance, hypertension, and gut microbiota in rats. American Journal of Physiology-Endocrinology and Metabolism, 314 (6), E552–E563. https://doi.org/10.1152/ajpendo.00323.2017
- Sampey, B. P., Vanhoose, A. M., Winfield, H. M., Freemerman, A. J., Muehlbauer, M. J., Fueger, P. T., Newgard, C. B., & Makowski, L. (2011). Cafeteria diet is a robust model of human metabolic syndrome with liver and adipose inflammation: Comparison to high-fat diet. Obesity (Silver Spring), 19 (6), 1109–1117. https://doi.org/10.1038/oby.2011.18
- Serino, M., Luche, E., Gres, S., Baylac, A., Bergé, M., Cenac, C., Waget, A., Klopp, P., Iacovoni, J., Klopp, C., Mariette, J., Bouchez, O., Lluch, J., Ouarné, F., Monsan, P., Valet, P., Roques, C., Amar, J., Bouloumié, A., … Burcelin, R. (2012). Metabolic adaptation to a high-fat diet is associated with a change in the gut microbiota. Gut, 61 (4), 543–553. https://doi.org/10.1136/gutjnl-2011-301012
- Shin, N.-R., Lee, J.-C., Lee, H.-Y., Kim, M.-S., Whon, T. W., Lee, M.-S., & Bae, J.-W. (2014). An increase in theAkkermansiaspp. Population induced by metformin treatment improves glucose homeostasis in diet-induced obese mice. Gut, 63 (5), 727–735. https://doi.org/10.1136/gutjnl-2012-303839
- Stanhope, K. L. (2016). Sugar consumption, metabolic disease and obesity: The state of the controversy. Critical Reviews in Clinical Laboratory Sciences, 53 (1), 52–67. https://doi.org/10.3109/10408363.2015.1084990
- Szkudelski, T. (2001). The mechanism of alloxan and streptozotocin action in B cells of the rat pancreas. Physiol, 50, 537–546.
- Tran, L. T., Yuen, V. G., & McNeill, J. H. (2009). The fructose-fed rat: A review on the mechanisms of fructose-induced insulin resistance and hypertension. Molecular and Cellular Biochemistry, 332 (1-2), 145–159. https://doi.org/10.1007/s11010-009-0184-4
- Troy, E. B., & Kasper, D. L. (2011). Beneficial effects of bacteroides fragilis polysaccharides on the immune system. Frontiers in Bioscience, 15 (1), 25–34. https://doi.org/10.2741/3603
- Vaarala, O., Atkinson, M. A., & Neu, J. (2008). The "perfect storm" for type 1 diabetes: The complex interplay between intestinal microbiota, gut permeability, and mucosal immunity. Diabetes, 57 (10), 2555–2562. https://doi.org/10.2337/db08-0331
- Vadiveloo, M., Scott, M., Quatromoni, P., Jacques, P., & Parekh, N. (2014). Trends in dietary fat and high-fat food intakes from 1991 to 2008 in the framingham heart study participants. British Journal of Nutrition, 111 (4), 724–734. https://doi.org/10.1017/S0007114513002924
- Wan, Y., Wang, F., Yuan, J., Li, J., Jiang, D., Zhang, J., & Li, D. (2019). Effects of dietary fat on gut microbiota and faecal metabolites, and their relationship with cardiometabolic risk factors: A 6-month randomised controlled-feeding trial. Gut, 68, 1417–1429. https://doi.org/10.1136/gutjnl-2018-317609
- Wang, F., Zhu, H., Hu, M., Wang, J., Xia, H., Yang, X., Yang, L., & Sun, G. (2018). Perilla oil supplementation improves hypertriglyceridemia and gut dysbiosis in diabetic KKAy mice. Molecular Nutrition & Food Research, 62 (24), 1800299. https://doi.org/10.1002/mnfr.201800299
- Xiang, M., Tang, J., Zou, X. L., Zhao, Z. Y., Wang, Y. Y., & Xie, S. N. (2009). Β cell Protecting and Immunomodulatory Activities of Paecilomyces Hepiali Chen Mycelium in STZ induced T1DM mice. The American Journal of Chinese Medicine, 37 (2), 361–372. https://doi.org/10.1142/S0192415X09006825
- Xu, F., Zhu, L., Qian, C., Zhou, J., Geng, D., Li, P., Xuan, W., Wu, F., Zhao, K., Kong, W., Qin, Y., Liang, L., Liu, L., & Liu, X. (2019). Impairment of intestinal monocarboxylate transporter 6 function and expression in diabetic rats induced by combination of high-fat diet and low dose of streptozocin. Involvement of butyrate-PPARgamma activation. Drug Metabolism and Disposition, 47, 556–566. https://doi.org/10.1124/dmd.118.085803
- Yan, X., Feng, B., Li, P., Tang, Z., & Wang, L. (2016). Microflora disturbance during progression of glucose intolerance and effect of sitagliptin: An animal study. Journal of Diabetes Research, 2016, 1–10. https://doi.org/10.1155/2016/2093171
- Yau, S. Y., Lee, T. H., Li, A., Xu, A., & So, K. F. (2018). Adiponectin mediates running-restored hippocampal neurogenesis in streptozotocin-induced type 1 diabetes in mice. Frontiers in Neuroscience, 12, 679. https://doi.org/10.3389/fnins.2018.00679
- Zhang, M., Lv, X. Y., Li, J., Xu, Z. G., & Chen, L. (2008). The characterization of high-fat diet and multiple low-dose streptozotocin induced type 2 diabetes rat model. Experimental Diabetes Research, 2008, 1–9. https://doi.org/10.1155/2008/704045
- Zhao, L., Chen, Y., Xia, F., Abudukerimu, B., Zhang, W., Guo, Y., Wang, N., & Lu, Y. (2018). A Glucagon-Like Peptide-1 receptor agonist lowers weight by modulating the structure of gut microbiota. Frontiers in Endocrinology, 9, 233. https://doi.org/10.3389/fendo.2018.00233