
ABSTRACT
Aflatoxin M1 (AFM1) in milk is a problem of great concern. Current methods of detection require large instruments and need specific test sites. Therefore, it is necessary to establish a fast, convenient, and accurate detection method for AFM1. We established a system based on fluorescent microspheres containing a Eu3+ chelate named AFM1-POCT. These components comprised the AFM1-POCT kits. After refrigeration at 4°C for 12 months, the intra and inter assay coefficients of variability (CVs) for the kits were 4% and 5%, respectively. AFM1-POCT compared well with ultra-high-performance liquid chromatography (UHPLC) determination in the range 0.0121–2 μg/kg (paired samples test, P > 0.05). Aflatoxin B1 and G1 do not react with aflatoxin M1. By using the AFM1-POCT method, the detection time is shortened to 5 min, the accuracy is comparable to that of UHPLC, and convenience and range of application are improved.
Introduction
Aflatoxins (AFTs), derivatives of dihydrofuran coumarin, can be divided into three groups, according to the fluorescence produced by ultraviolet irradiation: group B, group G, and related derivatives. AFT can inhibit the synthesis of cellular proteins and cause health problems in humans and animals (Rastogi et al., Citation2004). Of the AFTs, aflatoxin B1 (AFB1) is the most toxic, with a toxicity 10 times greater than potassium cyanide (Choudhury et al., Citation2011). AFB1 is metabolised into aflatoxin M1 (AFM1) under the action of liver microsomal single oxidase. AFM1 has a molecular mass of 329.27 Da and good heat resistance. It is not destroyed by common dairy processing methods, such as pasteurisation (LTLT, 63°C for 30 min), high-temperature rapid pasteurisation (HTST, 72°C for 15 s), and ultra-high temperature sterilisation (UHT, 135°C for 1–2 s) (Khoshfetrat et al., Citation2018). Therefore, it is necessary to establish a new, accurate, and rapid method for the detection of AFM1.
Material and methods
Reagents and apparatus
AFM1-BSA and anti-AFM1 antibody (by immunisation with AFM1-KLH) were provided by OriGene Technologies, Inc. (9620 Medical Center Drive Suite 200 Rockville, MD 20850 USA). Goat anti-rabbit antibody was purchased from Southern Biotech (Birmingham, USA). Fluorescent microspheres were obtained from Thermo Fisher Scientific (27 Xinjinqiao Road, Pudong New Area, Shanghai, China). NC membrane, water absorbing paper, sample pad, and binding pad were obtained from GE(1 Yongchang North Road, Beijing, China). N-Hydroxysuccinimide (NHS) and 1-Ethyl-3-(3-dimethylaminopropyl)carbodiimide hydrochloride (EDC) were purchased from Sigma-Aldrich Corp. (St. Louis, MO, USA). The HG-98 fluorometer (Excitation wavelength:365 nm,Receiving wavelength:615 nm) was produced independently.
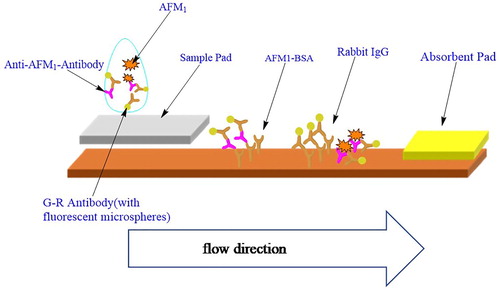
Coating the test strip
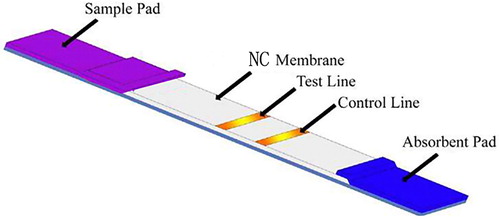
Rabbit IgG and AFM1-BSA antigen containing 1% BSA, 0.5% Tween 20, 5% trehalose, and 0.05 mol/L phosphate buffer (adjusted to pH 7.4) was diluted to 0.2 mg/mL with the former and a concentration of 0.8 mg/mL with the latter. 1.25 μ L/cm package is volume, interval 0.5 cm package is on the nitrous acid fibre membrane, 37°C dry after 8 h on the PVC floor, on two sides fixed sample pad (glass fibre membrane) and blotting paper, was 20% humidity, incised into a 0.4 cm wide strip, Into the shell, and stored at 4°C().
Figure 1. Test strip.
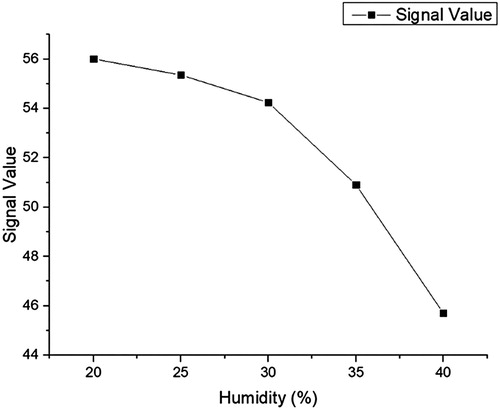
During coating, we found some conditions can affect the testing results such as the concentration, the dying time and so on. During we screened them, the concentration of AFM1-BSA was from 0.1 to 1.0 mg/mL, the drying time was from2 h to 12 h and the room humidity was from 20% to 40%(–).
Figure 2. The influence of AFM1-BSA coated amount.
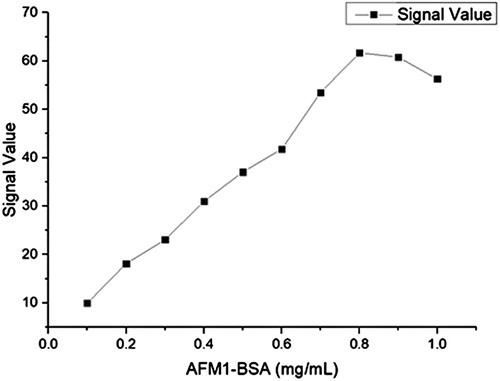
Figure 3. The influence of drying time.
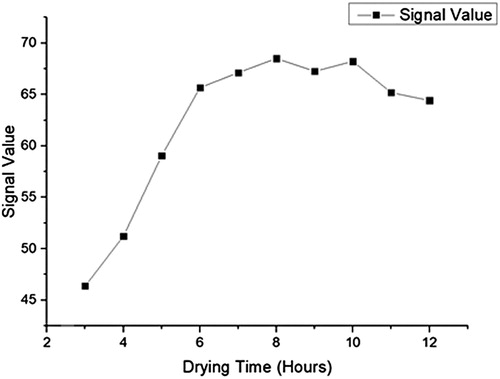
Figure 4. The infuence of room humidity.
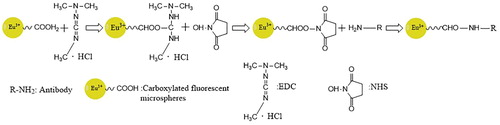
Tracer production
Carboxyl fluorescent microspheres (1 mL) were washed with 0.02 mol/L 2-(n-morpholino)ethanesulfonic acid buffer (MES) (pH 6.0) and added to 5 mg NHS and 10 mg EDC. After mixing, the reaction was conducted at 25°C in the dark for 27 min. The mixture was washed with 0.05 mol/L phosphate buffer solution (pH 7.4), then 0.6 μg anti-AFM1 antibody or goat anti-rabbit antibody was added. After reacting at 25°C in the dark for 4 h, 0.05 mol/L phosphate buffer solution (pH 7.4) containing 10% glycine was added to continue the reaction for 1 h. The mixture was washed with 0.05 mol/L phosphate buffer (pH 7.4) containing 1% BSA, 5% sucrose, and 0.1% proclin-300, then the volume was adjusted to 5 mL and the mixture was stored at 4°C ().
Figure 5. The principle of tracer production.
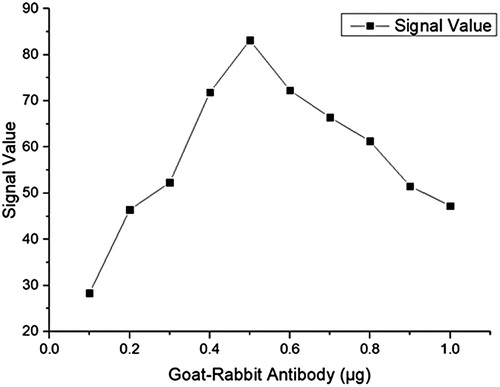
Interestingly, when we screened the amount of goat anti-rabbit or anti-AFM1 antibody from 0.1 to 1 μg, both have almost the same effect on the results at the same quality. Therefore, we only provide the goat anti-rabbit antibody volume changes as a reference. We also screened the reaction time with NHS and EDC was 5–30 min( and ).
Figure 6. The influence of reaction time with EDC and NHS.
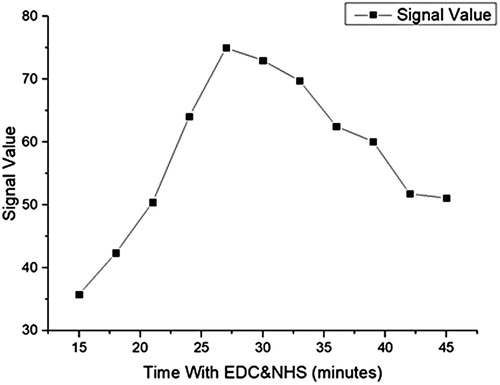
Figure 7. The influence of Goat-Rabbit’s amount.
Results
Before detection, the labelled goat anti-rabbit microspheres and anti-afm1 rabbit anti-microspheres were restored to room temperature, and then diluted to 0.2% and 2% of their original concentrations, respectively, with 0.05 mol/L phosphate buffer (pH 7.4) containing 1% BSA, 0.1% Tween-20, 0.4% S9, 5% sucrose, and 0.1% proclin-300. The mixed solution, containing 0.1% microspheres labled with goat anti-rabbit and 1% microspheres labelled with AFM1 anti-rabbit, was prepared as the sample diluent. AFM1 antigen (50 μL) was mixed with diluent (50 μL) and added to the test card after 1 min mixed, then was tested after 5 min reaction at 37°C().
Figure 8. Application range.
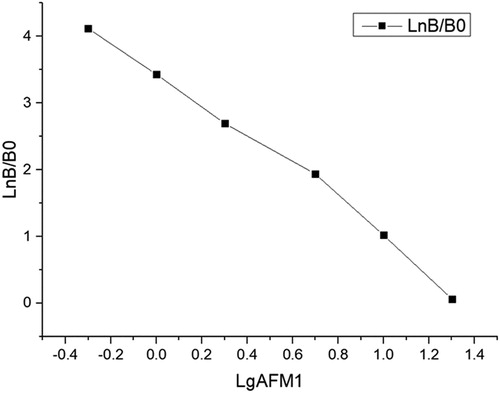
Standard curve
AFM1 antigen was diluted to 0.05, 0.1, 0.2, 0.5, and 1 μg/kg with 0.05 mol/L phosphate buffer (pH 7.4) containing 1% BSA and 0.1% proclin-300. Each concentration was measured 5 times, then coefficients of variability (CVs) were calculated and Logit-log was used to perform linear regression fitting. The measured concentration was taken as the ordinate and the standard concentration as the abscissa. The linear equation is y = −2.4723x + 3.9696, and the regression coefficient, r = 0.996().
Figure 9. Standard curve.
Precision
Measurements were repeated 10 times with 3 different batch numbers for the 0.05 and 1 μg/kg solutions to calculate intra and inter batch CVs ().
Table 1. Precision.
Placement stability
The 0.1 and 1 μg/kg solutions were detected 10 times. After being placed at 4°C for 12 months, CVs for 0.1 μg/kg were 9.083% at 37°C(7days) and 5.105% at 4°C(12 months). CVs for 1 μg/kg was 7.924% at 37°C(7days) and 12.371% at 4°C(12 months) ( and ).
Table 2. Placement stability(0.1μg/kg Value).
Table 3. Placement stability(1μg/kg).
Cross-reactivity and quantification limits
AFB1 and AFG1 antigens were diluted to the corresponding AFM1 concentrations for detection. The cross-reaction rate was determined as CR% = measured concentrations AFG1, AFB1/ measured concentrations AFM1 × 100%. For the concentration 1 μg/kg, the cross-reaction rate with AFM1 is less than 0.1%, indicating that there is no cross-reaction between the two.
AFB1 and AFG1 antigens solutions were diluted tenfold with deionised water and their concentrations were calculated by fitting the standard curve. The highest concentration in table was obtained for the lowest detection limit of 0.0121 μg/kg ().
Table 4. Limit of quantification.
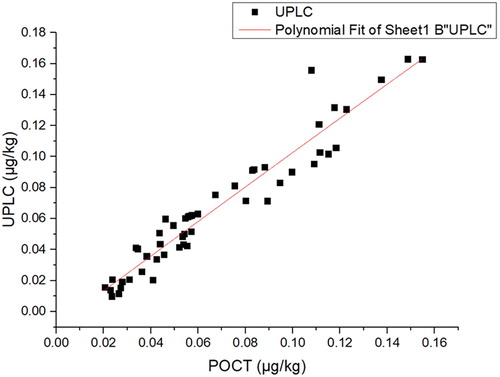
Comparison with UHPLC
Milk samples (100 batches) were selected randomly from the market, and their AFM1 concentrations were determined synchronously using the AFM1-POCT and UHPLC methods. The linear correlation equation, y = 1.1118 x - 8.6671, regression coefficient, r = 0.9275, paired test, t = 0.655, and P = 0.515 > 0.05 indicate that there is no statistical difference between the results().
Figure 10. comparison with UHPLC.
Conclusion
Contamination of dairy products with AFT remains a global concern. AFM1 was classified as a class I carcinogen by the World Health Organization (WHO) International Agency for Research on Cancer in 2002 (Rastogi et al., Citation2004). AFB1 has a transfer efficiency of 2–4% from feed to milk, and the conversion rate of high-yielding cows can reach 6% due to their relatively high intake of AFB1, which converts to irreducible AFB1 and AFM1 in milk (Veldman et al., Citation1992). Worldwide, many countries and regions have set limits for maximum AFM1 content in dairy products (Zhao et al., Citation2013).
As such, a highly sensitive detection method for AFM1 is desired. At present, the methods used to determine AFM1 content in dairy products include ELISA(LOD:0.015 μg/kg), colloidal gold(LOD:0.3 μg/kg), chemiluminescence (LOD:0.025 μg/kg), HPLC (LOD:0.003 μg/kg), UHPLC (LOD:0.001 μg/kg), and responsive microfluidic chip aptasensor (LOD:0.003 μg/kg) and the UHPLC is the most accurate method (Dasenaki & Thomaidis, Citation2015; Deng & Lai, Citation2006; Flores-Flores & González-Peñas, Citation2017; He et al., Citation2020; Luo et al., Citation2014; Vdovenko et al., Citation2014; Velasco et al., Citation2003 ). The AFM1-POCT method is based on time-resolved fluorescence immunoassay (Huang et al., Citation2006; Ma et al., Citation2009) and nanometre fluorescence microsphere technology (Guo et al., Citation2018; Huang et al., Citation2017; Zhang et al., Citation2017), which greatly reduces the detection time while ensuring accurate detection. The AFM1-POCT and UHPLC methods demonstrate consistent results in the linear range of 0.03–0.1 μg/kg (P > 0.05). Since most of these methods require large, non-transportable instruments and extended testing times, they are inconvenient and lack adequate accuracy to meet the requirements of most countries and organisations. Guo et al. (Citation2017) developed a detection method based on time-resolved fluorescence (TRFIA), which improved sensitivity to 0.006 μg/kg, but required a reaction time of 2 h, and the instrument did not meet the requirements of carry-on. In contrast, AFM1-POCT reduces detection time to 5 min and the instrument is portable. The method proposed herein meets the 0.05–0.5 μg/kg detection limit required by most countries and organisations and enables on-site sampling.
Acknowledgements
This work was supported by the Innovation Capacity Development Plan of Jiangsu Province (BM2018023-2), Jiangsu Provincial Key Medical Discipline (Laboratory)(ZDXKA2016017), Wuxi Sci-Tech Development Fund(WX03-02B0105-061900-21).
Disclosure statement
No potential conflict of interest was reported by the author(s).
Additional information
Funding
References
- Choudhury, M., Mahanta, L. B., Goswami, J. S., & Mazumder, M. D. (2011). Will capacity building training interventions given to street food vendors give us safer food?: A cross-sectional study from India. Food Control, 22(8), 1233–1239. https://doi.org/10.1016/j.foodcont.2011.01.023
- Dasenaki, M. E., & Thomaidis, N. S. (2015). Multi-residue determination of 115 veterinary drugs and pharmaceutical residues in milk powder, butter, fish tissue and eggs using liquid chromatography–tandem mass spectrometry. Analytica Chimica Acta, 880, 103–121. https://doi.org/10.1016/j.aca.2015.04.013
- Deng, S., Lai, W., & Xu, Y. (2006). Progress of aflatoxin M1 in milk and dairy products. Chinese Journal of Public Health, 22(44), 490–491. https://doi.org/10.11847/zgggws2006-22-04-77.
- Flores-Flores, M. E., & González-Peñas, E. (2017). An LC-MS/MS method for multi-mycotoxin quantification in cow milk. Food Chemistry, 218, 378–385. https://doi.org/10.1016/j.foodchem.2016.09.101
- Guo, M. (2018). Detection of serum tumor markers by time-resolved fluorescence immunochromatography. Chinese Journal of Nuclear Medicine and Molecular Imaging, 38(4), 266–270. https://doi.org/10.3760/cma.j.issn.2095-2848.2018.04.009.
- Guo, M., Zhou, B., Huang, Z., Zhao, C., Zhang, J., & Huang, B. (2017). A new method for determination of aflatoxinM1 in milk by ultrasensitive time-resolved fluoroimmunoassay. Food Analytical Methods, 10(8), 2848–2855. https://doi.org/10.1007/s12161-017-0850-1
- He, L., Shen, Z., Wang, J., Zeng, J., Wang, W., Wu, H., Wang, Q., & Gan, N. (2020). Simultaneously responsive microfluidic chip aptasensor for determination of kanamycin, aflatoxin M1, and 17beta-estradiol based on magnetic tripartite DNA assembly nanostructure probes. Microchimica Acta, 187(3), 176. https://doi.org/10.1007/s00604-020-4155-5
- Huang, B., Wang, L., Zhang, Y., Zhang, J., Zhang, Q., Xiao, H., Zhou, B., Sun, Z., Cao, Y.-n., Chen, Y., Hu, Z., & Sheng, H. (2017). A novel time-resolved fluoroimmunoassay for the quantitative detection of antibodies against the phospholipase A2 receptor. Scientific Reports, 7(1), 46096. https://doi.org/10.1038/srep46096
- Huang, B., Xiao, H., Zhang, X., Zhu, L., Liu, H., & Jin, J. (2006). Ultrasensitive detection of pepsinogen I and pepsinogen II by a time-resolved fluoroimmunoassay and its preliminary clinical applications. Analytica Chimica Acta, 571(1), 74–78. https://doi.org/10.1016/j.aca.2006.04.053
- Khoshfetrat, S. M., Bagheri, H., & Mehrgardi, M. A. (2018). Visual electrochemiluminescence biosensing of aflatoxin M1 based on luminol functionalized, silver nanoparticle-decorated graphene oxide. Biosensors and Bioelectronics, 100, 382–388. https://doi.org/10.1016/j.bios.2017.09.035
- Luo, X. Q. (2014). Study on gold immunochromatography assay for rapid detection of aflatoxin m1 in milk. Food Research and Development, 76–79. https://doi.org/CNKI:SUN:SPYK.0.2014-01-024.
- Ma, Z., Huang, B., Zhang, J., Zhang, Y., Zhu, L., & Tu, Q. (2009). Time-resolved fluoroimmunoassay of zearalenone in cereals with a europium chelate as label. Journal of Rare Earths, 27(6), 1088–1091. https://doi.org/10.1016/S1002-0721(08)60393-2
- Rastogi, S., Dwivedi, P. D., Khanna, S. K., & Das, M. (2004). Dectection of aflatoxinM1 contamination in milk and infant milk products from Indian market by ELISA. Food Control, 15(4), 287–290. https://doi.org/10.1016/S0956-7135(03)00078-1
- Vdovenko, M. M., Lu, C.-C., Yu, F.-Y., & Sakharov, I. Y. (2014). Development of ultrasensitive direct chemiluminescent enzyme immunoassay for determination of aflatoxin M1 in milk. Food Chemistry, 158, 310–314. https://doi.org/10.1016/j.foodchem.2014.02.128
- Velasco, R. M. L., Delso, M. M. C., & Escudero, D. O. (2003). ELISA and HPLC determination of the occurrence of aflatoxin M1 in raw cow’s milk. Food Additives and Contaminants, 20(3), 276–280. https://doi.org/10.1080/0265203021000045208
- Veldman, A., Meijs, J. A. C., Borggreve, G. J., & Heeres-Van der Tol, J. J. (1992). Carry-over of aflatoxin from cow’s food to milk. Animal Production, 55, 163–168. https://doi.org/10.1016/j.foodchem.2014.02.128.
- Zhang, Y., Ding, X.-L., Guo, M.-M., Han, T.-T., Huang, Z.-J., Shang, H.-T., & Huang, B. (2017). Quantitative and rapid detection of microcystin-lr using time-resolved fluorescence immunochromatographic assay based on europium nanospheres. Analytical Methods, 9(45), 6430–6434. https://doi.org/10.1039/C7AY02036H
- Zhao, Z. J., Dong, Y., & Zhang, X. (2013). Aflatoxin in liquid milk in ChinaInvestigation and analysis of element M1 content. China Dairy Cattle, 6, 46–49. https://doi.org/10.3969/j.issn.1004-4264.2013.06.012.