
ABSTRACT
A bispecific monoclonal antibody (BsMAb) that can simultaneously recognize aflatoxin B1 (AFB1) and amantadine (AMD) was prepared. Quantum dot nanobead immunochromatographic assay (QB-ICA) based on the BsMAb was developed for the simultaneous detection of AFB1 and AMD in four feed samples (suckling pig feed, piglet feed, sow feed, and compound feed for laying ducks). Under optimal experimental conditions, the LOD values of QB-ICA for AFB1 in four feed samples were 0.188, 0.221, 0.233, and 0.306 μg/kg, respectively. The LOD values of QB-ICA for AMD in the same feed samples were 0.125, 0.187, 0.076, and 0.191 μg/kg, respectively. The recovery rates of QB-ICA for AFB1 and AMD ranged from 91.55% to 150.87% and from 91.62% to 138.42%, respectively. The variation coefficients were all less than 15%. The proposed QB-ICA had high reliability and specificity for the simultaneous detection of AFB1 and AMD, providing a platform for simultaneous detection of hazardous substances.
1. Introduction
Bispecific monoclonal antibody (BsMAb), which is a monoclonal antibody molecule with two different specific antigen-binding sites, can specifically recognize two completely distinct antigen clusters. Techniques for preparing BsMAb include chemical cross-linking (Mohammad et al., Citation2014), genetic engineering (Cao et al., Citation2021), and hybrid–hybridoma technology (Seckinger et al., Citation2017). Currently, BsMAb is used in multiresidue immunoassay for food safety. Guo (Guo et al., Citation2009) labeled colloidal gold with BsMAb and established a colloidal gold immunochromatographic assay for simultaneously detecting carbofuran and triazophos. Hua (Hua et al., Citation2013) prepared BsMAb to determine organophosphorus pesticide and neonicotinoid pesticide residues in food. Wang (Wang et al., Citation2016) prepared a BsMAb to detect furatone metabolite, malachite green, and leucomalachite green in aquatic products through multi-analysis ELISA. Shu (Shu et al., Citation2017) prepared a BsMAb and developed a multi-immunochromatographic assay to quantitatively detect pesticide residues.
Aflatoxin B1 (AFB1), which a secondary metabolite produced by Aspergillus flavus and Aspergillus parasiticus (Hamid et al., Citation2018; Zhao et al., Citation2021a), was classified as a class I carcinogen by the International Agency of Research on Cancer in 1988 due to its strong carcinogenic, teratogenic, and mutagenic effects (Vladimir et al., Citation2016). Amantadine (AMD) is a stable tricyclic amine compound, which is used as a class of antiviral drugs for influenza treatment (Dong et al., Citation2019; Piotr et al., Citation2020). However, the excessive use of AMD has greatly increased the transmissibility, pathogenicity, and cross-resistance of drug-resistant virus strains, seriously endangering human health. The US Food and Drug Administration (FDA) and Ministry of Agriculture of China have prohibited the use of AMD in livestock and poultry breeding (Peng et al., Citation2017).
The safety of feed can ensure the safety of animal derived food, so a rapid, efficient, and sensitive method for detecting AFB1 and AMD residues is indispensable. To date, various instrumental methods have been developed to detect AFB1 and AMD in feed and food samples, such as ultrahigh-performance liquid chromatography coupled with mass spectrometry (Manizan et al., Citation2018), liquid chromatography tandem mass spectrometry (Monbaliu et al., Citation2010), and high-performance liquid chromatography (Pradeepkiran & Bhaskar, Citation2018). However, these instrumental methods usually require complex preprocessing procedures, professional personnel, and expensive equipment. Alternatively, immunochromatographic assay (ICA) has the advantages of simple operation and low cost and can be used to rapidly screen mycotoxins and veterinary drugs in feed and food (Dong et al., Citation2020; Huo et al., Citation2021; Wang et al., Citation2015; Wu et al., Citation2017; Wu et al., Citation2020).
Quantum dot nanobead (QB) is a polymer nanoparticle doped with a large number of quantum dot (QDs) and has the unique advantages of broad excitation spectrum, narrow emission spectrum, high quantum yield, and excellent photobleaching resistance stability (Lai et al., Citation2020). In the present study, a BsMAb-based QB-ICA for the simultaneous detection of AFB1 and AMD in feed was established. The sensitivity, specificity, and recovery of the method were evaluated. To the best of our knowledge, this is the first study that used BsMAb in ICA for simultaneous detection of AFB1 and AMD in feed.
2. Materials and methods
2.1. Materials and apparatus
AFB1, aflatoxin B2 (AFB2), ochratoxin A (OTA), zearalenone (ZEN), deoxynivalenol (DON), fumonisin B1 (FB1), T-2 toxin (T-2), AMD, rimantadine (RIM), 1-adamantane carboxylic acid (1-ACA), paracetamol (PAR), ribavirin (RBV), and ofloxacin (OFL) were purchased from Aladdin (Shanghai, China). The structures of the drugs are shown in Figure S1. Horseradish peroxidase-labeled goat anti-mouse immunoglobulin (HRP-IgG) and goat anti-mouse secondary antibody (sAb) were purchased from Jackson Immuno Research Laboratories, Inc. (Shanghai, China), and 8-azaguanine (8-AG) and 5-bromodeoxyuridine (5-BrdU) were purchased from J&K Scientific Ltd. (Shanghai, China). Bovine serum albumin (BSA) was purchased from Sigma (St Louis, MO, USA). Fetal bovine serum (FBS), culture media RPMI 1640, HAT medium supplements, HT medium supplements, and polyethylene glycol (PEG) 1450 were purchased from Gibco (NY, USA). Myeloma cells (SP2/0) were purchased from the Chinese Academy of Sciences Cell Bank (Shanghai, China). The polymethyl methacrylate (PMMA), poly (maleic anhydride-alt-1-octadecene) (PMAO), sodium dodecyl sulfonate (SDS), and CHCl3 were purchased from Sigma Chemical Company (St. Louis, MO, USA). Hydrophobic octadecylamine-coated CdSe/ZnS QDs were provided by Ocean NanoTech, LLC (San Diego, USA). Polyvinylchloride (PVC) backing pad, nitrocellulose (NC) membrane, sample pad, and absorbent pad were purchased from Millipore (Bedford, MA, USA). AFB1-BSA, AMD-BSA, anti-AFB1 monoclonal antibodies (anti-AFB1 mAbs), and anti-AMD mAbs were prepared by our laboratory. The BioDot XYZ platform was purchased from BioDot (Irvine, CA, USA). A fluorescence intensity strip reader for recording QB-ICA signals was purchased from Hangzhou Hemai Technology Co., Ltd. (Hangzhou, China).
2.2. Treatment of hybridomas
As shown in , the HGPRT− deletion mutants of hybridomas producing anti-AFB1 mAbs were cultured in an RPMI 1640 culture medium containing 10% FBS with different concentration gradient (10, 30, 50, 70, and 90 μg/mL) of 8-AG for 3 weeks. After culturing, the hybridomas treated by 8-AG were placed in HAT medium, and whether they are sensitive to HAT was determined. Morphological changes in AFB1 hybridomas were observed and recorded under an inverted microscope. The TK-deletion mutants of hybridomas producing anti-AMD mAbs were cultured in an RPMI 1640 culture medium containing 10% FBS with different concentrations (10, 30, 50, 70, and 90 μg/mL) of 5-BrdU for 3 weeks, and subsequent steps were the same as those used for HGPRT− deletion mutants.
Figure 1. Schematic diagram of BsMAb preparation. (a) Treatment with 8-AG and 5-BrdU; (b) HAT sensitivity identification after drug treatment; (c) If the identification of step b fails, then the c operation is carried out, and drug treatment is continued; (d) enzyme-deficient hybridoma fusion is carried out after successful identification in step b.
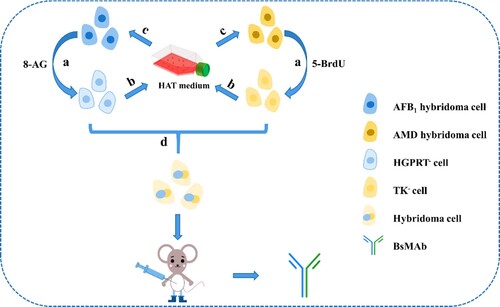
2.3. Preparation of BsMAb
BsMAb was prepared with a hybrid-hybridoma technology. A tetradoma was obtained by fusing the obtained HAT-sensitive hybridomas producing anti-AFB1 and anti-AMD mAbs (). The fused cells were distributed in 96-well culture plates and cultivated in a HAT medium. Three days after cell fusion, half of the HAT medium was replaced. Six days after cell fusion, the full exchange of the HT medium was completed. On the seventh day, non-competitive and competitive indirect ELISA (Zhao et al., Citation2021b) was used in detecting antibodies that can recognize AFB1 and AMD in cell culture supernatants. Then, selected hybridomas were subcloned four times with a limited dilution method, and a stable antibody-producing tetradoma was reproduced and intraperitoneally injected into a BALB/c mouse previously primed with 0.5 mL of sterile liquid paraffin for ascites production. Ultimately, ascites was purified using the n-octanoic acid ammonium sulfate precipitation method (Zhang et al., Citation2019).
2.4. Evaluation of the BsMAb with ic-ELISA
The ic-ELISA for BsMAb detection was developed as previously described (Li et al., Citation2020). First, detecting antigens AFB1-BSA and AMD-BSA were diluted to 0.3 and 0.1 μg/mL with CBS (0.01 M, pH 9.6), respectively. Then, the 96-well microplates were coated with 100 μL of AFB1-BSA and AMD-BSA (0.3 and 0.1 μg/mL) per well and incubated at 37 °C for 2 h. After the plates were washed three times with PBST (0.01 M PBS containing 0.05% Tween-20), each well was blocked with 230 μL of blocking buffer and incubated at 37 °C for 2 h. After the washing steps, 50 μL of PBS (0.01 M, pH 7.4) or a serially diluted AFB1 (0, 0.05, 0.1, 0.5, 1, 2.5, 5, 10, 20, 50, 75, 100, and 150 ng/mL) and AMD (0, 0.01, 0.05, 0.1, 0.5, 1, 2.5, 5, 10, 20, 50, and 100 ng/mL) standard solutions were added. Then, 50 μL of BsMAb was added, and the plates were incubated at 37 °C for 30 min. After four times of washing with PBST, 100 μL of diluted (1:3000) goat anti-mouse IgG-HRP conjugate was added, and the plates were incubated at 37 °C for 30 min. After four times of washing with PBST, 100 μL of TMB substrate solution was added, and the plates were incubated at 37 °C for 15 min. Subsequently, the reaction was stopped with 2 M H2SO4 solution (50 μL/well). Finally, absorbance was recorded at 450 nm with a microplate reader, and the calibration standard curves were analyzed by plotting absorbance against the logarithm of analyte concentration. Each test was replicated in triplicate.
2.5. QB-ICA
2.5.1. Preparation of QB
The QB were prepared as described by the previous work of our laboratory, and the specific process is as follows: 60 mg of PMMA and 40 mg of PMAO were added to a clean vial containing 1 mL of CHCl3. After thorough mixing, 20 mg of CdSe/ZnS QDs was added to 5 mL of SDS aqueous solution (1%, W/W). The mixture was evaporated for 2 h at 60 °C for the removal of CHCl3 and centrifuged for 20 min at 13500 r/min at 4 °C. Finally, the resulting QB was washed three times with ultrapure water and then redissolved in 1 mL of ultrapure water.
2.5.2. Preparation of QB-BsMAb
QB-BsMAb was prepared using the EDC-mediated method. Briefly, 2.0 μL of QB (30 μg) and 500 μL of PB buffer (0.2 mol/L, pH 5.0) were mixed with 40.0 μL of fresh EDC solution (1.0 mg/mL). Approximately 60 μL of BsMAb solution (12 μg) and 100 μL of BSA (10% wt/vol) were separately added dropwise to the mixture, which was then gently stirred for 1 h at 25 °C. Then, the final mixture was centrifuged at 13,500 r/min at 4 °C for 15 min. Precipitation was resuspended in 100 μL of PBS (0.01 mol/L, pH 7.4).
2.5.3. Characterization of QB and QB-BsMAb
The surface morphology and sizes of the QB were characterized using transmission electron microscopy (TEM, JEOL JEM-2100, Tokyo, Japan). The hydrodynamic sizes and zeta potential values of QB and QB-BsMAb probes were characterized using a particle size analyzer (Nano-ZS, Malvern Instruments Ltd., Malvern, UK).
2.5.4. Preparation of QB-ICA test strip
The assembly of QB-ICA sensors is illustrated in Figure S2. First, detective antigens AFB1-BSA and AMD-BSA and sAb were diluted to final concentrations of 1.2, 0.2, and 0.3 mg/mL, respectively, with PBS (0.01 M, pH 7.4), sprayed on the NC membrane as the test lines T1 and T2 and control (C) line, respectively, and dried at 37 °C for 6 h. The dried NC membrane, sample pad, and treated absorbent pad were assembled on the PVC backing pad.
2.5.5. Assays with the QB-ICA test strip
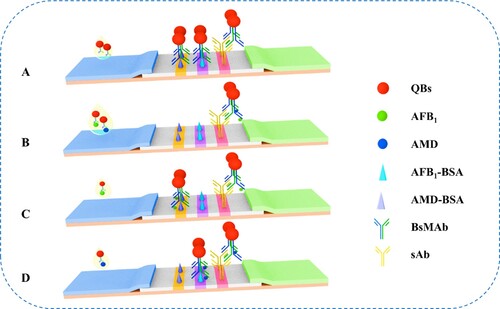
Approximately 2 μL of QB-BsMAb probe and 100 μL of sample solution (negative or positive) were incubated in microplate wells for 5 min and added to the sample pad. After 20 min, the fluorescence intensity of the control line (FIT0) and test lines were recorded with a QB portable strip reader. When AFB1 and AMD were not detected in the sample, the QB-BsMAb probe migrated across the NC membrane through capillary action and was captured by AFB1-BSA and AMD-BSA immobilized on the T1 and T2 lines, respectively ( A). When the target AFB1 and AMD were present in the sample, the QB-BsMAb probe bound to AFB1 and AMD in the sample, and the immunocomplex was not captured by AFB1-BSA and AMD-BSA immobilized on the test lines ( B). As shown in C, when the target AFB1 was present but AMD was absent in the sample, the QB-BsMAb probe bound to AFB1 and not with AMD, and the immunocomplex was only captured by AMD-BSA immobilized on the test line. D shows an opposite result. Regardless of whether AFB1 and AMD was present or not, QB-BsMAb complexes were captured by sAb immobilized on the control line.
Figure 2. Schematic diagram of the QB-ICA for AFB1 and AMD detection. (A) Negative; (B), (C), and (D) are all positive, where (B) indicates that AFB1 and AMD are present, (C) indicates that only target AFB1 is present, and (D) indicates that only target AMD is present.
2.6. Optimization of key parameters
The experimental parameters of QB-ICA based on BsMAb were optimized by coupling pH (5.0, 5.5, 6.0, and 6.5), amount of EDC (60, 70, 80, 90, and 100 μg), amount of BsMAb (8.0, 10.0, 12.0, and 14.0 μg), concentration of AFB1-BSA on the T1 line (0.8, 1.0, 1.2, 1.4, and 1.6 mg/mL), concentration of AMD-BSA on the T2 line (0.1, 0.2, 0.3,0.4, and 0.5 mg/mL), and volume of QB-BsMAb probe (1.0, 1.5, 2.0, 2.5, and 3.0 μL).
2.7. Specificity of QB-ICA
AFB1, AFB2, ZEN, FB1, DON, OTA, T-2 , AMD, RIM, 1-ACA, PAR, RBV, and OFL were used in evaluating the specificity of the established QB-ICA at a concentration of 10.0 ng/mL. The experiments were carried out three times.
2.8. Actual sample preparation
Four different feed samples (suckling pig feed, piglet feed, sow feed, and laying duck compound feed) were used in evaluating the proposed QB-ICA, the sample preparation method was modified on the basis of previous studies (Li et al., Citation2021). Feed sample was ground in a blender and passed through a screen (0.850 mm). Feed sample (5 g; blank or spiked), methanol/water mixture (1:7, v/v; 25 mL), and sodium chloride (1 g) were mixed and then shaken on an oscillator for 7 min. The mixture was centrifuged at 4000 r/min for 15 min. Finally, the supernatant was collected in another polypropylene centrifuge tube for subsequent analysis.
2.9. Detection of performance parameters in actual samples
2.9.1. Sensitivity of the proposed QB-ICA in four different feed samples
Different mixing concentrations of AFB1 and AMD (0, 0.1, 0.25, 0.5, 1.0, 2.5, 5.0, 10.0, 25.0, 50.0, 100.0, and 200.0 ng/mL) were added to the suckling pig feed, piglet feed, sow feed, and laying duck compound feed sample and detected using the QB-ICA test strip. Then, the standard curves for the detection of AFB1 and AMD in feed were established with the concentrations of AFB1 and AMD as abscissas and the log values of FIT10 and FIT20 as ordinates. The experiments were carried out three times.
2.9.2. Recovery of AFB1 and AMD in four feed samples with the QB-ICA
Different concentrations of AFB1 (suckling pig feed, piglet feed, sow feed, and laying duck compound feed: 0.5, 1.0, and 2.0 μg/kg) and AMD (suckling pig feed, sow feed, piglet feed, and laying duck compound feed: 0.5, 10.0, and 25.0 μg/kg) were added to the four feed samples. The recovery rates and coefficients of variation (CVs) of AFB1 and AMD in the four feed samples were quantitatively analyzed using the QB-ICA system.
3. Results and discussion
3.1. Identification of hybridoma cell lines with HAT selective medium
AFB1 and AMD hybridomas were treated with 8-AG and 5-BrdU to mutate into HGPRT− and TK− hybridomas, respectively. The morphology of the hybridomas before and after drug treatment are shown in Figure S3 A, B and Figure S4 A, B. The AFB1− HGPRT− and AMD-TK− hybridomas had a good growth state. It could be seen from Figure S3 C and Figure S4 C, the treated AFB1-HGPRT− and AMD-TK− hybridomas were identified with the HAT selective medium due to the deficiency of HGPRT and TK enzymes. The HGPRT−-deficient hybridoma cell line AFB1-HGPRT− secreting anti-AFB1 monoclonal antibody and a TK−-deficient hybridoma cell line AMD-TK- secreting anti-AMD monoclonal antibody were successfully obtained. After the two kinds of enzyme-deficient hybridomas were fused, four kinds of BsMAb cell lines (1B6, 1H12, 3E1, and 5D5) that can secrete antibodies against AFB1 and AMD were screened out.
3.2. Evaluation of BsMAb by ic-ELISA
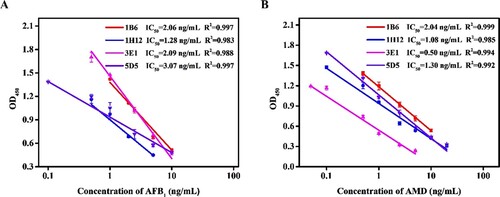
The standard curves for the four BsMAb cell lines were established with IC-ELISA. As shown in A and B, the IC50 values of 1B6, 1H12, 3E1, and 5D5 were 2.06, 1.28, 2.09, and 3.07 ng/mL for AFB1, respectively. The IC50 values of 1B6, 1H12, 3E1, and 5D5 were 2.04, 1.08, 0.50, and 1.30 ng/mL for AMD, respectively. According to the maximum residue limits of AFB1 and AMD in China, 3E1 was finally selected for subsequent experiments.
Figure 3. BsMAb were evaluated using ELISA. (A) Standard curve for BsMAb detection of AFB1; (B) Standard curve for BsMAb detection of AMD.
3.3. Development of QB-ICA
3.3.1. Characterization of QB and QB-BsMAb
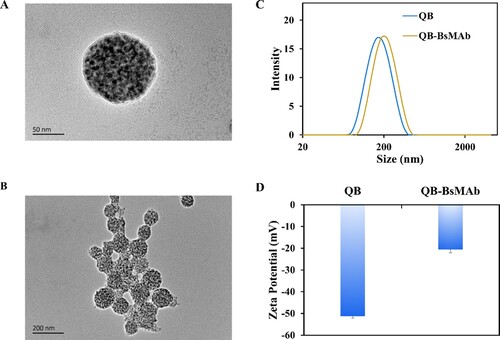
The TEM images in A and B show that the QB had spherical shapes and homogenous size distribution. The hydrodynamic size of QB was 164 nm in C. As shown in C, when the surfaces of the QB were labeled with a layer of BsMAb, the size distribution of the hydrodynamic diameters of the complex QB-BsMAb was 190 nm, demonstrating that the BsMAb was effectively coupled to the surfaces of the QB. The zeta potential in D confirmed that BsMAb was successfully bound to the surfaces of the QB, the zeta potential of QB surface was −51 mV, and surface potential of QB-BsMAb was −20 mV.
Figure 4. Characterization of QB and QB-BsMAb. (A) Image of individual QB at high magnification; (B) High-resolution TEM image of the QB; (C) Hydrodynamic diameter of QB and QB-BsMAb; (D) Zeta potential values of QB and QB-BsMAb.
3.3.2. Optimization of coupling pH
The pH of a buffer system during conjugation should be optimized because coupling pH influences the activity and coupling efficiency of antibodies, particularly the surface charge distribution and adsorption cross-linking rates of the antibodies (Hu et al., Citation2017; Lou et al., Citation2019). The optimal coupling pH was selected according to the high inhibition ratios of the positive samples and the high signal of FIT0 in the negative samples. As shown in Figure S5 A, as pH increased, the FIT10 of QB-ICA changed significantly. When pH increased to 5.5, the FIT10 and inhibition ratio were high. Although pH 6.0 and 6.5 had higher inhibition ratios than pH 5.5, FIT10 was significantly reduced at pH 6.0 and 6.5. Similarly, as shown in Figure S5 B, when pH increased to 5.5, FIT20 increased, and the highest inhibition ratio was observed. Hence, the optimum coupling pH was 5.5.
3.3.3. Optimization of the amount of EDC
The EDC was used to activate carboxyl groups on the surfaces of the QB so as to improve the coupling rate between QB and BsMAb. As shown in Figure S6 A, when the amount of EDC reached 80 μg, FIT10 was high, and the highest inhibition ratio was obtained. The same result is shown in Figure S6 B, and the highest FIT20 and inhibition ratio were obtained at EDC of 80 μg. Therefore, the optimum condition for the interaction between QB and BsMAb was 80 μg EDC.
3.3.4. Optimization of the amount of BsMAb in preparing QB-BsMAb
The amount of antibody used in the preparation of QB-BsMAb probe affects the affinity between a probe and detected targets, thus affecting the performance of a detection method. As shown in Figure S7 A, with the different amounts of BsMAb, the FIT10 of QB-ICA changed. When the amount of BsMAb was 12 μg, the highest FIT10 and inhibition ratio was obtained. The same result is shown in Figure S7 B. The highest FIT20 and inhibition ratio were obtained when the amount of BsMAb was 12 μg. In addition, when the amount of BsMAb was higher than 12 μg, the inhibition rates of the T1 and T2 lines were significantly reduced. A high antibody coupling amount is not conducive to the competitive inhibition between targets and detection antigen on T-line. The antibody coupling amount would affect the sensitivity of detection method (Hu et al., Citation2018). Thus, the optimum amount of BsMAb for labeling was 12 μg.
3.3.5. Optimization of the concentration of the AFB1-BSA and AMD-BSA on the T-line
As shown in Figure S8 A, FIT10 increased with AFB1-BSA concentration on the T1 line. However, when the AFB1-BSA concentration was higher than 1.2 mg/mL, the inhibition ratio decreased significantly. Similarly, as shown in Figure S8 B, when AMD-BSA concentration was 0.2 mg/mL on the T2 line, FIT20 was high, and the highest inhibition ratio was obtained. When AMD-BSA concentration was higher than 0.2 mg/mL, the inhibition ratio showed a downward trend. Therefore, the optimal total antigen concentrations for the T1 and T2 lines of QB-ICA were 1.2 and 0.2 mg/mL, respectively.
3.3.6. Optimization of the volume of QB-BsMAb
As shown in Figure S9 A, FIT10 increased with the volume of the QB-BsMAb probe. Although the highest inhibition ratio was obtained with 1.0 μL of QB-BsMAb probe, the lowest FIT10 was obtained. Moreover, when the volume of QB-BsMAb probe was more than 2.0 μL, the inhibition ratio decreased significantly. In Figure S9 B, when the volume of QB-BsMAb probe was 2.0 μL, the inhibition ratio was the highest while the FIT20 was high. So, 2.0 μL of QB-BsMAb was chosen for the QB-ICA.
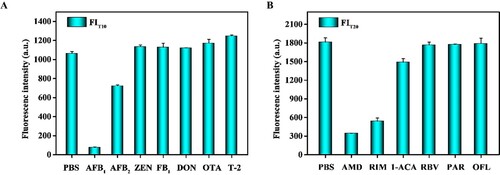
3.4. Specificity of the QB-ICA
Seven mycotoxins (AFB1, AFB2, ZEN, FB1, DON, OTA, and T-2) and six veterinary drugs (AMD, RIM, 1-ACA, PAR, RBV, and OFL) were evaluated using the developed QB-ICA in PBS. As shown in A, the developed QB-ICA was specific for the detection of AFB1. As shown in B, the cross-reaction target of the QB-ICA for AMD is its analogue RIM, which has structures that are highly similar to those of AMD. The RIM was also banned for animal breeding in China (Hu et al., Citation2022). So, it is beneficial to have cross-reactivity with RIM.
Figure 5. Specificity of the QB-ICA for (A) AFB1, (B) AMD and their analogues in BsMAb and other mycotoxins and veterinary drugs at concentrations of 10 ng/mL, respectively.
3.5. Testing of actual samples using QB-ICA
3.5.1. Standard curves in actual AFB1 and AMD spiked sample extracts
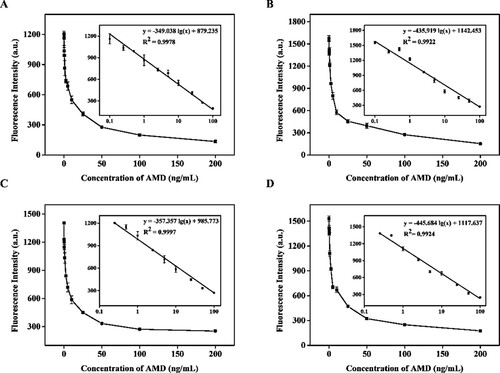
The standard calibration curves of QB-ICA in suckling pig feed, piglet feed, sow feed, and laying duck compound feed samples were prepared by plotting the corresponding FIT0 (FIT10 and FIT20) against the logarithm of various known AFB1 and AMD concentrations. A, B, C, and D show that the four linear regression equations of QB-ICA for AFB1 were y = −1026.173 lg (x) + 911.055 (R2 = 0.9817), y = −1278.832 lg (x) + 1133.357 (R2 = 0.9735), y = −1512.438 lg (x) + 1482.017 (R2 = 0.9802), and y = −1516.520 lg (x) + 1470.348 (R2 = 0.9859), respectively. The results demonstrated that this assay had a good linear range of 0.25–5 μg/kg in suckling pig feed, sow feed, and laying duck compound feed and 0.5–5 μg/kg in piglet feed. The LOD values of QB-ICA for AFB1 in the four feed samples were 0.188, 0.221, 0.233, and 0.306 μg/kg, respectively, which met the maximum limit requirement of AFB1 in feed. A, B, C and D show that the linear regression equations of QB-ICA for AMD in four feed samples were y = −349.038 lg (x) + 879.235 (R2 = 0.9978), y = −435.919 lg (x) + 1142.453 (R2 = 0.9922), y = −357.357 lg (x) + 985.773 (R2 = 0.9997), and y = −445.684 lg (x) + 1117.637 (R2 = 0.9924), respectively. The QB-ICA had a wide linear range of 0.1–100 μg/kg in suckling pig feed and piglet feed and 0.25–100 μg/kg in sow feed and laying duck compound feed. The LOD values of QB-ICA for AMD in the four feed samples were 0.125, 0.187, 0.076, and 0.191 μg/kg, which met the maximum residue limit requirement of AMD in feed. The above results suggested that the QB-ICA can be used for the simultaneous detection of AFB1 and AMD in feed.
Figure 6. Standard calibration curves for AFB1 in BsMAb were established by plotting FIT10 against the logarithm of different concentrations of AFB1 in (A) suckling pig feed, (B) sow feed, (C) piglet feed, and (D) laying duck compound feed.
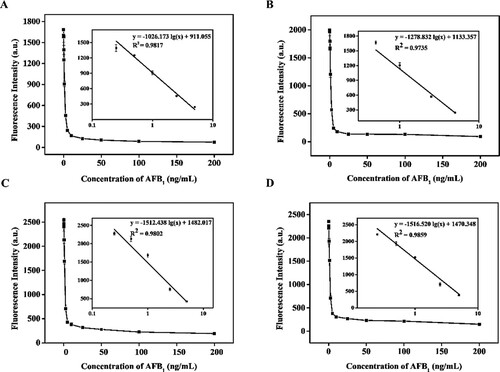
Figure 7. Standard calibration curves for AMD in BsMAb were established by plotting FIT20 against the logarithm of different concentrations of AMD in (A) suckling pig feed, (B) sow feed, (C) piglet feed, and (D) laying duck compound feed.
3.5.2. Recovery experiments of the QB-ICA in detecting AFB1 and AMD in actual samples
Recovery experiments for BsMAb were performed by using the developed QB-ICA in suckling pig feed, piglet feed, sow feed, and laying duck compound feed samples. reveals that the average recovery rates of QB-ICA were 107.45%–150.87% with CV of 1.88%–5.39% in suckling pig feed samples, 91.55%–135.15% with CV of 3.48%–7.30% in sow feed samples, 84.30%–104.20% with CV of 2.87%–8.41% in piglet feed samples, and 93.85%–103.38% with CV of 3.09%–4.14% in laying duck compound feed samples for AFB1 detection. As shown in , the recovery rates ranged from 92.26% to 119.94% with CV of 6.52%–10.71% in suckling pig feed samples, from 93.90% to 138.42% with CV of 1.49%–7.44% in sow feed samples, from 91.62% to 127.96% with CV of 3.65%–11.36% in piglet feed samples, and from 96.20% to 113.29% with CV of 3.29%–10.81% in laying duck compound feed samples for AMD detection. All CVs were below 15%, demonstrating that the developed QB-ICA is reliable for the simultaneous detection of AFB1 and AMD in feed.
Table 1. Recovery rates and coefficients of variation of QB-ICAs for AFB1 at different standard concentrations in four kinds of feeds (n = 3)
Table 2. Recovery rates and coefficients of variation of QB-ICA for AMD at different standard concentrations in four kinds of feeds (n = 3)
4. Conclusions
A convenient multiplexed immunochromatographic assay based on BsMAb was first established to simultaneously detect AFB1 and AMD in feed, which could possess two different antigen binding sites. The LOD values of QB-ICA for AFB1 in suckling pig feed, piglet feed, sow feed, and laying duck compound feed samples were 0.188, 0.221, 0.233, and 0.306 μg/kg, respectively, which met the maximum limit requirement of AFB1 in feed. The LOD values of QB-ICA for AMD in the same feed samples were 0.125, 0.187, 0.076, and 0.191 μg/kg, respectively, which also met the maximum residue limit requirement of AMD in feed. In addition, CRs and recovery experiments demonstrated that the QB-ICA we developed is highly specific and reliable for the simultaneous detection of AFB1 and AMD in feed. Hence, QB-ICA is an effective rapid screening method for simultaneously detecting AFB1 and AMD in feed and has enormous potential for the on-site simultaneous detection of hazardous substances in feed and food.
Supplemental Material
Download MS Word (3.7 MB)Acknowledgements
This work was supported by Key Research and Development Program of Jiangxi Province (20203BBF63030), the Earmarked Fund for the Jiangxi Agriculture Research System (JXARS-03).
Disclosure statement
No potential conflict of interest was reported by the author(s).
Data availability
The data used to support the findings of this study are included within the article.
Additional information
Funding
References
- Cao, M., Parthemore, C., Jiao, Y., Korman, S., & Chen, X. (2021). Characterization and monitoring of a novel light-heavy-light chain mispair in a therapeutic bispecific antibody. Journal of Pharmaceutical Sciences, 110(8), 2904–2915. https://doi.org/10.1016/j.xphs.2021.04.010
- Dong, B., Li, H., Mari, G., Yu, X., Yu, W., Wen, K., Ke, Y., Shen, J., & Wang, Z. (2019). Fluorescence immunoassay based on the inner-filter effect of carbon dots for highly sensitive amantadine detection in foodstuffs. Food Chemistry, 294, 347–354. https://doi.org/10.1016/j.foodchem.2019.05.082
- Dong, H., An, X., Xiang, Y., Guan, F., & Guo, Y. (2020). Novel time-resolved fluorescence immunochromatography paper-based sensor with signal amplification strategy for detection of deoxynivalenol. Sensors, 20(22), 6577. https://doi.org/10.3390/s20226577
- Guo, Y., Liu, S., Gui, W., & Zhu, G. (2009). Gold immunochromatographic assay for simultaneous detection of carbofuran and triazophos in water samples. Analytical Biochemistry, 389(1), 32–39. https://doi.org/10.1016/j.ab.2009.03.020
- Hamid, J., Mohammad, R., Mohammad, D., Mona, A., Khalil, A., & Mohammad, T. (2018). A novel electrochemical aptasensor for detection of aflatoxin M1 based on target-induced immobilization of gold nanoparticles on the surface of electrode. Biosensors and Bioelectronics, 117, 487–492. https://doi.org/10.1016/j.bios.2018.06.055
- Hu, H., Xia, J., Ding, N., Xiong, Y., Xing, K., Fang, B., Huo, X., & Lai, W. (2022). A novel method based on Ag-Au nanorings with tunable plasmonic properties for the sensitive detection of amantadine. Journal of Hazardous Materials, 431, 128498. https://doi.org/10.1016/j.jhazmat.2022.128498
- Hu, L., Luo, K., Xia, J., Xu, G., Wu, C., Han, J., Zhang, G., Liu, M., & Lai, W. (2017). Advantages of time-resolved fluorescent nanobeads compared with fluorescent submicrospheres, quantum dots, and colloidal gold as label in lateral flow assays for detection of ractopamine. Biosensors and Bioelectronics, 91, 95–103. https://doi.org/10.1016/j.bios.2016.12.030
- Hu, S., Li, D., Huang, Z., Xing, K., Chen, Y., Peng, J., & Lai, W. (2018). Ultra-sensitive method based on time-resolved fluorescence immunoassay for detection of sulfamethazine in raw milk. Food and Agricultural Immunology, 29(1), 1137–1149. https://doi.org/10.1080/09540105.2018.1520816
- Hua, X., Wang, L., Li, G., Fang, Q., Wang, M., & Liu, F. (2013). Multi-analyte enzyme-linked immunosorbent assay for organophosphorus pesticides and neonicotinoid insecticides using a bispecific monoclonal antibody. Analytical Methods, 5(6), 1556–1563. https://doi.org/10.1039/c3ay26398c
- Huo, X., Wang, S., Lai, K., & Peng, J. (2021). Sensitive CG-ICA based on heterologous coating antigen and mAb prepared with carbons-linker immunogen. Food and Agriculyural Immunology, 32(1), 727–739. https://doi.org/10.1080/09540105.2021.1987393
- Lai, X., Lv, X., Zhang, G., Xiong, Z., & Peng, J. (2020). Highly specific anti-tylosin monoclonal antibody and its application in the quantum dot bead-based immunochromatographic assay. Food Analytical Methods, 13(12), 2258–2268. https://doi.org/10.1007/s12161-020-01846-9
- Li, R., Wen, Y., Yang, L., Liu, A., Wang, F., & He, P. (2021). Dual quantum dot nanobeads-based fluorescence-linked immunosorbent assay for simultaneous detection of aflatoxin B1 and zearalenone in feedstuffs. Food Chemistry, 366, 130527. https://doi.org/10.1016/j.foodchem.2021.130527
- Li, Y., Liu, L., Kuang, H., & Xu, C. (2020). Preparing monoclonal antibodies and developing immunochromatographic strips for paraquat determination in water. Food Chemistry, 311, 125897. https://doi.org/10.1016/j.foodchem.2019.125897
- Lou, D., Ji, L., Fan, L., Ji, Y., Gu, N., & Zhang, Y. (2019). Antibody-oriented strategy and mechanism for the preparation of fluorescent nanoprobes for fast and sensitive immunodetection. Langmuir, 35(14), 4860–4867. https://doi.org/10.1021/acs.langmuir.9b00150
- Manizan, A., Lethicia, Michalina, O., Isabelle, P., Campbell, K., Rose, K., & Christopher, E. (2018). Multi-mycotoxin determination in rice, maize and peanut products most consumed in cote d'Ivoire by UHPLC-MS/MS. Food Control, 87, 22–30. https://doi.org/10.1016/j.foodcont.2017.11.032
- Mohammad, O., Shadab, K., Saba, T., Swaleha, Z., & Dipshikha, C. (2014). An alternative chemical redox method for the production of bispecific antibodies: Implication in rapid detection of food borne pathogens. Plos One, 9(3), e91255. https://doi.org/10.1371/journal.pone.0091255
- Monbaliu, S., Van Poucke, C., Detavernier, C., Dumoulin, F., Mario, V., Schoeters, E., Van Dyck, S., Averkieva, O., Van Peteghem, C., & De Saeger, S. (2010). Occurrence of mycotoxins in feed as analyzed by a multi-mycotoxin LC-MS/MS method. Journal of Agricultural and Food Chemistry, 58(1), 66–71. https://doi.org/10.1021/jf903859z
- Peng, D., Wei, W., Pan, Y., Wang, Y., Chen, D., Liu, Z., Wang, X., Dai, M., & Yuan, Z. (2017). Preparation of a monoclonal antibody against amantadine and rimantadine and development of an indirect competitive enzyme-linked immunosorbent assay for detecting the same in chicken muscle and liver. Journal of Pharmaceutical and Biomedical Analysis, 133, 56–63. https://doi.org/10.1016/j.jpba.2016.11.009
- Piotr, P., Magdalena, G., Magdalena, Ś., & Hanna, M. (2020). A possible antiviral effect of amantadine in an AH1N1 influenza-infected patient-a case report. Anaesthesiology Intensive Therapy, 52(1), 67–69. https://doi.org/10.5114/ait.2020.93137
- Pradeepkiran, J., & Bhaskar, M. (2018). Analysis of aflatoxin B1 in contaminated feed, media, and serum samples of cyprinus carpio L. By high-performance liquid chromatography. Food Quality and Safety, 2(4), 199–204. https://doi.org/10.1093/fqsafe/fyy013
- Seckinger, A., Delgado, A., Moser, S., Moreno, L., Neuber, B., & Anna, G. (2017). Target expression, generation, preclinical activity, and pharmacokinetics of the BCMA-T cell bispecific antibody EM801 for multiple myeloma treatment. Cancer Cell, 31(3), 396–410. https://doi.org/10.1016/j.ccell.2017.02.002
- Shu, Q., Wang, L., Ouyang, H., Wang, W., Liu, F., & Fu, Z. (2017). Multiplexed immunochromatographic test strip for time-resolved chemiluminescent detection of pesticide residues using a bifunctional antibody. Biosensors & Bioelectronics, 87, 908–914. https://doi.org/10.16/j.bios.2016.09.057
- Vladimir, O., Frantisek, M., Jakub, T., & Yann, G. (2016). Mycotoxins as human carcinogens-the IARC monographs classification. Mycotoxin Research, 33(1), 65–73. https://doi.org/10.1007/s12550-016-0265-7
- Wang, D., Zhang, Z., Li, P., Zhang, Q., Ding, X., & Zhang, W. (2015). Europium nanospheres-based time-resolved fluorescence for rapid and ultrasensitive determination of total aflatoxin in feed. Journal of Agricultural & Food Chemistry, 63(47), 10313–10318. https://doi.org/10.1021/acs.jafc.5b03746
- Wang, F., Wang, H., Shen, Y., Li, Y., Dong, J. X., Xu, Z., Yang, J., Sun, Y., & Xiao, Z. (2016). Bispecific monoclonal antibody-based multianalyte ELISA for furaltadone metabolite, malachite green, and leucomalachite green in aquatic products. Journal of Agricultural and Food Chemistry, 64(42), 8054–8061. https://doi.org/10.1021/acs.jafc.6b03233
- Wu, S., Zhu, F., Hu, L., Xi, J., Xu, G., Liu, D., Guo, Q., Luo, K., & Lai, W. (2017). Development of a competitive immunochromatographic assay for the sensitive detection of amantadine in chicken muscle. Food Chemistry, 232, 770–776. https://doi.org/10.1016/j.foodchem.2017.04.058
- Wu, Y., Zhou, Y., Huang, H., Chen, X., Leng, Y., Lai, W., Huang, X., & Xiong, Y. (2020). Engineered gold nanoparticles as multicolor labels for simultaneous multi-mycotoxin detection on the immunochromatographic test strip nanosensor. Sensors and Actuators B: Chemical, 316, 128107. https://doi.org/10.1016/j.snb.2020.128107
- Zhang, X., Liu, L., Cui, G., Song, S., & Xu, C. (2019). Preparation of an anti-isoprocarb monoclonal antibody and its application in developing an immunochromatographic strip assay. Biomedical Chromatography, 33(11), e4660. https://doi.org/10.1002/bmc.4660
- Zhao, J., Wang, Z., Chen, Y., Peng, D., & Xianyu, Y. (2021a). Horseradish peroxidase-catalyzed formation of polydopamine for ultra-sensitive magnetic relaxation sensing of aflatoxin B1. Journal of Hazardous Materials, 419, 126403. https://doi.org/10.1016/j.jhazmat.2021.126403
- Zhao, X., Jin, X., Lin, Z., Guo, Q., Liu, B., Yuan, Y., Yue, T., & Zhao, X. (2021b). Simultaneous rapid detection of aflatoxin B1 and ochratoxin A in spices using lateral flow immuno-chromatographic assay. Foods (basel, Switzerland), 10(11), 2738. https://doi.org/10.3390/foods1012738