
IMPACT
Claims are made that up to 80% of the demand entering public services can be classified as unnecessary, or avoidable, ‘failure demand’ that is generated through errors or aspects of poor delivery system design. This article shows how failure demand was identified at one police service, the extent to which it was seen to occur and the practices that were changed to reduce failure demand. Much of the same methodology can be applied to other public services but the article demonstrates that changes to reduce failure demand must focus on system change.
ABSTRACT
Police forces, like much of the UK public sector, have struggled to meet the demand placed upon them because of real-term funding cuts and increases in some types of demand. Where increases in resource are not possible, attention has to be paid to the reduction of demand or the increase in effective capacity through efficiency gains. Within the literature, ‘failure demand’ is seen as unnecessary demand, caused by errors and repeated work that could be eliminated. This article reports on the analysis of failure demand at one police force as a method of sustainably reducing demand. The findings suggest 30% of non-urgent demand entering the system could be avoided. However, not all of this avoidable demand has been eliminated so far. The article explores the necessary system changes to reduce failure demand and the management challenges to achieve effective change.
Introduction
After the financial crisis of 2007, UK police services experienced a number of real-terms cuts to funding (HMIC, Citation2011; Elliott-Davies et al., Citation2016). In the period 2009–2016, the number of full-time equivalent police officers fell by 14% according to the Institute for Fiscal Studies (Disney & Simson, Citation2017). In back offices, the situation is potentially worse—with a 23% reduction in numbers. Demand patterns have also changed and this has possibly confused our understanding of the workload on police forces. Recorded crime fell by 30% between 2002 and 2011, to later stabilize, but there has also been a change in the mix in demand type away from car theft, robbery and burglary towards white-collar crime, internet offences, sex crime and human trafficking (ONS, Citation2020).
From 2014, these problems seem to have become more obvious, leading to a series of comments in the 2017 review of UK policing by the Inspectorate of Constabulary (HMICFRS, Citation2018a):
[There are] major concerns that policing is under significant stress. On occasions, that stress stretches some forces to such an extent that they risk being unable to keep people safe in some very important areas of policing … About a quarter of forces are all too often overwhelmed by the demand they face, resulting in worrying backlogs of emergency jobs, with officers not attending incidents promptly, including those involving vulnerable people.
All forces are addressing demand and capacity issues. A recent report (NPCC, Citation2017) highlighted some of the ways in which the issues were being tackled at a national level. One of the main innovations introduced has been the National Decision Model (College of Policing, Citation2013), which provides a foundation for consistent decision-making. Supporting this is the ‘THRIVE+’ methodology that applies such factors as threat, risk, harm and vulnerability when assessing the need to attend incidents.
In practice, emergency demand only accounts for between 15–20% of all demand entering the system via control centres (such as the emergency 999 service). Non-urgent demand accounts for more of the total workload and there is other back office work, such as follow-up investigation, that absorbs policing resources. This article provides a follow-up study of a collaborative approach to reduce non-urgent demand undertaken in Gloucestershire Constabulary. A project was launched in 2017 that combined an academic researcher with a ‘senior practitioner fellow’ within Gloucestershire Constabulary. The practitioner was supervised to look at methods of demand management and demand reduction. The primary assessment tool was based around the notion of failure demand (Seddon, Citation2003), which was used as a means of detecting unwanted or unnecessary demand in the system that could theoretically be reduced without a detrimental impact on the customer. This analysis resulted in recommendations that identified how demand could be reduced without reducing the quality of service provided to the local population. From July 2017, a series of changes was implemented based around these recommendations, with the expectation that demand on the system would be reduced. This article reports on these changes.
Capacity and demand management in public services
There is a limited theoretical base to the management of demand and capacity in the public sector. Most capacity management theory has emerged from private sector studies, with the exception of some work in public healthcare settings (for example McCaughey et al., Citation2015). Walley (Citation2013) highlights a key difference in how capacity and demand are managed between the public and private sectors. In the private sector, resource often follows demand as each customer usually pays directly for the products or services they are consuming. This leads to revenue-centric decision-making where capacity can be expanded to meet additional funded demand, where it is profitable to do so. By contrast, public services have annual budgetary reviews where the resources provided to meet demand are determined in advance and based around public spending plans. Any short-term demand changes have to be absorbed by the services because additional funding is rarely provided. In the longer term, the relationship between demand and resource provision can still be tenuous as budgetary constraints created by political decision-making can override any intelligence associated with demand growth. Hence public services develop a cost-centric approach to demand management where steps are taken to limit how much demand is accepted into services that are strained by resource shortages. In many services this often requires some form of rationing (for example Aaron & Schwartz, Citation1990). A consequence of the cost-centric approach is that there is less motivation to study demand patterns in ways that private sector organizations do, as this does not help generate future revenues. Hence knowledge and understanding of demand patterns, and the resource consumption consequences, can be limited. Instead, public sector organizations have been observed to focus more attention on limiting demand (Walley & Adams, Citation2019a) through mechanisms such as thresholds, prioritization, redesigning services and refusal to serve ‘excess’ demand. This can be problematic as many of the practices either prevent or inhibit access to services, rather than meet demand. In other cases, especially when services are under pressure, demand is passed on to or spills over to other agencies. It has already been seen in healthcare (Walley et al., Citation2019) and there are persistent issues involving the role of police in instances where the underlying demand is created by failure to deal with mental health demand (NPCC, Citation2017; HMICFRS, Citation2018b).
Public services often provide critical services where demand is not easily controlled or influenced. Although the demand trying to enter the system will usually conform to fairly regular seasonal patterns based around time-of-day and day-of-the-week, there will always be variation that creates uncertainty about how much capacity to provide. Bateman et al. (Citation2014) highlight this challenge suggesting that public services need to be ‘demand ready’, i.e. in a position to respond to demand where and when it happens. Consequently, Lean approaches to capacity and flow, such as ‘demand pull’, cannot be easily applied. An additional challenge is that services are monitored for efficiency (with the implicit aim of high utilization of resources) where the well-known trade-off associated between utilization and responsiveness applies. Services such as police will always struggle to be high utilization, responsive organizations.
Capacity and demand management practices within policing have not been widely researched. The NPCC (Citation2017) report was arguably the first attempt in decades to codify and establish basic demand and capacity management practices. Boulton et al. (Citation2017) also produced a study of demand patterns within policing, but this was largely based around crime types, rather than the management of demand and capacity. Laufs et al. (Citation2020) published a scoping paper summarising the existing literature on policing demand management, which remains limited in its scope. They model of the types of demand that occur within policing. Reactive (or public) demand is what most studies focus on—the demand that comes in via contact centres and other sources from members of the public who are reporting crime or need other support. Protective demand is where police anticipate likely demand and deploy resources. An example would be providing a presence at airports and railway stations. Finally, there is organizational demand, which is the work done behind the scenes to facilitate operations. Laufs et al. (Citation2020) also identify the complex, adaptive nature of the system that meets policing demand. We suggest this conditions how demand management problems can be sustainably addressed, requiring an approach that both acknowledges the system behaviour and accepts that the system will adapt to any changes made.
There have been some studies of policing capacity management. For example the flow of work through police custody suites has been studied, showing how capacity and flow can be partially managed using existing capacity management techniques (Ritchie & Walley, Citation2016). More recently, a study of 15 UK forces established the current demand and capacity management practices (Walley & Adams, Citation2019b); few forces translated call volumes into demand for resources, and the focus is more likely to be on call response times than how incidents can be handled.
The Vanguard method and failure demand
The Vanguard method (Seddon, Citation2003) is a widely-used method of implementing Lean thinking in the UK public sector. The OECD, in a review of systems approaches to public service improvement, picked out the Vanguard method as one that had successfully led to process innovation and change (Cook & Tonurist, Citation2012). Marshall (Citation2010) describes the approach as one that views each organization as an holistic system that ‘is always seen in terms of its customers’. External demand is therefore the driver for the design (or redesign) of service systems (Jaaron & Backhouse, Citation2010; Seddon, Citation2008), where the approach starts with a study of demand entering the system, what matters to the customers and the value and purpose of the system. Demand is split into two types: value demand represents what the customers want and is of value to them—and what the system should be designed to do (Jaaron & Backhouse, Citation2014). Failure demand represents the demand in the system that does not provide what customers want or is not of value to them. Seddon’s ideas about value demand emerged before the notion of ‘public value’ (Moore, Citation1995; Benington & Moore, Citation2011), but the two can be connected. Seddon (Citation2008) suggests that the study of demand can be used to learn about what citizens want from their public services. In many cases, this is to provide a specific service, such as removing household waste. In other cases, it is to solve problems such as stopping anti-social behaviour. The study of demand allows a better understanding of local patterns, customer groups with similar needs and linked demands. The study of value demand possibly translates into public value where it allows a strategic approach to the development of services that meet the identified needs.
A key message from the literature is that failure demand inflates demand figures, making the underlying workload appear higher. Seddon (Citation2009, p. 33) encapsulated the potential value of understanding what failure demand there is: ‘In service organizations … failure demand often represents the greatest lever for performance improvement. In financial services it can account for anything from 20 to 60 per cent of all customer demand … in local authorities and police forces as much as 80–90 are avoidable and unnecessary’.
Seddon’s earliest introduction to failure demand applies the concept in the context of call centres (Seddon, Citation1992), both in private and public sectors. Case examples of the applications of failure demand and the Vanguard method in policing do appear in the literature. For example, Guilfoyle (Citation2012) provides the example of releasing capacity through the elimination of non-value work in an area within West Midlands Police. In this case, patterns of demand were studied to identify where local action could result in a drop in crime and a consequent fall in police time needed to deal with that crime. Bailey and Watson (Citation2012) illustrate demand measurement in Cheshire Constabulary. They took a two-week sample of demand and classified it in terms of nature of call for service—see .
Table 1. Categorization of police calls for service (Bailey & Watson, Citation2012).
Analysis of this demand allowed officers to pilot a redesigned service, where teams were restructured to resolve demand as it came in, doubling the number of urgent incidents they could attend in the appropriate time.
Success stories of reducing failure demand within the public sector include Jackson et al. (Citation2008) who looked at a local council’s housing service call centre and made improvements that greatly improved the service provided at a lower unit cost. Other work has demonstrated the particular applicability of the Vanguard method to situations involving contact call centres (Jaaron & Backhouse, Citation2011a & Citation2011b). Beyond examples of housing, there is evidence of this work being applied in grant services (Zokaei, Citation2011), social care (O’Donovan, Citation2011) and electrical distribution (Hopkinson, Citation2011).
The Local Government Association has developed perspectives of excessive demand where unwanted demand might originate from sources beyond simple process failure (IDEA, Citation2008; LGA, Citation2013; Randle & Kippin, Citation2014): see .
Table 2. Types of unwanted demand (Randle & Kippin, Citation2014).
This framework is useful in that it highlights that some demand is generated by factors other than just errors or rework. Existing cultural norms and protocols inside organizations can encourage demand where there is no underlying need. In other cases demand could be limited by prior demand prevention activities. However, this approach to demand management is not seen as consistent with a service Lean approach by Seddon (Citation2014).
The literature also contains a note of caution when measuring failure demand. In 2008, local government managers were asked to measure failure demand through National Indicator 14 (IDEA, Citation2008). Measurement started in October 2008 for first reporting in April 2009. This measure was imposed in a situation where there was no underlying systems perspective and considerable implementation barriers to adoption (LGITU, Citation2008) and so the measure was swiftly withdrawn (Martin, Citation2010). The failure of the national indicator highlights the issues of extracting one aspect of an integrated systems methodology and applying it by itself. Seddon (Citation2014) comments on the problems of using Lean tools out of context, and without the other elements of the holistic approach, suggesting the use of a toolkit leads to ineffective implementation. The partial use of the concepts creates a further issue where failure demand is continually reported and becomes part of a performance management system. The underlying organizational culture must be one where it is acceptable to report errors so that action can be taken to eliminate them. Many public services do not readily have such a cultural fit.
The case organization
Gloucestershire Constabulary covers an area of 1,000 square miles with a population of 600,000. It contains two large towns and has a number of special policing tasks because the county hosts two royal residences and GCHQ (the UK’s intelligence, cyber and security agency). The county also hosts some large events, such as the National Hunt Festival. There are typically 157,000 police incidents per year with a recently increased 2020/21 budget of £132 million and a workforce of planned as 2,150 FTE police and staff. At the time of the study in 2017 there were 16% fewer employees when compared with 2010.
At the time of the study, Gloucestershire Constabulary received the HMICFRS inspection report for 2016, which provides a good snapshot of the issues the force was actively addressing through a series of structured changes (HMICFRS, Citation2017). The report shows that calls for assistance per 1000 population were above average for forces across England and Wales, but crime was 70% of the national average, indicating non-crime calls are a significant portion of demand. The force had a much greater than average fall in recorded crime over the previous five years (19% compared with 3.4% nationally). It was dealing with lower levels of organized crime (one third of the average) and had 30% higher instances of anti-social behaviour. Victim satisfaction to June 2016 was above the 83.3% average at 87.4%. The force was praised for its multi-agency safeguarding hub, its work with community psychiatric nurses and overall awareness of mental health issues. Despite these relatively positive figures, the HMIC were requiring improvement in crime prevention, tackling anti-social behaviour, investigating crime, and reducing reoffending. The force was graded inadequate at tackling organized crime. In the latest report (HMICFRS, Citation2019), all of these effectiveness measures improved to be graded as ‘good’, with the exception of tackling organized crime which still needs improvement.
Methodology
The original work was conducted over a six-month period from January to July 2017. Gloucestershire Constabulary appointed a senior practitioner fellow for this period from within its workforce to work alongside an academic contributor. The aim was to investigate the use of failure demand as an approach to reducing demand sustainably. It was not the intention to replicate the Vanguard approach—but the term ‘failure demand’ was used as a means of conveying the ideas of value and non-value work.
Our study took a sample of incidents originally graded as non-urgent that occurred during the first two weeks of February 2017. In order to include data that fairly represented all days of the week and times of day, the sample was stratified, and a total of 534 incidents across this time period was re-examined. This period was chosen for a number of reasons. First, the data does not contain a significant event such as Christmas, where offences such as anti-social behaviour increase, skewing the types of incident within the data. Second, the data was recent, with access to those who handled the incidents still available for discussion if needed, but long enough ago to expect the incidents to be closed. The data showed that the mix of incidents was representative of the overall demand mix over the year.
In March 2017, Gloucestershire Constabulary police officers from a wide range of roles were brought together temporarily to carry out the main task of listening to and assessing a sample of recorded calls, emails, linked incident logs and crime logs. Initial training was given to all participants where the purpose of the exercise was defined as the assessment of demand to identify wasted resource caused by unnecessary work: see . They were given advice on the grading of calls using the THRIVE+ model of assessment and case incidents were used to debate grading of urgency and identify waste. Twelve officers were employed part time over a period of two weeks to re-analyse the incidents. Five different incidents were given to all assessors to identify any inconsistencies in their recording of data. This highlighted a wider variation in the grading of urgency among less-experienced officers, but there was no difference in their assessment of repeated activities. Examples of failure demand from other sectors were initially used to demonstrate the concept and, after the first batch of samples was analysed, there was a discussion of what kinds of police demand could be classed as failure demand. This built up a comprehensive list of potential examples, with ongoing debriefs at the end of each session to generate other suggestions.
Figure 1. Example training incident.
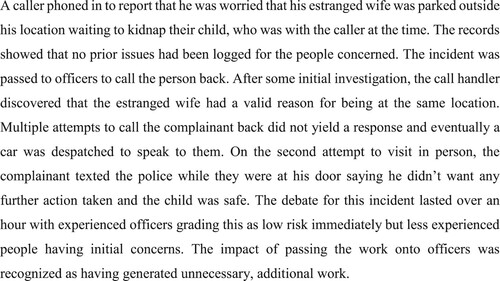
For each incident in a sample, one officer listened to the original call that came into the control room and recorded these details. The incident logs were then studied to determine any further information about the incident that may have been recorded, either at the time, or at a later date. Officers were able to follow up on what the actual response was, the resources deployed and the outcome of the incident. A form for each incident was completed, summarising the key details of the incident including:
The incident type recorded at the start and end of the incident.
The urgency grading of the call.
Characteristics of the call, such as the clarity of the caller and the dynamics of the incident.
The resources deployed in practice.
The resources necessary to attend to the incident, and the speed and method of response if the ideal service were to be delivered.
The outcomes of the incident, including degree of public satisfaction with the response.
The levels of failure demand, including the number of repeat attendances at an incident, or other avoidable work arising.
The ideal service that should have been offered to the caller, including the type of contact and the speed of response.
Findings
The 534 incidents assessed covered a wide range of incident types, with anti-social behaviour (12%), suspicious behaviour (10%) and concern for welfare (8%) being the most common types of non-urgent incident reported. The frequency of the services needed by these incidents is shown in .
Figure 2. The frequency of the value of services needed from the sample incidents.
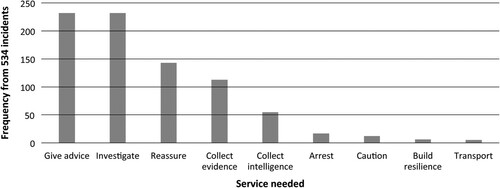
includes data from up to two types of service needed for any one incident, so 534 incidents generated 815 separate necessary actions.
Analysis of failure demand
Within this sample, avoidable demand happened in a variety of ways including:
Where a previous opportunity to resolve a problem had been missed, so there were several linked incidents prior to this one.
Repeated calls between the police and the caller or victim, exchanging further information or giving advice which could have been done during the first call.
Callers making follow-up calls to ask about police attendance or action that had not yet been forthcoming.
Police attending an address or trying to establish phone contact with the caller or victim, and them being unavailable.
Excessive service provision, such as attending non-police matters.
Quantifying repeat demands
In our sample, assessors indicated whether there were any repeat of failure demands in the incident (for example rework) and, if so, how many repeats or failures they observed in the recording and incident record. Typical failure demands discussed included incidents where a caller was reporting the same unresolved problem, emails/calls to chase attendance or an update about an incident, and attempts by police personnel to get in touch with a caller when they were not at home. Repeat or failure demand was found in 168 incidents (32%), with between one and seven instances of such demands per incident. Once the whole sample was analysed, 534 separate incidents needed an extra 353 interventions due to failure demand, making a total of 1168 separate actions created by the calls. The workload due to failure demand was 30% of the total actions. Assessors deemed 76% of the calls with no repeat activity to have satisfied the needs of the callers. Where failure demand was present, only 58% of calls satisfied needs to the same extent.
An additional analysis investigated links between the quality of the service and response times. Response times (to the closure of an incident) did not appear to influence levels of satisfaction. However, the analysis did show that response times for less urgent incidents were often better than for more urgent incidents. Where incidents needed a response within one hour, this was achieved 33% of the time, with 32% not attended within 12 hours. By contrast, 40% of those calls graded as needing attention within four hours were attended inside an hour, with 72% inside the target time.
System changes proposed
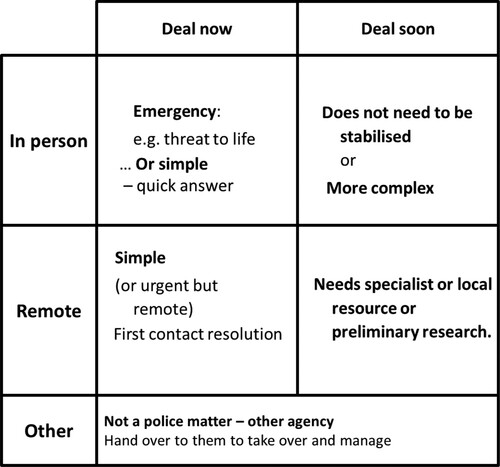
Over half of incidents (55%) could have been dealt within that first call, but this was not happening in all cases. Where callers are told they will be called back, there is the possibility of not being able to re-contact the caller. It is also likely that a response to the incident will be delayed. The nature of the response also needs to be appropriate for the call. However, the prioritization system did not encourage immediate resolution of non-urgent incidents, meaning that two-thirds of calls that could have been handled remotely by the contact centre were, instead, delayed.
Calls were categorized into a matrix combining the speed of response and nature of contact—see . Just two categories of speed were defined: Deal now indicating an instant response, whereas ‘Deal soon’ suggests there is a delay caused by the need to identify the right available resource to attend to the incident. Further reflection with the call assessment team highlighted a small cluster of calls (3%) where the issues would have been better dealt with by another agency. It was concluded that the control system could significantly reduce workload by simplifying the prioritization system and by generating capabilities to resolve incidents remotely. The proportion of incidents dealt with immediately, in person, needed only a minor adjustment to eliminate some avoidable or excessive service provision.
Figure 3. Suggested revised approach to call handling to reduce failure demand.
System changes implemented
Following the study there was a realization that failure demand required a broader focus across the organization, to deal with the underlying system issues. Gloucestershire Constabulary commenced a programme to connect aspects of demand and public service. The following core areas of improvement were identified:
Channel management: One of the changes experienced by all police forces over the past few years has been the change in the channels through which demand enters and is met (for example through internet contact). Efforts were made to ensure this demand is channelled correctly to avoid additional contact by other means.
Control room improvement: In 2018, a major redesign of the control room processes was undertaken. The new system allowed incoming demand to be tracked in real time, with control limits established to identify situations where demand was exceeding expectations. Additionally a new ‘operating state’ system was introduced. This shows the force’s ability to cope with demand and can trigger the movement of resource from lower priority areas to urgent response areas over a short period of time.
Neighbourhood policing and partnerships: One of the longer term sets of changes was the integration of neighbourhood policing activities with other parts of the system, both internally and externally. Partnerships with other service providers were seen as ways of reducing demand and also making the provision of the service more efficient. An example of this is more effective triage and grading of the incidents where there is a mental health component to an incident (30% of the total).
Crime command: This is where reactive demand is dealt with, but it also needs to be integrated with proactive demands such as safeguarding. The study identified the opportunities to reduce reactive demand by provision of some proactive work.
People strategy: The work also fed through to a number of HR-related activities to assist with failure demand reduction, including improvements to leadership development, CPD opportunities, wellbeing, and reward and recognition systems.
Control room changes
Three recommendations were made about the control room:
Call handlers should be working towards the development of a sustainable (affordable) solution to each caller’s needs, and not just acting as a risk filter for urgent and non-urgent calls.
THRIVE+ should be used to structure questioning to create consistent responses to similar incidents across the range of call handlers.
Response should be agnostic of resource constraints, to build capacity and systems to ensure resources meet the actual demands present, to avoid any bias towards upgrading or downgrading assessments due to lack of capacity.
At the time of this study Gloucestershire Constabulary used five incident grades: Grade 1—urgent (excluded from the study); Grade 2.1—requiring attendance within one hour; Grade 2—requiring attendance within four hours; Grade 3—requiring attendance on a scheduled basis; Grade 4—not requiring attendance.
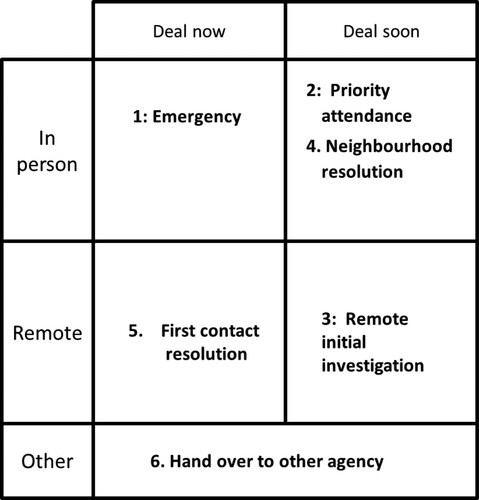
As a result of the study’s recommendations, the grading model was restructured. Instead of five levels of priority, six means of resolving the demand were put in their place. This means that the primary aim of the call handler is not to simply decide how long an incident can wait but, instead, work out how best to resolve the issue. Given the increased role for call handlers to resolve some issues would increase their workload, staffing was adjusted and a team was introduced to deal with remote resolution. This means that some calls are handed over from the call handler for resolution, but contact with the call is not lost. shows how the six new types of response fit with the matrix devised.
Figure 4. The six responses to demand based around contact and response time.
Impact of changes
A performance tracking system was developed to monitor the impact of the new grading system, dividing the demand resolution into the five categories shown in . Prompt resolution is where a response officer is dispatched to attend an incident without unnecessary delay. A scheduled response is one where the attendance is in person but this is delayed (for instance scheduled to be attended by a local team). Remote resolution is where an incident is closed without in-person attendance, but the new category of first contact resolution, where there is no delay in that resolution, was introduced. The proportion of incidents attended by partner agencies was measured for the first time in July 2018.
The important point is that the newer methods of handling demand consume less resource. Response officers are the more expensive resource to deploy, especially where this also includes resources such as patrol cars. Local investigation is more efficient where it can be scheduled, as the utilization of resource can be managed here through careful scheduling, but it still incurs costs associated with travelling and longer in-person visits. First contact resolution is potentially the most efficient form of resolution as it does not need additional resources and it reduces the number of repeat contacts.
shows how the changes introduced in July 2018 reduce the amount of scheduled in-person contact by 65%, as measured by the contact system. In the first full month with the new system, 43% of all police response was a remote or first contact resolution, compared with 26% for the same month the year before.
Figure 5. Incident demand and resolution method.
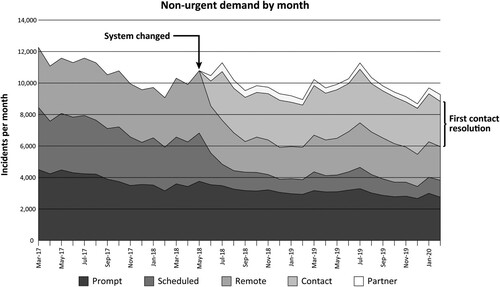
A further comparison of demand percentages sampling a year before and after the change was implemented is shown in . The system did not collect data on demand passed to other agencies prior to June 2018, but the study had already shown this figure was below 0.3% of total demand. We should note there is a consistent pattern of reducing demand coming into the control room. This is consistent with a general trend of non-urgent demand reduction and we are not suggesting that our work was responsible for this reduction.
Figure 6. Demand changes 2017–2018.
Note: We accept that some calls would have been resolved with first contact in 2017, but these were not recorded in this way prior to 2018.

An estimate based on the survey data would indicate that perhaps 15% of all incident calls were resolved without further contact, but this would include a mix of both first contact and remote investigation solutions recorded as one call. Our own sample shows that the proportion being passed to other agencies was 0.3% in 2017, but this wasn’t known within the tracking system prior to July 2018.
These changes are broadly in line with predictions. It was predicted that up to 3% of non-urgent demand could be passed onto other agencies. It was expected that 55% of non-urgent demand could be dealt with remotely and the actual figure is currently 55.1%. The proportion of demand deemed urgent has increased slightly, so it could be that some demand has been upgraded to urgent as well. The underlying reasons for this are complex, including a change to grading because of the availability of resource or a change in the mix of demand.
Other impacts
Since this work was completed, Gloucestershire Constabulary have continued to monitor their own calls and have done some repeat sampling. The first extension of the work was to include additional calls entering the control room but not recorded as incidents. It was found that 19.5% of calls to the control room via non-emergency lines were to contact an officer or gain an update on a matter already being investigated. This led to a force-wide initiative to ensure staff phone numbers were correct and that contact details were being left with victims.
It was also recognized that failure demand was likely to be more widespread than that identified and that the constabulary should continue to seek to learn. Gloucestershire Constabulary have now introduced a service recovery team. The team triages all expressions of thanks and dissatisfaction, identifying repeated themes that are then captured for review. The team ensure public feedback on service delivery is delivered in learning outcomes. The long-term aim is to bring areas where the constabulary attracts consistent complaints or thanks and review how to learn from them—to reduce failure demand and improve satisfaction.
Discussion
This article has highlighted the extent to which policing organizations need to understand the demand entering the system. The initial focus in most organizations is where a known demand enters the system and resources have to be deployed to meet that demand. Management systems are often set up to measure performance in relation to the responsiveness to this tangible demand. The initial study and subsequent implementation showed that other forms of demand for resource exist within the system as a whole. Any work to review police demand should consider additional demand streams outside of what police send a resource to. The work should acknowledge the multiple ways in which demand enters the system—sometimes in ways that are not formally recorded.
The failure demand approach provides a key insight because it clearly establishes that much of the resource consumption within the system can be self-generated. The initial study showed how a failure to address an incident right first time created extra work and, in this case, the analysis was extended to robustly establish the impact on satisfaction with the service. A key element of the approach was to address shortcomings as a result of system configuration and not more simplistically as a problem of people under-performing.
A success factor was the way in which the application of failure demand analysis was allowed to develop and adapt over time as more knowledge of system behaviour was understood. The Vanguard improvement approach of ‘check–plan–do’ is normally implemented as a precursor to failure demand analysis. Continuous cycles of repeated improvement assessments and interventions are seen by its creators as a learning system (Jackson et al., Citation2008; Jaaron & Backhouse, Citation2014). Even though officers and staff involved were not required to continue with changes beyond those in the analysis, other work was undertaken. The knowledge generated by the improved understanding of demand encouraged further investigation and later episodes of improvement activity. We understand this activity continues to the present day; however, we do not claim this would happen on all other occasions. The context of this work was an organization under pressure to improve and with the time available to carry out improvements. We believe this context favoured an outcome that produced sustained changes.
Consistent with the prior literature, periodic rather than continuous assessment of failure demand achieved much greater benefits (Seddon, Citation2009). It avoids the use of failure demand measures from becoming a performance management tool and keeps it focused within an improvement domain.
We have been able to show that demand for more expensive in-person contact did change in line with initial predictions, although there were also been some changes to the mix of demand entering the system. The revised grading approach and improved remote resolution does offer significant efficiency gains. Response queues reduced and incidents appeared to be progressed in a timely manner. Further scrutiny was applied to this process and it was found that, in high demand periods, the incidents referred for remote resolution were not being processed effectively. Many were purely being recorded and then passed on to local investigation teams. This can be viewed as a system response to the system change. In such a complex, adaptive system, new challenges will emerge where parts of the system become stressed in new ways and the system adapts unofficially through work-arounds and de facto changes in practice. The lesson here is that systems will adapt in unexpected ways and this needs to be monitored both as a further improvement opportunity and to protect the intentions of the initial changes that have been implemented.
Conclusions
Our study is consistent with earlier work that suggests failure demand is present in public service operations. Failure demand analysis is a valuable tool that helps understand demand and highlights how additional work is generated through failures of processes and existing organizational behaviours. In this case, demand entering the system goes through a filtering and prioritization process that can generate extra work unintentionally. The recommendation to make adjustments to the way in which work is prioritized and handled, to achieve one-touch resolution were useful and consistent with practice in other forces. However, this analysis demonstrates why such resolution is an effective way of dealing with non-urgent demand.
It is no surprise that failure demand remained in the system after these changes were made. We would not expect a single cycle of improvement to completely solve the problem. The initial analysis of non-urgent demand acted as a good starting point for further work and greater understanding of how the policing system worked. Once the most obvious and visible source of demand had been tackled, it was then possible to look beyond this for other forms of waste. Consequently, the perspective of what constitutes failure or avoidable demand can evolve over time as learning about system behaviour improves.
Our recommendation is that the work should be repeated periodically as part of continuous improvement. Ideally, the wider check–plan–do, or similar improvement cycle methodology, should be applied. We were struck by the difficulties that junior officers had in grading the urgency of work, and exercises like this could be a good learning opportunity.
A legacy of the work is an ongoing set of planned changes that continue to address further improvement to the system for meeting demand. For example, work has been commenced within the constabulary to develop predictive analytics and demand forecasting. Where other public agencies wish to try a similar approach to demand reduction, we feel there are some important lessons to be learned from this work. First, this intervention avoided one of the biggest risks in that the ‘tool’ of failure demand analysis was accompanied by a series of structured system changes. We believe this type of analysis would work less well where there wasn’t the right mindset, or sufficient time and resources to make appropriate changes. Second, if the recording systems are not in place, demand analysis takes up a lot of resource in its own right and, in the long term, steps need to be taken to make some of this data analysis less resource intensive. Third, we were hampered by a restricted timescale to implement all of the necessary changes and fully record the impact. The work is not a quick fix. Finally, we repeat the clear message, from both the literature (Jackson et al., Citation2008; Jaaron and Backhouse, Citation2014) and our own experience, that the approach is a continuous improvement tool and should not be linked to performance management.
Disclosure statement
No potential conflict of interest was reported by the author(s).
References
- Aaron, H., & Schwartz, W. B. (1990). Rationing healthcare: the choice before us. Science, 247(4941), 418–422.
- Bailey, N., & Watson, S. (2012). No soft option: changing thinking across an entire police force. In C. Pell (Ed.), Delivering public services that work (pp. 47–74). Triarchy Press.
- Bateman, N., Hines, P., & Davidson, P. (2014). Wider applications for Lean: an examination of the fundamental principles within the public sector. International Journal of Productivity and Performance Management, 63(5), 550–568.
- Benington, J., & Moore, M. H.2011). Public value, theory and practice. Palgrave Macmillan.
- Boulton, L., McManus, M., Metcalfe, L., Brian, D., & Dawson, I. (2017). Calls for police service: Understanding the demand profile and the UK police response. The Police Journal: Theory, Practice and Principles, 90(1), 70–85.
- College of Policing. (2013). The National Decision Model. National Decision Model (college.police.uk). Retrieved 20/08/21.
- Cook, J. & Tonurist, P. (2012). From transactional to strategic: systems approaches to public service challenges. The observatory of public sector innovation. OECD.
- Disney, R., & Simson, P. (2017). Police workforce and funding in England and Wales. Institute of Fiscal Studies, IFS Briefing Notes BN208.
- Elliott-Davies , M., Donnelly, J., Boag-Munroe, F., & Van Mechelen, D. (2016). ‘Getting a battering’: The perceived impact of demand and capacity imbalance within the police service of England and Wales: A qualitative review’. Police Journal: Theory, Practice and Principles, 89(2), 93–116.
- Guilfoyle, S. (2012). What works and what matters: West Midlands Police’. In C. Pell (Ed.), Delivering Public Services that Work (pp. 33–36). Triarchy Press.
- HMIC. (2011). Adapting to austerity. UK.
- HMICFRS. (2017). PEEL: Police effectiveness 2017 An inspection of Gloucestershire Constabulary.
- HMICFRS. (2018a). Police forces good at keeping people safe but showing strain, https://www.justiceinspectorates.gov&.uk/hmicfrs/news/news-feed/police-forces-good-at-keeping-people-safe-but-showing-strain/.
- HMICFRS. (2018b). Policing and mental health, picking up the pieces.
- HMICFRS. (2019). PEEL: Police effectiveness, efficiency and legitimacy 2018/19 An inspection of Gloucestershire Constabulary.
- Hopkinson, M. (2011). Electrifying performance: a study of systems thinking intervention at a UK electrical distribution network operator. In K. Zokaei, J. Seddon, & B. O’Donovan (Eds.), Systems Thinking: From Heresy to Practice: Public and Private Sector Studies (pp. 199–134). Palgrave Macmillan.
- IDEA. (2008). Reducing avoidable contact, a guide to N14.
- Jaaron, A., & Backhouse, C. J. (2010). Systems thinking for public services: adopting manufacturing management principles. In Zokaei, K. et al., op cit., 147-174.
- Jaaron, A., & Backhouse, C. J. (2011a). Systems thinking for call centre service design: affective commitment implications in manufacturing enterprises. The Service Industries Journal, 31(4), 613–628.
- Jaaron, A., & Backhouse, C. J. (2011b). A comparison of competing structural models in call centres: prospects for value creation. International Journal of Services and Operations Management, 10(3), 294–315.
- Jaaron, A, & Backhouse, C J. (2014). Service organisations resilience through the application of the Vanguard method of systems thinking: A case study approach. International Journal of Production Research, 52(7), 2026–2041
- Jackson, M. C., Johnston, N., & Seddon, J. (2008). Evaluating systems thinking in housing. Journal of the Operational Research Society, 59(2), 186–197.
- Laufs, J., Bowers, K., Birks, D., & Johnson, S. D. (2020). Understanding the concept of ‘demand’ in policing: a scoping review and resulting implications for demand management. Policing and Society, An International Journal of Research and Policy, https://doi.org/https://doi.org/10.1080/10439463.2020.1791862.
- LGA. (2013). Managing Customer Demand: Understanding and changing behaviours to help meet the financial challenge.
- LGITU. (2008). NI14: Help or Hindrance?
- Marshall, J. (2010). Organizational change: evaluating systems thinking in the UK housing sector—a work in progress. In Zokaei, K. et al., op cit., 108-131.
- Martin, P. (2010). Avoidable contact? If only … https://www.lgcplus.com/politics/service-reform/avoidable-contact-if-only-22-04-2010/.
- McCaughey, D., Erwin, C., & DelliFraine, J. L. (2015). Improving capacity management in the emergency department: a review of the literature, 2000-2012. Journal of Healthcare Management, 60(1), 63–75.
- Moore, M. H. (1995). Creating public value. Harvard University Press.
- NPCC. (2017). Better understanding demand—policing the future.
- O’Donovan, B. (2011). Systems thinking in adult social care: how focusing on a customer’s purpose leads to better services for the vulnerable in society and enhances efficiency. In Zokaei, K. et al., op cit., 40-66.
- ONS. (2020). Crime in England and Wales: year ending March 2020. ONS Statistical Bulletin.
- Randle, A., & Kippin, H. (2014). Managing demand: Building future public services. RSA.
- Ritchie, R., & Walley, P. (2016). The challenges of public sector demand and capacity management: an exploratory case study of police services. In Z. Radnor, N. Bateman, & A. Esain (Eds.), public services operation management: a research companion book (pp. 117–138). Routledge.
- Seddon, J. (1992). I want you to cheat. Blackwells.
- Seddon, J. (2003). Freedom from command and control. Vanguard Press.
- Seddon, J. (2008). Systems thinking in the public sector. Triarchy Press.
- Seddon, J. (2009). Failure demand—from the horse’s mouth. Customer Strategy, 1(2), 33–34.
- Seddon, J. (2014). The Whitehall effect. Triarchy Press.
- Walley, P. (2013). Does the public sector need a more demand-driven approach to capacity management? Production Planning & Control, 24(10-11), 877–890.
- Walley, P., & Adams, M. (2019a). Demand and capacity management practices in austerity: A study across UK police forces. Euroma 2019 Conference Proceedings.
- Walley, P., & Adams, M. (2019b). An evaluation of demand management practices in UK police forces. Centre for Police Research and Learning, The Open University.
- Walley, P., Found, P., & Williams, S. (2019). Failure demand: a concept evaluation in UK primary care. International Journal of Health Care Quality Assurance, 32(1), 21–33. https://doi.org/https://doi.org/10.1108/IJHCQA-08-2017-0159.
- Zokaei, K. (2011). How systems thinking provides a framework for change: a case study of disabled facilities grant services in Neath Port Talbot county borough council. In Zokaei, K. et al., op cit., 17-39.
