
Abstract
Adsorption plays an important role in the removal of pollutants such as fluoride from aqueous solutions. With the rapid development of environmental technology, TiO2 particle has become promising material to adsorb fluoride ion because of its low cost, non-toxic, good chemical stability, and good sorption ability. This work used sol-gel and hydrothermal synthesis methods to prepare TiO2 particles and load them onto SiO2 particles. The physicochemical properties such as heat stability, particle size, and surface area of the resulting TiO2 adsorbents were characterized with various analytical methods. In addition, their adsorption abilities to fluoride were determined under various conditions including different initial fluoride concentration, pH and coexisting ions. The maximum adsorption capacity of the TiO2 adsorbents can reach up to 94.3 mg/g. The adsorption isotherms of fluoride onto the TiO2 adsorbents can be closely described by the Langmuir model, suggesting the monolayer adsorption process.
1. Introduction
Fluorine is one of the 14 necessary elements to human body. Fluoride has positive effect to human in a certain concentration, but excess fluoride intake is harmful to human and aquatic organisms [Citation1]. Therefore, removal of fluoride ion from polluted water is very important to environment and human health protection.
Recently, great attention has been paid to the treatment of high fluoride water and researchers have conducted various investigations to develop effective ways to remove fluoride from polluted water. The most common treatment methods for fluoride polluted water including chemical precipitation, flocculation precipitation, electro-coagulation, membrane separation, adsorption, and ion exchange [Citation2–11]. Among them, adsorption is a relatively convenient and cost-effective way that can remove fluoride from polluted water. While a number of new adsorbents have been developed for water treatment, the most commonly used ones are activated alumina oxide, activated magnesium oxide, zeolite, activated carbon, and biomass-based adsorbents [Citation12,13]. Karmakar et al. [Citation14] studied the potential of aluminum fumarate metal organic framework (MOF) for fluoride removal from groundwater and found that MOF was good enough for complete removal of fluoride in feed solution of 30 mg/L. The maximum adsorption capacities of the MOF for fluoride are 600, 550, 504, and 431 mg/g at 293, 303, 313, and 333 K, respectively. Tang et al. [Citation15] synthesized Ce–Fe bimetal oxides with hierarchical pore structure and evaluate their application as adsorbent for fluoride removal. Batch fluoride adsorption experiments were carried out to investigate the influence of various factors such as adsorbent dosage, contact time, initial solution pH, and co-existing anions on the removal of fluoride by the bimetal oxides. Their results show that the maximum adsorption capacity of the optimized adsorbent is 60.97 mg/g. Zhang et al. [Citation16] investigated hierarchically structured layered double hydroxides (LDHs)/Al2O3 composites fabricated from waste paper fibers. The LDHs/Al2O3 composites show a high fluoride adsorption capacity, and the maximum adsorption capacity can reach up to 58.7 mg/g. Zhang et al. [Citation17] studied a micron-sized magnetic adsorbent (MMA) for fluoride removal from drinking water by spray drying and subsequent calcination of a magnetic Fe3O4@Fe–Ti core-shell nanoparticle slurry. The MMA granules have high mechanical strength and stability against water scouring, can be easily separated from the water by a magnet, and have a high selectivity for fluoride vs. common co-existing ions and high fluoride removal efficiency in a wide range of initial pH of 3–11. At neutral initial pH, the maximum fluoride adsorption capacity of the MMA is 41.8 mg/g. Rehman et al. [Citation18] investigated a series of doped and un-doped magnetic adsorbents CuCexFe2-xO4 (x = 0.0–0.5) for fluoride prepared with the micro-emulsion method. Fluoride adsorption was optimized for solution pH, temperature, contact time, and initial concentration and was monitored via normal phase ion chromatography [Citation19]. Doped ferrites (x = 0.1–0.5) were found to be superior to un-doped ferrites (x = 0) regarding the active sites, functional groups, and fluoride adsorption. Liu et al. [Citation20] synthesized a novel magnetic adsorbent consisting of iron-aluminum oxide nanoparticles anchored on graphene oxide (IAO/GO) for fluoride removal from aqueous solution. The physicochemical properties of IAO/GO were characterized through N2 adsorption/desorption, XRD, TEM, XPS, FT-IR, and AGM. Several main factors, such as dosage, initial solution pH, contact time, initial fluoride concentration, and co-existing anions, were investigated. Their results indicated that the maximum sorption capacity of IAO/GO can reach 64.72 mg/g and effective fluoride removal occurs in a wide pH range (3–9). Based on the findings of these studies, it seems that novel adsorbents, particularly nanomaterials, have great advances in the removal of fluorides from aqueous solutions [Citation21]. It is thus necessary to conduct additional investigations to explore and evaluate other novel adsorbent for the treatment of fluoride in water.
In this work, two facile methods were used to make novel TiO2 adsorbents: monodispersed TiO2 particles were prepared via sol-gel method using tetrabutyl titanate as titanium source; and mesoporous TiO2 particles were prepared via hydrothermal synthesis method using titanium sulfate as titanium source. In addition, nano SiO2–TiO2 particles were prepared using silica gel as silicon source, titanium sulfate, and tetrabutyl titanate as titanium source. TiO2 has been proved to be harmless to human body [Citation22], so the TiO2 adsorbents are safe to treat drinking water. The morphology, structure, and basic properties of the prepared samples were characterized by various instruments. Their sorption abilities to fluoride in aqueous solutions were evaluated through batch sorption experimentd under various conditions.
2. Materials and methods
2.1. Preparation of TiO2 and TiO2–SiO2
60 mL ethanediol and 15 mL tetrabutyl titanate were put into a 100 mL beaker. After 30 minutes’ magnetic stirring, 225 mL acetone that has been refrigerated for 30 min was added into the beaker. The mixed liquor was stirred for 30 min and was put in a 40 °C electrothermal blowing dry box, reacting for 10 h. The precipitate was washed by both pure ethyl alcohol and deionized water for 3 times, and then was added into a 500 mL Teflon hydrothermal synthesis reactor with 350 mL deionized water. The reactor was put into a 130 °C electrothermal blowing dry box, reacting for 5 h. The precipitate was washed by methyl alcohol for 3 times and dried at 70 °C. It was then moved to muffle to be burned at 400 and 500 °C for 2 h to obtain the TiO2(T) particles.
1.094 g CTAB and 65 mL deionized water were added into a 100 mL beaker to be stirred, and 8.64 g titanium sulfate was added into the beaker with vigorous stirring. After the mixed liquor was thoroughly mixed, it was transferred into a 100 mL Teflon reactor, reacting for 24 h at 110 °C. Then the precipitate was washed with ethyl alcohol and deionized water for several times, and dried in an electrothermal blowing dry box at 80 °C. After that, the mixture was transferred into a muffle to be burned at 300, 400 and 500 °C for 2 h to obtain the TiO2(S) particles.
Using the same process above, 3 g SiO2 was added into the Teflon hydrothermal synthesis reactor during the synthesie to obtain TiO2(T)–SiO2 and TiO2(S)–SiO2 particles.
2.2. Characterization
The changes in physical and chemical properties of the adsorbents with temperature was studied using the thermo gravimetric analysis with a TG-DTA (SETSYS-16). The surface morphology and microstructure of the adsorbents were determined using a scanning electron microscope (Siron 200, Philips-FEI, NED). The specific surface area of each adsorbent was analyzed using the BET method with a ASPA 2020 (Micromertics, USA). The structural characteristics of the adsorbents were measured using the X-ray diffraction technique with a D8 Advance (Bruker AXS, USA). Concentration of fluoride was measured using a fluoride ion-selective electrode (DHG-9075A, Yueci, CHN). The pH values of the solutions were measured using a pH meter (PHS-3B, Yueci, CHN).
2.3. Sorption of fluoride onto the TiO2 and TiO2–SiO2 composites
20 mg adsorbent was put into a 50 mL centrifuge tube filled with 25 mL fluoride solution of desired concentration. The tube was oscillated in the gyrotron oscillator for 24 h. After centrifugation and filtration, the supernatant was obtained. Concentration of fluoride in the supernatant was then measured using the ion selective electrode.
The equilibrium adsorption capacity of qe is calculated as follows [Citation23]:(1.1)
(1.2)
where qe is the equilibrium adsorption capacity, mg/g; C0 is the concentration of fluoride in solution before adsorption, mg/L; Ce is the concentration of fluoride in solution after adsorption, mg/L; V is the solution volume before adsorption, mL; M is the amount of adsorption; η is the adsorption rate, %.
The Langmuir and Freundlich models were used to simulate the isothermal adsorption equation. Their governing equations can be written as follows [Citation24]:(1.3)
(1.4)
where Ce is the equilibrium solution concentration, mg/L; qe is the equilibrium adsorption capacity, mg/g; qm is the Langmuir maximum capacity, mg/kg; K and KF are the Langmuir bonding term related to interaction energies, L/mg and the Freundlich affinity coefficient, mg(1−n)Ln/g, and n is the Freundlich linearity constant.
2.4. Continuous sorption
200 mg adsorbent was put into a 50 mL centrifuge tube filled with 25 mL fluoride solution of certain concentration, and then the tube was oscillated in the gyrotron oscillator for 10 min. After centrifugation and filtration, the supernatant was obtained. The concentration of fluoride in the supernatant was measured. The adsorbent was then added into a new solution of 25 mL fluoride to repeat the sorption process until the fluoride concentration of the supernatant reached constant.
2.5. Effect of pH, coexisting ion, and initial fluoride concentration
5 mg/L fluoride solution of different pH (1–14) were obtained with NaOH or HCl adjustment. Cl− and of 1.0, 5.0, 10.0 and 15.0, 20.0 mg/L were used as the coexisting ion with the 5 mg/L fluoride. To test the effects of the initial fluoride concentrations, 20 mg adsorbent was added into 25 mL fluoride solution with concentration varying from 1 to 500.0 mg/L. All the mixture solutions were oscillated in the gyrotron oscillator for 24 h. After centrifugation and filtration, the supernatants were obtained to determine fluoride concentrations.
3. Results and discussion
3.1. Characterization of the adsorbents
Figure shows the SEM images of the TiO2 and SiO2–TiO2 particles. As shown in the figure, the TiO2(T) particles are globular and have relatively large surface area and good dispersity; while TiO2(S) particles are irregular and have small surface area and poor dispersity. This was due to the agglomeration of TiO2(S) particles during calcination [Citation25]. The SiO2–TiO2(T) particles have smooth surface and are irregular, suggesting agglomeration of the TiO2(T) particles on the surface of SiO2. The SiO2–TiO2(S) particles are extremely irregular with varying sizes. The specific surface area of these particles are listed in Table .
Figure 1. SEM images of TiO2(T) (a), TiO2(S) (b), SiO2–TiO2(T) (c), and SiO2–TiO2(S) (d).
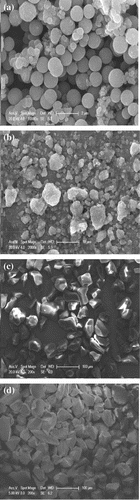
Table 1. Specific surface area of the four TiO2 adsorbents.
Figure shows the XRD spectra of the TiO2 and SiO2–TiO2 particles. As shown in the Figure (a) and (b), the diffraction peaks of TiO2(T) and TiO2(S) are obvious at 2θ = 25.35° and 47.99°, respectively. Those peaks are corresponding to (101) and (200) crystal of anatase titanium dioxide, indicating that the two TiO2 particles have typical anatase crystal structure after heating at 500 °C. It can be told from the heights of the diffraction peaks that the degree of crystallization of TiO2(S) is better than that of TiO2(T). As shown in Figure (c) and (d), the diffraction peaks of SiO2–TiO2(T) and SiO2–TiO2(S) are obvious at 2θ = 25.35°, 37.94°, 47.99°, 55.1°, 62.5°, corresponding to (1 0 1), (0 0 4), (2 0 0), (2 1 1) and (2 0 4) crystal of anatase titanium dioxide. These also indicate that the two SiO2–TiO2 particles have typical anatase crystal structure after heating at 500 °C [Citation26]. Similarly, the values of diffraction peaks suggest that the degree of crystallization of SiO2–TiO2(S) is better than that of SiO2–TiO2(T).
Figure 2. XRD spectra of TiO2(T) (a), TiO2(S) (b), SiO2–TiO2(T) (c), and SiO2–TiO2(S) (d).
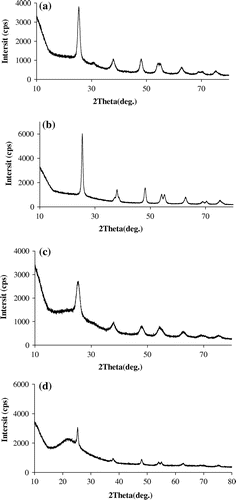
Figure shows the TG-DTA curves of the TiO2 particles and SiO2–TiO2 particles. As shown in Figure (a) and (c), the TG curves of TiO2(T) and SiO2–TiO2(T) can be divided into 3 stages: (1) from room temperature to around 150 °C, DTA curve has a endothermic peak and a exothermic peak due to the evaporation of water and methanol solvent in absorbent; (2) from 150 °C to around 450 °C, DTA curve has the second endothermic peak and the second exothermic peak due to the combustion reaction between oxygen and –OH and –O(CH2)3CH3; and (3) above 500 °C, the TG curve of TiO2(T) flattens, and doesn’t have obvious weight loss, indicating that the organic residual has been degraded and weight loss rate of SiO2–TiO2(T) begin to slowly due to the phase transformation of TiO2 from anatase to rutile.
Figure 3. TG-DTA of TiO2(T) (a), TiO2(S) (b), SiO2–TiO2(T) (c), and SiO2–TiO2(S) (d).
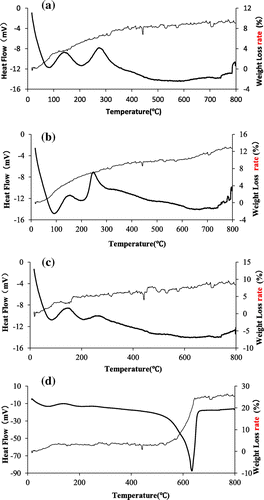
As shown in Figure (b), the TG curve of TiO2(S) can be divided into 2 stages: (1) from room temperature to around 200 °C, weight loss rate of TiO2(S) changes greatly and arrives 6.3% at 200 °C. DTA curve has a endothermic peak and a exothermic peak supposedly due to the evaporation of water, methanol solvent and surface hydroxide radical in the particles; (2) and above 200 °C, TG curve flattens and DTA curve has a endothermic peak due to the oxidation and combustion of organics like template in TiO2(S) particles. Besides, there is a weak endothermic peak at around 460 °C, probably due to constantly improving from amorphous phase to anatase phase of TiO2(S).
As shown in Figure (d), the TG curve of SiO2–TiO2(S) can be divided into 3 stages: (1) from room temperature to around 150 °C, the behaviors of SiO2–TiO2(S) are the same as that of SiO2–TiO2(T); (2) from 150 °C to around 500 °C, there is no obvious endothermic peak, which should be the process of the phase transformation of TiO2 from amorphous to anatase; and (3) from 500 °C to around 800 °C, weight loss rate of SiO2–TiO2(S) rises rapidly to 25%, which is caused by oxidation and combustion of CTAB.
3.2. Continuous sorption
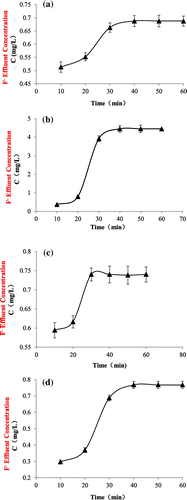
Figure shows the performances of the four adsorbents to fluoride during the continuous sorption test. It can be seen from the figure that all the tested TiO2 adsorbents can effectively remove fluoride from aqueous solutions for multiple time. As expected, the performance was the best at the first time (10 min). Adsorbents slowly reached their capacities after 3 times (30 min), suggesting all the TiO2 adsorbents have relatively fast adsorption kinetics to fluoride in aqueous solutions.
Figure 4. Continuous sorption of TiO2(T) (a), TiO2(S) (b), SiO2–TiO2(T) (c), and SiO2–TiO2(S) (d).
3.3. Effects of initial fluoride concentration, pH, and coexisting ions
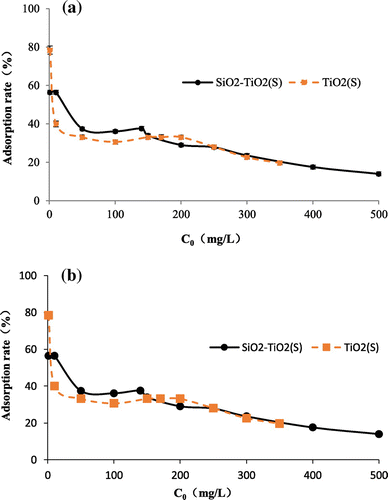
The effect of different initial fluorine concentration on adsorption is shown in Figures and . With the increase of initial fluoride concentration, the adsorption of fluoride onto the four TiO2 adsorbents gradually increases; while removal rate gradually decreases. Among all the tested adsorbents, SiO2–TiO2(S) has the highest maximum fluoride adsorption capacity of 94.3 mg/g. When the initial fluoride ion concentration is 1 mg/L, TiO2(S) has the largest removal rate of 78.5%. It can be found from the results that, with the carrier SiO2, the adsorption ability of SiO2–TiO2(T) became better, while the adsorption ability of SiO2–TiO2(S) became worse. This was probably caused by the differences between the particle size of TiO2(T) and TiO2(S).
Figure 5. Adsorption capacity (a) and adsorption rate (b) of TiO2(T) and SiO2–TiO2(T) to fluoride with different initial fluoride concentration.
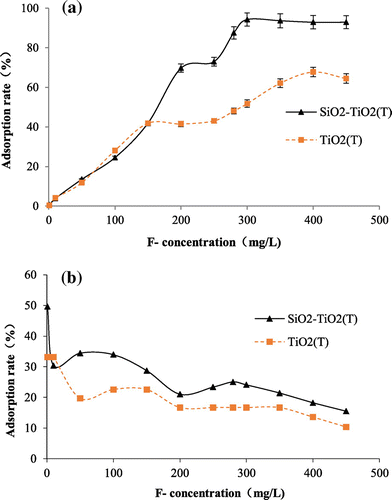
Figure 6. Adsorption capacity (a) and adsorption rate (b) of TiO2(S) and SiO2–TiO2(S) to fluoride with different initial fluoride concentration.
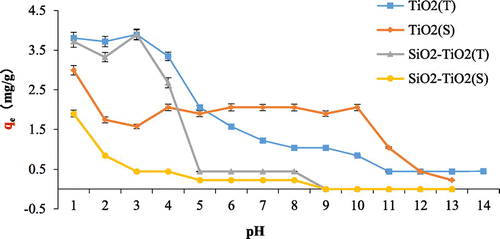
The effect of pH on fluoride adsorption is shown in Figure . The results suggest that solution pH has large impact to fluoride adsorption onto the four adsorbents. With the increase of pH, the adsorption of fluoride onto the adsorbents shows a decreased trend, suggesting acid condition is favorable to adsorption. TiO2(T) and SiO2–TiO2(T) have good fluoride adsorption capacity when the pH is between 1 and 3. For TiO2(S) and SiO2–TiO2(S), the optimal pH is 1. These results also suggest that the properties of TiO2 doesn’t change after loaded onto SiO2 particles.
Figure 7. Effect of pH on fluoride adsorption onto TiO2(T), TiO2(S), SiO2–TiO2(T), and SiO2–TiO2(S).
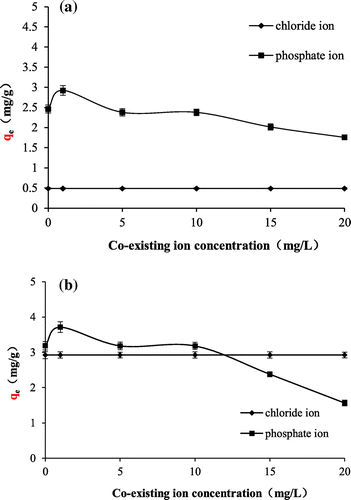
The effect of coexisting ions on adsorption is shown in Figure . As shown in the figure, with the increase of the concentration, fluoride adsorption ability of the TiO2 adsorbents decreases; however, the increase of the Cl− concentration has no distinct effect on the adsorption. These indicate that
has competition effect on the adsorption of fluoride ion but Cl− doesn’t. This is because
, as a weak acidic ion, makes pH increase by hydrolysis, and Cl−, as a strong acid ion, can’t be hydrolyzed in the solution. The effect of coexisting ions on adsorption of SiO2–TiO2 is the same as of TiO2, suggesting TiO2 is the dominant sorption sites for fluoride ions.
Figure 8. Effects of coexisting ions on fluoride adsorption onto TiO2(T) (a) and TiO2(S) (b).
3.4. Isothermal adsorption equation
The isotherm data were fitted by Langmuir and Freundlich isotherm equation. The fitting results of the four adsorbents are shown in Figure and the best-fit parameters are shown in Table . The results show that the Langmuir isotherm model fits the data the better, indicating that fluoride adsorption onto the TiO2 adsorbents is a monolayer process.
Figure 9. Adsorption isotherms of fluoride on TiO2(T) (a), TiO2(S) (b), SiO2–TiO2(T) (c), and SiO2–TiO2(S) (d).
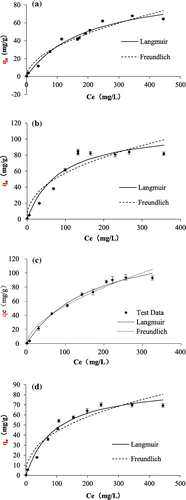
Table 2. Best-fit parameters of adsorption isotherms of fluoride onto the TiO2 composites.
4. Conclusions
In this study, TiO2(T) particles of 0.5–1 μm and TiO2(S) particles of 0.1–10 μm were synthesized and loaded onto SiO2 for the removal of aqueous fluoride. After the loading, the adsorption capacity of SiO2–TiO2(T) became better; while that of SiO2–TiO2(S) became worse, probably because some pores on the surface of SiO2 were filled by small TiO2(S) particles. In addition, the surface area of SiO2–TiO2 becomes larger after loading. The four adsorbents have better adsorption performance under acid condition. With the increase of initial F− concentration, the adsorption capacity of the four adsorbents increases; while their removal rate decreases. The maximum fluoride adsorption capacity is 94.3 mg/g by SiO2–TiO2(S) and the maximum removal rate is 78.5% by TiO2(S). can affect the fluoride adsorption process, but Cl− has no influence. The Langmuir model fits the adsorption isotherms of the fluoride onto the TiO2 adsorbents very well.
Disclosure statement
No potential conflict of interest was reported by the authors.
Funding
This work was partially supported by the National ‘Twelfth Five-Year’ Plan for Science & Technology Pillar Program [grant numbers #2014BAL04B04 and #2015BAL01B02] the Fundamental Research Funds for the Central Universities [grant number 2042014kf0262], and the Wuhan Water Engineering & Technology Co. Ltd.
References
- Huang R, Yang B, Liu Q, et al. Removal of fluoride ions from aqueous solutions using protonated cross-linked chitosan particles. J Fluorine Chem. 2012;141:29–34.10.1016/j.jfluchem.2012.05.022
- Chen L, Zhang K-S, He J-Y, et al. Enhanced fluoride removal from water by sulfate-doped hydroxyapatite hierarchical hollow microspheres. Chem Eng J. 2016;285:616–624.10.1016/j.cej.2015.10.036
- Mehta D, Mondal P, George S. Utilization of marble waste powder as a novel adsorbent for removal of fluoride ions from aqueous solution. J Environ Chem Eng. 2016;4:932–942.10.1016/j.jece.2015.12.040
- Chen GJ, Peng CY, Fang JY, et al. Biosorption of fluoride from drinking water using spent mushroom compost biochar coated with aluminum hydroxide. Desalin Water Treat. 2016;57:12385–12395.10.1080/19443994.2015.1049959
- Jiang HL, Zhang WB, Chen PH, et al. One pot method to synthesize a novel La-Zr composite with exceptionally high fluoride removal performance. J Inorg Organomet Polym Mater. 2016;26:285–293.10.1007/s10904-015-0315-1
- Wu SB, Zhang KS, He JY, et al. High efficient removal of fluoride from aqueous solution by a novel hydroxyl aluminum oxalate adsorbent. J Colloid Interface Sci. 2016;464:238–245.10.1016/j.jcis.2015.10.045
- Brunson LR, Sabatini DA. Methods for optimizing activated materials for removing fluoride from drinking water sources. J Environ Eng. 2016;142(2):04015078.
- Garcia-Sanchez JJ, Solache-Rios M, Alarcon-Herrera MT, et al. Removal of fluoride from well water by modified iron oxides in a column system. Desalin Water Treat. 2016;57:2125–2133.10.1080/19443994.2014.980332
- Yousefi N, Fatehizedeh A, Ghadiri K, et al. Application of nanofilter in removal of phosphate, fluoride and nitrite from groundwater. Desalin Water Treat. 2016;57:11782–11788.10.1080/19443994.2015.1044914
- Zhang YL, Dong TZ, Su XS, et al. Effect of high fluoride groundwater purification by lightweight aggregate scoria. Environ Earth Sci. 2016;75(1):1–8.
- Liu CC, Liu JC. Coupled precipitation-ultrafiltration for treatment of high fluoride-content wastewater. J Taiwan Inst Chem Eng. 2016;58:259–263.10.1016/j.jtice.2015.05.038
- Wei W, Wang X, Wang Y, et al. Evaluation of removal efficiency of fluoride from aqueous solution using nanosized fluorapatite. Desalin Water Treat. 2013;52:6219–6229.
- Gao F, Xue Y, Deng P, et al. Removal of aqueous ammonium by biochars derived from agricultural residuals at different pyrolysis temperatures. Chem Speciation Bioavailability. 2015;27:92–97.10.1080/09542299.2015.1087162
- Karmakar S, Dechnik J, Janiak C, et al. Aluminium fumarate metal-organic framework: a super adsorbent for fluoride from water. J Hazard Mater. 2016;303:10–20.10.1016/j.jhazmat.2015.10.030
- Tang DD, Zhang GK. Efficient removal of fluoride by hierarchical Ce-Fe bimetal oxides adsorbent: thermodynamics, kinetics and mechanism. Chem Eng J. 2016;283:721–729.10.1016/j.cej.2015.08.019
- Zhang T, Yu HQ, Zhou YM, et al. Enhanced adsorption of fluoride from aqueous solutions by hierarchically structured Mg-Al LDHs/Al2O3 composites. Korean J Chem Eng. 2016;33:720–725.10.1007/s11814-015-0181-0
- Zhang C, Li YZ, Wang TJ, et al. Adsorption of drinking water fluoride on a micron-sized magnetic Fe3O4@Fe-Ti composite adsorbent. Appl Surf Sci. 2016;363:507–515.10.1016/j.apsusc.2015.12.071
- Rehman MA, Yusoff I, Alias Y. Fluoride adsorption by doped and un-doped magnetic ferrites CuCexFe2-xO4: Preparation, characterization, optimization and modeling for effectual remediation technologies. J Hazard Mater. 2015;299:316–324.10.1016/j.jhazmat.2015.06.030
- Rojas-Mayorga CK, Bonilla-Petriciolet A, Sánchez-Ruiz FJ, et al. Breakthrough curve modeling of liquid-phase adsorption of fluoride ions on aluminum-doped bone char using micro-columns: effectiveness of data fitting approaches. J Mol Liq. 2015;208:114–121.10.1016/j.molliq.2015.04.045
- Liu L, Cui ZJ, Ma QC, et al. One-step synthesis of magnetic iron-aluminum oxide/graphene oxide nanoparticles as a selective adsorbent for fluoride removal from aqueous solution. R Soc of Chem Adv. 2016;6:10783–10791.
- Suriyaraj SP, Selvakumar R. Advances in nanomaterial based approaches for enhanced fluoride and nitrate removal from contaminated water. R Soc Chem Adv. 2016;6:10565–10583.
- Wang J, Wang L, Fan Y. Adverse biological effect of TiO(2) and hydroxyapatite nanoparticles used in bone repair and replacement. Int J Mol Sci. 2016;17(6):798.
- Kusrini E, Sofyan N, Suwartha N, et al. Chitosan-praseodymium complex for adsorption of fluoride ions from water. J Rare Earths. 2015;33:1104–1113.10.1016/S1002-0721(14)60533-0
- Yao Y, Gao B, Inyang M, et al. Removal of phosphate from aqueous solution by biochar derived from anaerobically digested sugar beet tailings. J Hazard Mater. 2011;190:501–507.10.1016/j.jhazmat.2011.03.083
- Teutli-Sequeira A, Martínez-Miranda V, Solache-Ríos M, et al. Aluminum and lanthanum effects in natural materials on the adsorption of fluoride ions. J Fluorine Chem. 2013;148:6–13.10.1016/j.jfluchem.2013.01.015
- Zhao X, Zhang L, Xiong P, et al. A novel method for synthesis of Co–Al layered double hydroxides and their conversions to mesoporous CoAl2O4 nanostructures for applications in adsorption removal of fluoride ions. Microporous Mesoporous Mater. 2015;201:91–98.10.1016/j.micromeso.2014.09.030