
 ?Mathematical formulae have been encoded as MathML and are displayed in this HTML version using MathJax in order to improve their display. Uncheck the box to turn MathJax off. This feature requires Javascript. Click on a formula to zoom.
Abstract
In Computer Aided Tolerancing (CAT) the goal is to virtually predict the variation in critical measures for a product. In order to succeed with that, the simulation model needs to be as accurate as possible, the positioning of the included parts needs to mimic the reality of assembly in production and all the tolerances that influence the results need to be included. For all assembly types, but especially manual assembly, one problem that can occur during assembly is mis-constraining, meaning that the part is positioned but not in the way intended by the designer. This phenomenon leads to quality problems, increased costs, impact on functions, etc. In this paper, the phenomena are illustrated using industrial case studies. Simulation methods to model this are sparse and in this research a new method and simulation tool to include the effects of mis-constraining are proposed and included in a CAT tool.
1. Introduction
1.1. Manual assembly
In the global market, the concept of mass customisation has led manufacturers to diversify their products and increase product variety (Coletti and Aichner Citation2011). The purpose of this is to offer products that the end customer can customise to a high extent, increasing customer value and willingness to pay premium prices, but at a cost of manufacturing close to producing traditional mass-produced products (Zhu et al. Citation2008), (Fogliatto, Da Silveira, and Borenstein Citation2012). Mass customisation requires flexible production layout and production processes and puts very high requirements on the equipment performing the assembly. To achieve this flexibility, the most flexible and versatile assembly equipment are often used in final assembly; the human operator (Fasth et al. Citation2010). In a mass customisation production line, the feasibility of high level of automation is low since the cost supersedes the gain. In the context of the automotive industry, a paced line is usually used, and a number of different vehicles are produced in the same line with many thousands of customer customisable combinations. This puts enormous pressure on the operation of the assembly systems (Rekiek, De Lit, and Delchambre Citation2000; Svensson Harari, Bruch, and Jackson Citation2014).
1.2. Manual assembly simulation
To simulate manual assembly, some type of mannikin is used in simulation software (Hanson et al. Citation2014). The simulation can predict behaviours, postures, interaction between man and machines, etc. Further, assembly times and ergonomics evaluations can be performed virtually. These types of simulations are called Digital Human Modelling (DHM). One example is the IPS IMMA tool that performs all the simulations above (Hanson et al. Citation2019). DHM simulations are often focusing on ergonomics, working conditions and optimisation of the production flow (Pascual et al. Citation2020), (Hanson Citation2020). The effect from the manual assembly process on the product is seldom assessed or simulated.
1.3. Assembly errors and quality problems
An assembly operation performed by a human will always be subject to a certain extent of human errors. The task can consist of many sub-tasks, such as choosing the correct component, positioning the component in the correct location, using the correct fasteners and tools, performing the task in the correct order and adjustment of a component to a certain specification (Torres, Nadeau, and Landau Citation2021). During this complex task errors can occur, such as:
Getting the wrong information or ignoring information
Selecting the wrong component or omitting a component
Operations are done in wrong order and/or direction
Misalignment of parts
Adjustments/checks of the assembly process are incomplete or omitted
Many different approaches exist for evaluating human reliability in the assembly process and most of them focus on quality and system performance (Di Pasquale et al. Citation2018), but the product properties are rarely evaluated.
Various types of assistance systems exist to help operators to secure quality, such as pick-by-light, fixtures, sound confirmations, etc. These systems can improve the success rate and quality of the assembly (Riedel et al. Citation2021) provided that they are used and followed by the operator.
1.4. Complexity
How easy something is to assemble can be defined as the ease of gripping, positioning and inserting a part into the assembly process (Fujimoto and Ahmed Citation2001). This can be expanded to include an operator choice complexity. Many choices need to be made during a fixed time, such as carrying out operations in the correct order, picking the correct fastener, using the correct tool, etc.
Complexity can be defined as something that is difficult to understand, describe, predict or control (Sivadasan et al. Citation2006). Presence of such complexity will put high strain and requirements on the operator’s physical and cognitive performance. Physical loads and effects can be simulated and predicted using DHM as described previously.
Cognitive factors that can lead to errors include task design, assembly timing, physical loading demands, extrinsic motivation factors, teamwork and the assembly interface design (Berlin et al. Citation2021).
Cognitive load can also be calculated using different models (Samy and ElMaraghy Citation2010), however, the soft parameters above are difficult to quantify and determine. Therefore, it is desirable to find methods to minimise the complexity in the manual assembly process and thereby also reduce the costs of poor quality.
1.5. Geometry assurance, manual assembly and mis-constraining
In geometry assurance, one goal is to create robust locating schemes that are insensitive to variation. However, the locating scheme must lock the degrees of freedom of a part as intended to achieve the desired robustness. In manual assembly, this requires the operator to succeed in realising the locating scheme as designed and if the operator fails due to any of the previously described reasons, the robustness will be affected. This may create a misalignment of the part resulting in a part mis-constrained when fastened. Also, simulations made in CAT aiming to predict variation, will not be valid since the locating scheme has changed. Therefore, the accuracy of current CAT simulations for manual assembly can be very poor and not reflecting actual variation.
1.6. Perceived quality (PQ)
The quality of a product is a multidimensional structure and many definitions of what quality is exist. A well-defined approach (Garvin Citation1984) from 1984 consists of eight fundamental dimensions of quality. One of these is aesthetics or fit and finish. A portion of this quality dimension is gap and flush measurements (Wickman and Söderberg Citation2007), (Stylidis, Wickman, and Söderberg Citation2020). In the automotive industry, the perceived quality of the vehicle is one of the factors that defines the brand and how successful the product will be (Stylidis, Wickman, and Söderberg Citation2020). In addition, the geometrical quality (i.e. gap and flush, etc.) is being evaluated by customers to a high extent and can be the factor that determines if a product is accepted or rejected (Forslund, Karlsson, and Söderberg Citation2013).
In this research the focus has been on evaluating gap and flush, since this is a very important quality factor in consumer products. However, the proposed method can be used for any type of geometrical requirements.
1.7. Scope of the paper and delimitations
Research regarding methods and tools supporting the simulation of mis-constraining in CAT are, to the best of the authors knowledge, so far not published in any research papers and research performed in this field is limited.
Some related research has been performed in the field of manual assembly and geometry assurance. Studies on how assembly tolerances affect the human that performs the assembly have been made showing that the smaller the assembly tolerance required the more difficult, harmful and time-consuming the task becomes (Wartenberg et al. Citation2004). Another approach is automated assignment of assembly tolerances using ontology to ensure that the correct types of tolerances are assigned to assembly tasks (Zhong et al. Citation2013). Human reliability studies to quantify the error and quality level, showing that the highest error probability comes from assembly of parts sensitive to geometrical errors (Torres, Nadeau, and Landau Citation2021). Further many methods to calculate the effect on other types of mis-constraining exist as described in Section 2.4, but no published research focus on the simulation of the effect in manual assembly and how that will affect the geometrical quality.
Therefore, the first study to show the phenomena, validate its existence and provide a basic method and tool to simulate this is presented in this paper.
The aim of this study was to introduce a new method to simulate variation for manual assembly processes when mis-constraining occurs. The method is implemented in a CAT tool and evaluated on two test cases. Many methods exist aiming at reducing human error during manual assembly, however the proposed method addresses a white spot on the research map, i.e. how to simulate the effects on geometrical quality due to human errors.
There are many other factors that also influence geometrical quality, which have not been addressed. The physical tests have been performed in the automotive industry using parts and assembly techniques that are common in that context.
All parts have been assumed to be rigid in this work, however the proposed method should be valid for non-rigid parts as well. Due to using rigid parts friction and weight are not included in the simulations.
In Section 2, the frame of reference is extended to geometry assurance. In Section 3, the suggested method, together with empirical tests are described. This is followed by a description of the results and a discussion in Section 4 and 5. Conclusions are given in Section 6.
2. Geometry assurance
In this section, an overview of geometry assurance is given. Geometry assurance is a set of tools and methods, aiming to minimise the effects of geometrical variation on the final product or subassembly.
2.1. Robust design
A robust design is a design that fulfils its requirements even in the presence of noise. In the context of geometry assurance, geometrical variation in parts and in the assembly process is considered as noise. Geometrical variation on part level stems from previous manufacturing processes. In the assembly process, noise can be caused by joining, wear on tools or as previously mentioned by operator mistakes in a manual assembly process. In most cases it is expensive and difficult to reduce the magnitude of the sources of variation, and it is preferred to reduce the sensitivity to variation in geometry assurance (Taguchi, Chowdhury, and Wu Citation2005).
The idea of robust deign and its benefits in quality improvement was introduced by Taguchi in 1986 (Taguchi Citation1986) and has been improved, refined and expanded since then. Taguchi's idea consists of determining which factors that affect a design and divide them into two factors: control factors that can easily be controlled, and noise factors (geometrical variation) that are difficult to control. To engineer a robust design, the control factors are chosen to minimise the expected loss caused by the noise factors. The idea applied to geometry assurance means that the control factors are the locating schemes and noise factors are the geometrical variation (Söderberg Citation1998), (Söderberg and Lindkvist Citation1999).
In geometry assurance, robustness is achieved by optimising the locating schemes and the task is to optimise the position of the locators to minimise the sensitivity to geometrical variation. This can be done using a stability analysis, implemented in CAT tools (Söderberg and Lindkvist Citation1999). Using the stability analysis, the engineer can compare several product concepts and iteratively find the most robust solution. If overall robustness is not important other optimisation criteria can be used, such as only evaluating the sensitivity to variation in critical measures (Lööf, Lindkvist, and Söderberg Citation2009). This has been further evolved into a complete framework and strategy for robust design (Howard et al. Citation2017), (Boorla et al. Citation2018).
2.2. Geometry assurance process
A product development process consists of three main phases, namely the concept, the verification and the production phase. The geometry assurance process is a part of the product development process, describing the development activities connected to geometry assurance. In Figure an overview of a geometry assurance process can be seen (Rosenqvist, Falck, and Söderberg Citation2015; Söderberg et al. Citation2016).
Figure 1. Geometry assurance process.
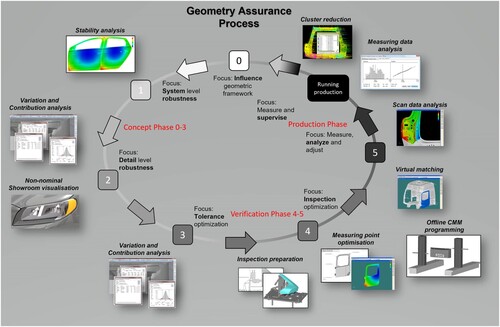
During the Concept phase many product concepts are generated and evaluated. The focus in this phase is set on Robust Design which is evaluated and optimised by creating locating schemes and performing stability analysis. When the locating schemes are optimised, the focus is shifted towards balancing and assigning tolerances which are evaluated and optimised using variation and contribution analysis. A presumption for these simulations to be reliable is that the operator assembling the system manages to assemble as intended.
In the Verification phase the product is being produced in pre-series, at first with non-production intent process and tools and later on with the intended process and tools ramping up the production pace. The focus in this phase is to physically verify that all geometrical requirements are fulfilled and if necessary, perform activities to correct any problems.
During the Production phase the main task is to monitor the production to make sure that the geometrical requirements are fulfilled long-term. Production knowledge and inspection data are also fed back to the next concept phase as input data for new product development.
2.3. Locating schemes
Locating schemes are one of the most important concepts within geometry assurance. Locating schemes define how a part is positioned in space, by a fixture and/or by other parts and assemblies. The locating scheme is used for manufacturing, assembly and inspection to ensure that the part is correctly positioned.
A part assumed to be rigid has six degrees of freedom, three translations (TX, TY, TZ) and three rotations (RX, RY, RZ) and therefore six points are needed to lock all translations and rotations in three independent directions (Söderberg, Lindkvist, and Carlson Citation2006). In the actual physical implementation some points may coincide, but at least three locators (points) are necessary. Many different types of location points exist, for example, pins/screws/rivets in holes or slots and clamps on surfaces.
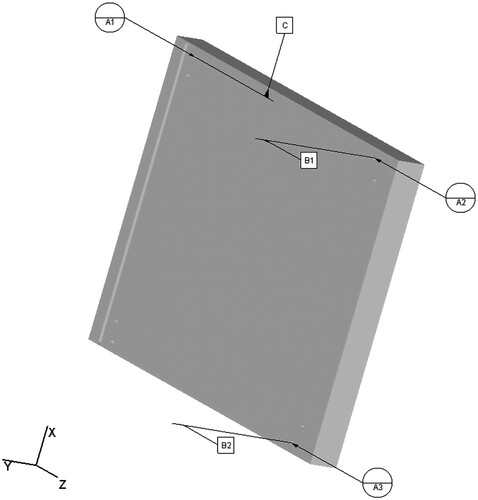
There are two main types of locating schemes: orthogonal and non-orthogonal ones. In an orthogonal locating scheme, the three independent directions are orthogonal to each other (Söderberg, Lindkvist, and Carlson Citation2006). In such an orthogonal 3-2-1 locating scheme, the A1, A2 and A3 locators define the primary locating plane and lock TZ, RX and RY. The secondary locating plane is defined by points B1 and B2, locking TX and RZ, while the last point, C, defines the tertiary locating plane and locks TY. All planes are perpendicular to each other. This type of positioning system is however rarely used in the automotive industry since the parts have too complex shapes, see Figure . Instead, a non-orthogonal 6-directions locating scheme can be used. Such a locating scheme consists of six points, that all have unique locating directions non-orthogonal to each other. The locating scheme is not allowed to be singular, i.e. the locating scheme must be able to lock all six degrees of freedom of a rigid part. This kind of positioning system is usually used in the automotive industry to position parts with irregular shapes, see Figure .
Figure 2. 3-2-1 locating scheme.
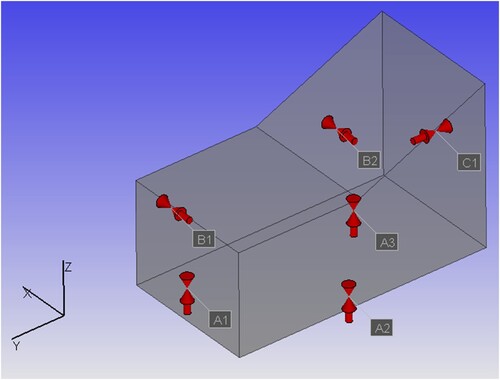
Figure 3. 6-directions locating scheme.
To achieve a robust design and mimic the intended system solution it is very important that the positioning of parts is stable and error-free. If not, variation of the positioning will affect the assembly process, and thereby also the perceived quality and function of the finished product. The amount of variation introduced in the assembly is related to the operator’s ability to position the part as intended by the locating scheme.
2.4. Mis-constraining of locators
As mentioned in the previous section the purpose of the locating scheme is to lock all degrees of freedom of a part using fixtures or contact surfaces against other parts. If the positioning of a part is incorrect, the fulfilment of geometric tolerance specifications will be affected negatively (Marin and Ferreira Citation2003). The outcome can be a part that has all degrees of freedom locked and is positioned in space but not as the locating scheme intended (Chaiprapat and Rujikietgumjorn Citation2008). The part has been mis-constrained. This is not because the locating scheme is not robust, it might even have optimal geometrical robustness with respect to the shape of the part, but due to variation and/or deviations caused by the human operator.
Several methods to calculate the errors induced during positioning exist (Vishnupriyan, Majumder, and Ramachandran Citation2011; Rong et al. Citation2001; Khodaygan Citation2013). All those focus on how deviations in the fixture affect the position of the part. However, using manual assembly there is also a possibility that the operator fails to assemble the part according to the assembly instructions (if they exist), which will affect the function of a locator. For example, a locator intended to guide the part only in one direction might guide it in two or three directions instead, which creates a completely different locating scheme and a mis-constrained part.
2.5. Tolerances and variation
Regardless of the type of product, all products are affected by variation originating from:
Manufacturing process, like cutting, milling, stamping, casting, etc.
Assembly process, like equipment variation, robot variation, operator variation, etc.
When developing a new product, it is very important to consider and quantify the allowed variation in each feature and property of the product. This needs to be done in early product development (Ullman Citation2009).
This is done by specifying tolerances for each property, describing the upper and lower specification limit for which the property is acceptable. This is then annotated on part drawings as GD&T (Geometric Dimensioning and Tolerancing) (Chiabert, Lombardi, and Orlando Citation1998).
Together with the positioning systems, tolerances are the most important factor affecting the final variation of a product (Söderberg, Lindkvist, and Carlson Citation2006). Using tight (small) tolerances is one way of improving geometrical quality but this approach is costly. Both from economical and assembly perspectives, it is preferred to design solutions that are geometrically robust, i.e. insensitive to variation, which allows wider tolerances without affecting the geometrical quality.
When setting and balancing tolerances, several strategies can be used. In the automotive industry the top-down method is the most common one. This method means that a tolerance specification is set on the highest level, i.e. the finished product, and this is then broken down into individual and internally balanced tolerance specifications on the included parts (Lööf Citation2010). To predict and ensure that the product quality meets its specifications, variation simulation predicting the final variation and deviation on the product level is usually conducted. This is done in early product development using 3D tolerance chain calculations tools, CAT tools (Söderberg et al. Citation2016).
2.6. Variation simulation in CAT
There are several commercial Computer Aided Tolerancing tools for geometry assurance that fulfils the need for variation simulation. Some large brands are 3DCS (webpage, Citation2022), VSA (webpage, Citation2022) and RD&T (webpage, Citation2022). In this paper, RD&T has been used for simulations and research. Variation simulation in RD&T is based on the Monte Carlo simulation method (Zio Citation2013; Shen et al. Citation2005). RD&T is used in a number of automotive companies globally. The following types of analyses are usually used:
Variation analysis: Statistical variation simulation based on the Monte Carlo method is used to apply a number of input disturbances (tolerances) to the assembly. These are usually normally distributed. The result is a prediction of variation in the final assembly. Commonly used output format is 6 sigma as a measure of variation. The result is presented both in numbers and in a histogram, see Figure .
Figure 4. Variation analysis.
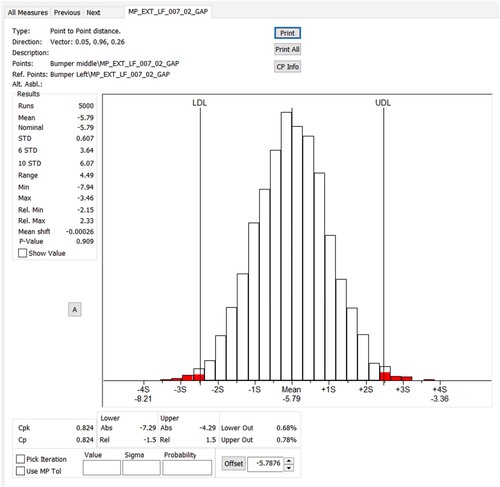
The measure on the final assembly in Figure is not within its tolerance limits and therefore the product design needs to be reviewed. In order to do this, it is necessary to analyse the impact of each tolerance on the variation in that measure which is done using a contribution analysis.
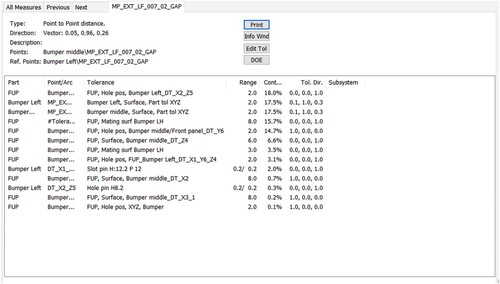
Contribution Analysis: Calculates the relative importance of each input deviation (tolerance) on the output deviation (measure). The result is presented as a ranking of the contribution of each tolerance to the product variation. The contribution analysis is done by varying the influencing parameters, one at a time, at three levels of HLM (High, Low, Mean) and registering the result, see Figure . Using this list, the most influential tolerances can be identified and possibly be reduced to improve the result on the variation in each measure.
Figure 5. Contribution analysis.
3. Methods and tests
3.1. Problem description, case 1
In previous research and industrial tests (Rosenqvist et al. Citation2013), (Rosenqvist, Falck, and Söderberg Citation2016), (Rosenqvist, Falck, and Söderberg Citation2016), (Falck et al. Citation2017) it has been established that manual assembly adds geometrical variation to the product, and this is not included in current simulation methodologies. Mis-constraining is one of the contributors to variation in manual assembly. In this study, physical tests have been performed isolating this phenomenon.
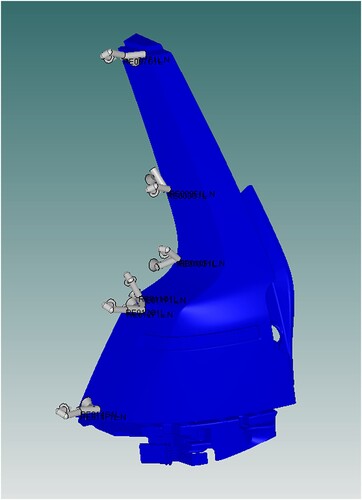
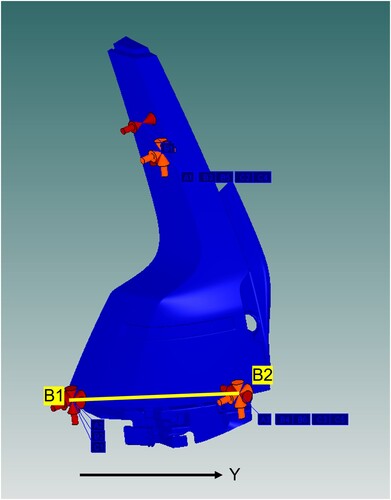
The testing was performed at a European automotive manufacturer using a car model from running production. Actual production components were used, and the tests were performed in a controlled industrial environment with no other noise factors. The test setup was an assembly of a rear lamp to a finished body in white, with pins and screws as locators/fasteners, see Figures and . The tests were performed according to the following procedure:
One car body was used throughout all tests (i.e. there was no variation from the car body)
One lamp was used throughout all tests (i.e. there was no variation from lamp)
Two operators were performing the tests independent of each other
There were six flush and six gap measurements made between the lamp and body for each test, see Figures and
Gap measurements were performed with feeler gauge and flush measurements with flush calliper, see Figure
The fasteners were assembled with reduced torque, to ensure that no deformation occurred of the parts ensuring consistent results
Figure 6. Rear lamp locators.
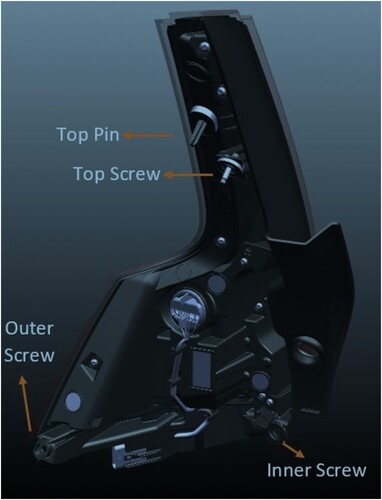
Figure 7. Rear lamp assembly.
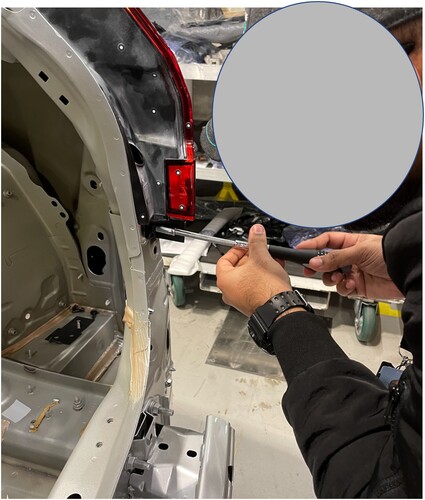
Figure 8. Measurement points.
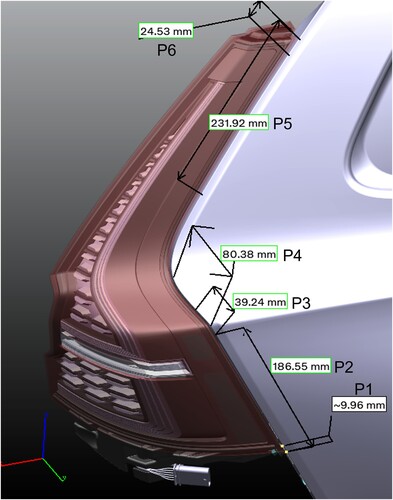
Figure 9. Gap and Flush definition.
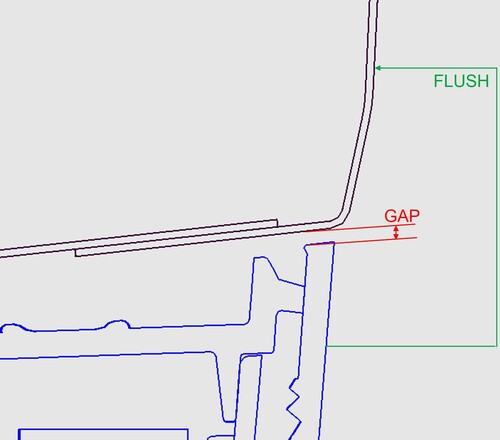
Figure 10. Measurement tools.

Each test was repeated five times per operator and mean values were calculated for each measurement during the test. In each test all assembly and/or quality problems were noted and summarised. The test case assembly was chosen since it is based on manual assembly and it is relatively easy to assemble and isolate this process from other noise factors.
Several test series were performed to evaluate different scenarios and investigate the importance of how the assembly was performed. The two most relevant tests are included in this study and are described below:
3.1.1. Test one, to investigate operator variation
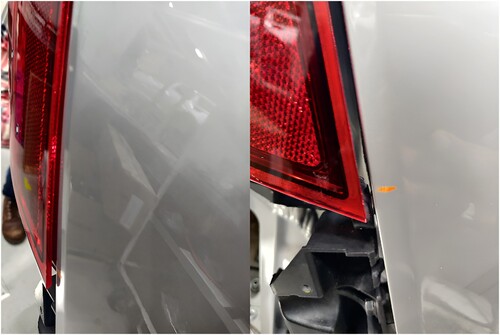
The operator was not given any detailed instruction on how to assemble the lamp to the body, only where it should be positioned, which fasteners to use and the screw sequence to use. This test aims to simulate what happens when instructions are lacking/ignored or proper training of the task is missing. In this test, assembly was possible but due to the different approaches with regards to gripping, assembly direction, assembly force, etc. between the two operators, the lamp ended up in different positions resulting in different measuring results and fitment, see Figure .
Figure 11. Fitment issues, left Flush and right Gap.
The results show that human errors will influence the geometrical quality of an assembly, and that the influence is amplified when the distance to the locators increases, which is in line with the concept of geometrical robustness (Söderberg et al. Citation2016).
The two operators conducted five trials each of assembling the body lamp on the body, and gap and flush measurements were taken for each of the measuring points. First, the mean of the measurements was calculated, and then the difference between operator A and operator B was assessed. The measures with highest influence turned out to be P2-4 in gap direction, as shown in Table . The table shows the mean, in mm, for each measure and the difference between the mean values for operator A and B.
Table 1. Human error test data.
3.1.2. Test two, to investigate the influence from screw sequence
Two different screw sequences were tested, both the correct one according to the system solution which is called ‘OuterTopInner’ (OTI in Tables and ) in Figure , in this sequence the three screws are tightened in the order 1. Outer, 2. Top and 3. Inner and, another one called ‘InnerTopOuter’ (ITO in Tables and ), see Figure , in this sequence the three screws are tightened in the order 1. Inner, 2. Top and 3. Outer. The second sequence was selected due to experience from the company and initial tests showing that this sequence has a significant effect on the positioning of the lamp. More sequences were tested, and this will be elaborated below. In this test the operators were given detailed instructions on all parts of the assembly process and the test was supervised to make sure that these instructions were followed. In this way, the effect from screw sequence could be isolated.
Figure 12. Screw locations.
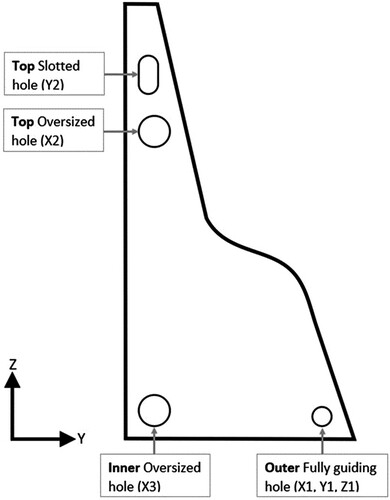
Table 2. Screw sequence test data mean difference.
Table 3. Screw sequence test data, min–max value difference.
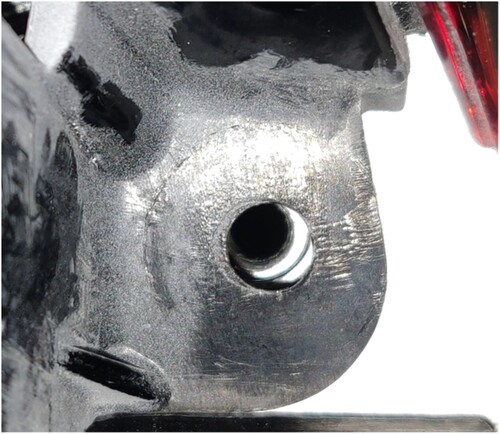
The results show that changing the screw sequence to another sequence than the one intended will influence the geometrical quality. The results for the two sequences can be seen in Tables and , and this will be further discussed in Section 3.3. The measures most affected by the change of sequence are P1 and P3. Already in this test the misalignment of screw holes was apparent, see Figure . This shows the impact from mis-constraining when altering the screw sequence. Several more sequences were tested resulting in misalignment of screw holes so severe that full assembly was impossible without using excessive force. For example, tightening the top screw first, which was intended only to locate in only one direction, X-direction, made that locator a full-steering locator locking the lamp in X-, Y- and Z-directions. This created a completely different locating scheme than the one intended and actually made full assembly impossible.
Figure 13. Misalignment of screw hole.
3.2. Method for simulating mis-constraining virtually in CAT
As shown previously several types of errors can be introduced by the operator when performing a manual assembly, and some of them affect the geometrical quality. The objective of this study was to illustrate one of these errors, mis-constraining of the locators. This phenomenon needs to be included in the variation simulation capabilities in CAT tools. Therefore, a new method to create mis-constrained locating schemes in CAT for variation simulation of manual assembly when mis-constraining occurs is suggested.
Results from the industrial test cases were used as input to determine and develop a suitable simulation algorithm for prediction of variation when mis-constraining occurs in manual assembly.
3.2.1. CAT simulation method
As previously described, a locating scheme consists of three A locators, two B locators and one C locator. Due to mis-constraining, there might be more possible A, B and/or C locators. Say that we have m possible A locators, and we want to know how many different combinations there exist, when the order of the three A locators does not matter.
This can be written as
Similarly, if we have k possible B locators, we get
And with j possible C-locators
The total number of possible locating schemes will then be
If the possible number of A, B and C locators are
= sizeA,
= sizeB and
= sizeC, all the possible locating schemes can now be created as:
Calculate the possible combinations for the A locators
For i = 1 to sizeA-2
For j = i + 1 to sizeA-1
For k = j + 1 to sizeA
A1 = i
A2 = j;
A3 = k
Store A1, A2 and A3
Calculate the possible combinations for the B locators
For j = 1 to sizeB-1
For k = j + 1 to sizeB
B1 = j
B2 = k
Store B1 and B2
Create all locating schemes
For i = 1 to nA
For j = 1 to nB
For k = 1 to nC
A1 = A1i
A2 = A2i
A3 = A3i
B1 = B1j
B2 = B2j
C = Ck
If the locating scheme is feasible (not singular):
Store it
This algorithm has been implemented as a function in the CAT tool RD&T and is used for the remaining part of this study.
3.2.2. Suggested new working method in CAT
To start with, the user needs to define if all or just some locators are susceptible for mis-constraining and in which directions. This is done by selecting for example that an A locator can become a C locator etc. using buttons as shown in Figure .
Figure 14. Defining locators susceptible to mis-constraining.
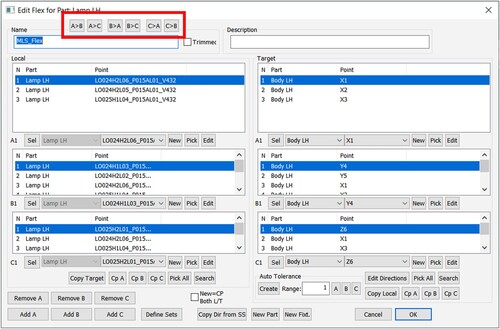
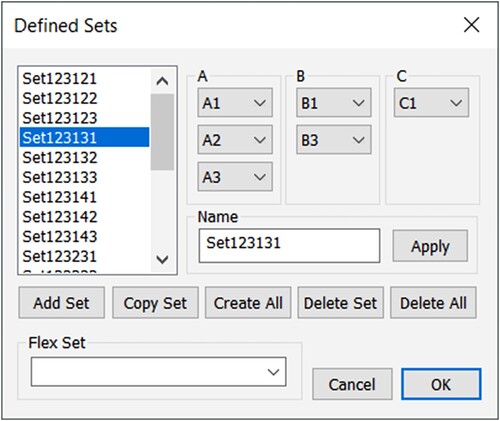
Thereafter, the user generates all possible locator schemes (sets) based on the locators susceptible to mis-constraining, using the buttons in Figure (see previous section how these are generated). In this study, the locators are realised by points but in reality they are some type of features such as holes, slots, pins, surfaces, etc.
Figure 15. Generating all possible locator schemes (Sets).
Depending on the locating scheme, the assembly operation, the geometry of the part and the type of locating features, some locators may be susceptible to mis-constraining and some may not. Some experience and knowledge of the product and process are needed to decide what locators to include. In general, locators realised by some type of pin (clip, bolt, guiding pin, etc.) locating into a hole or slot are more susceptible to mis-constraining. Surface locators are usually not (Lindau et al. Citation2013), given the low clamping forces used in manual assembly.
However, this function can be expanded using features instead of points in the simulation model and then the selection of which locators that are susceptible to mis-constraining can then be done automatically.
Variation simulation is then performed, and in this stage, the created locating schemes are tested for feasibility. Singular locating schemes, where not all degrees of freedom are locked, are automatically excluded from the simulation. The results are presented as an RMS (RootMeanSquare) value of all critical measures, including the worst, the intended and the best locating scheme. This results in a range for the expected variation in the assembly, given that mis-constraining occurs.
3.3. Validation of method with physical tests
To validate the method a CAT simulation model in RD&T of the lamp assembly used for the industrial test case was created, using the intended locating scheme and all the part tolerances according to drawings, etc.
Based on the previous analysis, the locators X1 and X3, see Figure , were determined to be susceptible of mis-constraining in Y and Z directions. This means that 21 different possible locating schemes can be created using the following:
The A-plane will always consist of the same locators X1-X3 and steer in X-direction
The B-line can be constructed of X1, X3 in Y or Z direction and/or Y4 and Y5 in Y direction in all possible combinations
The C-point can be constructed with X1 or X3 in Y or Z direction or Z6 in Z direction
Figure 16. Locating scheme with tolerances for lamp.
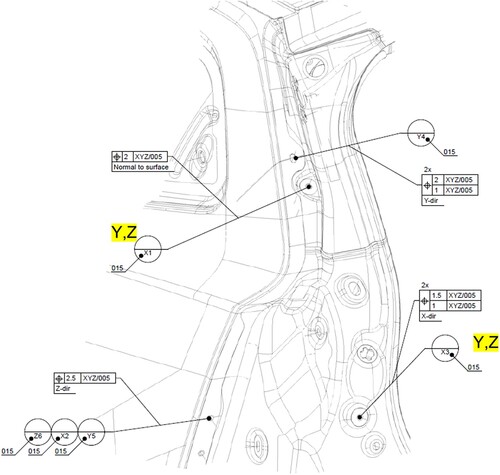
That gives the possible locators shown in Figure . All different possible locator schemes were then generated automatically as described before. The same 6 measuring points were defined as in the physical tests, see Figure .
Figure 17. Locating scheme with mis-constrained locators.
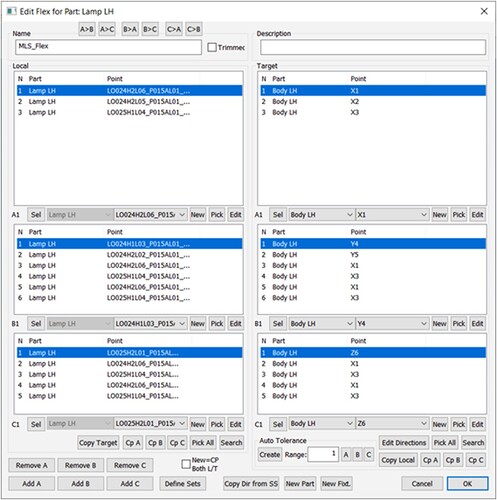
Figure 18. Measures in CAT simulation model.
5000 Monte Carlo simulation were then made to simulate variation in these measures. All possible locating schemes are automatically simulated for each measure as described before. During the simulation several sets of locators are not possible to use, since the results are singular. These sets are automatically removed from the simulation. For example, set 123-24-1 is one of the removed sets. It uses Y5 and X3 as B-locators in Y and Z6 as C-locator in Z, see Figure .
Figure 19. Singular locating scheme.
The results are shown in Table . The RMS of variation for all 6 measures is automatically calculated for easy comparison between different locating schemes. The intended locating scheme has an overall variation of around 1 mm and the worst mis-constrained location scheme of around 6 mm. The added variation comes both from the locating scheme being different (i.e. less robust) and the fact that some locators have larger tolerances in their non-intended steering directions. The worst set, 123131, has the Y-line (B-locator) consisting of the two TOP locators in Figure , which is due to the screw sequence Inner Top Outer being used in this set. The worst simulation screw sequence is also the same as the worst sequence in the physical tests verifying the results.
Table 4. Monte Carlo simulation of variation case 1.
Comparing this with the physical test results in Table , showing the mean difference between the two different screw sequences described in Section 4.1 and Table , describing the min–max difference between each measure for the two tested sequences the same phenomena can be seen as in the simulation model. Changing the screw sequence, i.e. changing the locating scheme, will create a major difference in the measures. For example, in P1-Flush, the physically measured value differs more than 1 mm for the two screw sequences, which then consumes the entire allowed tolerance zone for that measure. This validates that there is an unneglectable influence of mis-constraining in manual assembly and that one type of misalignment is incorrect screw order (or assembly order for other types of fasteners).
In Figure the total RMS variation for all measures in the different tests are show. The first 2 bars show the results from physical test one. In these tests the intended screw order is used, and this shows the amount of variation added just by the operator. In these tests that is between 0.15 and 0.3 mm. This will serve as a baseline for the physical tests.
Figure 20. RMS variation.
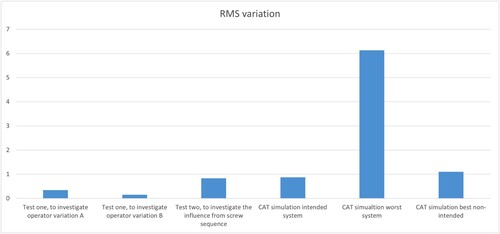
The third bar shows the result from physical test two, where several screw sequences were used. This test generates a variation of 0.8 mm, significantly larger than just the operator variation, an increase of up to 5.5 times. Fourth bar shows the simulation result in CAT for the intended screw sequence. This will serve as a baseline for simulations to compare with the mis-constrained screw sequences. Note that actual numbers cannot be compared. In the physical tests, only one body and lamp were used but in CAT 5000 different samples are used which will skew the results and generate more variation in the simulation. However, trends and relations between different location schemes and the resulting variation can be observed. In the CAT simulation, the results for the worst and best mis-constrained locating scheme can be seen in bars 5 and 6. For the worst, we can observe an increase of 7 times. This corresponds with the significant increase in the physical tests and shows that the simulation method can be used to predict variation when mis-constraining occurs.
3.4. Problem description, case 2
In the second test case an assemble yourself furniture was used. Commonly available in several brands of furniture stores it consists of chipboard pieces in flat packages that the customers assemble themselves in their home using the supplied assembly instructions. The assembly instructions are quite sparse and the operator (the customer) can be assumed to not be a professional furniture builder. So, in this case a lot of variation can be expected in the assembly order and the way the assembly is performed.
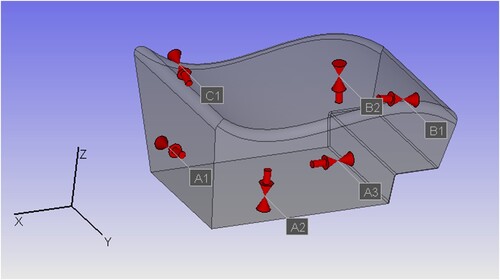
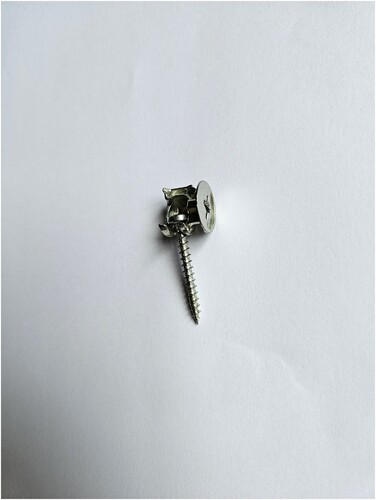
The simulated cabinet can be seen in Figure . It consists of four pieces of chipboard assembled with eight fasteners. The fasteners are screws entering non-gripping holes and then orthogonal insert nuts are tightened, see Figures and .
Figure 21. Cabinet.
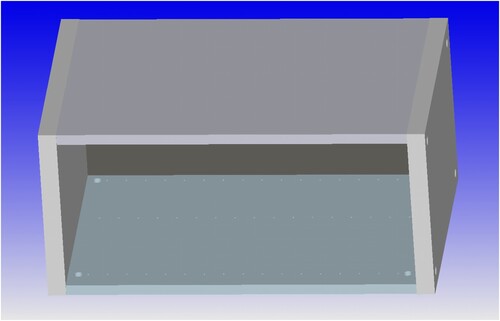
Figure 22. Fitted fasteners.
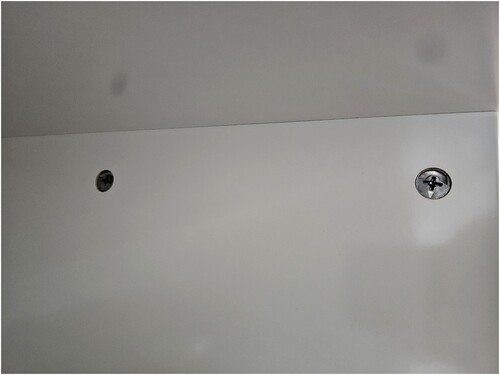
Figure 23. Fastener unassembled.
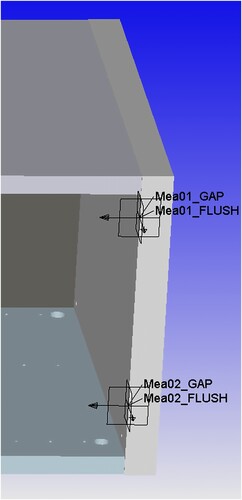
The first step of the assembly is simulated, to fit the bottom board to the sides of the cabinet. The gap and flush towards the drawer that goes into the cabinet are then evaluated after assembly, see Figure . From a customer aesthetic perspective, it is desirable to have an even consistent gap all around the drawer and a drawer in flush with the sides. Furthermore, the gap also affects the function of the cabinet, if the gap is too small the drawer will be difficult to move or even not fit all the way in.
Figure 24. Gap and Flush measurements.
No specific assembly order of the fasteners is specified in the instructions meaning that it can be assumed that any assembly order can occur of the three fasteners. The baseline locating scheme can be seen in Figure , with A1-A3 forming a plane in Y- direction, B1-B2 forming the line in Z-direction and C1 locking X-direction. However, since all locators are the same any of the three fasteners can become B1, B2 and C1 depending on the assembly order. That also means that the B-line can be in Z or X-direction and the C point can be in X or Z-direction. Using the method as in Section 3.2 this generates 16 possible locating schemes depending on the assembly order.
Figure 25. Baseline locating scheme.
In Figure , the four measures used for evaluation are shown. These measures are used to evaluate gap and flush between the frame of the cabinet and the drawer.
As in case number 1, 5000 Monte Carlo simulation were then made to simulate variation in these measures. All possible locating schemes are automatically simulated for each measure as described before, and in this case none of the 16 locating schemes were singular so all could be simulated.
The results are shown in Table . The RMS of variation for all four measures is automatically calculated for easy comparison between different locating schemes in the same way in case 1. The intended locating scheme, 123125, which also is the best one, has an overall variation of around 0.84 mm and the worst mis-constrained location scheme, 123364, of around 1.13 mm. The added variation comes from the locating scheme being different (i.e. less robust). In Figure locating scheme 123364 can be seen. Comparing the best and the worst outcome shows that the worst assembly order adds 35% more variation to the product, affecting both the aesthetic and the function. The most affected measures are the flush measures with almost 70% increase in standard deviation, see Figure . Obviously, a large improvement in product quality and function could be achieved by making sure that the operator assembles the product in the correct order.
Figure 26. Locating scheme 123364.
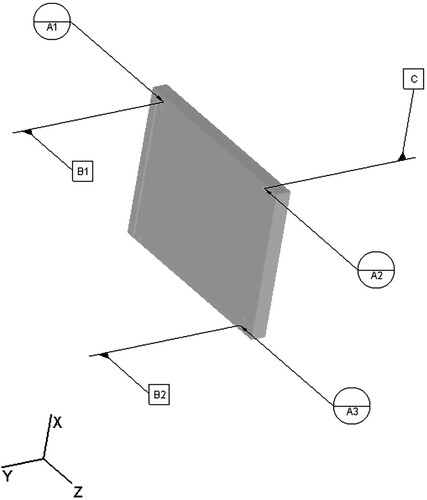
Figure 27. Variation for the best and worst locating scheme.
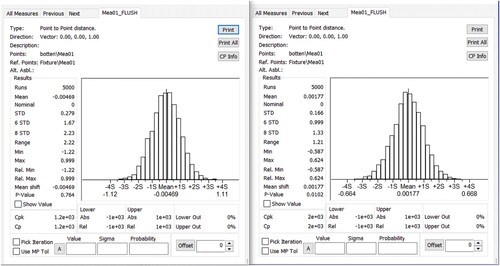
Table 5. Monte Carlo simulation of variation case 2.
3.5. Optimisation of an existing design in production
Additionally, the method can be used for an existing design solution to optimise the geometrical quality. In running production, it is seldom possible to change the parts or the process layout and the geometrical outcome (variation and mean shift) in critical points on the parts are stable. However, changing the screw/assembly order might be possible.
In order to simulate this, the intended tolerances in the CAT simulation model for case 1 were replaced with actual measurement data on the ingoing parts and assemblies and the simulation was re-run in the same way as described in Section 3.3. The last 2 months of production data were used resulting in 18750 simulation loops.
Depending on the geometrical deviations on the included parts, which may differ from allowed tolerances on drawings, the intended locating scheme might no longer be the most robust given the context. In Table the simulation results for the same case as used in Section 3.3 but with measurement data instead of drawing tolerances can be seen.
Table 6. Simulation of variation with measurement data case 1.
As seen in Table , with these measurement data as input, the most robust locating scheme is not the intended that has a RMS variation of 2,01 mm instead it is the location scheme in set 123142 that has a RMS variation of 1,66 mm. Changing the instructions for that assembly to a new screw order corresponding to set 123142 will give a 17% reduction in variation in the critical measures without any additional production cost or time.
Using this function to evaluate running production can be a quick and easy method to find cost-effective improvements to reduce variation, in some cases there will be assemblies that benefit from changing the screw/assembly order (in reality the locating scheme).
4. Results
The results from this study can be divided into different categories and those are shortly summarised below.
4.1. Input to CAT simulation
The physical tests confirmed that mis-constraining of manual assembly can occur and that one possible mode of this is that a part is located with a certain set of points, but which point locks which degree of freedom can be altered in relation to the intended solution. This will position the part in space and lock all degrees of freedom but with a different locating scheme than the intended engineering solution.
So, to simulate variation and make a relevant prediction of the total variation for such an assembly, all the possible mis-constrained locating schemes need to be included in the simulation.
4.2. Variation simulation of mis-constrained locating schemes in CAT
In order to simulate variation including the effects of mis-constraining, all possible locating schemes need to be generated and variation needs to be calculated for each one of the locating schemes in all critical measures. The critical measures can be anything that is important for the product, aesthetical or functional. In this paper, an automated function is suggested that calculates all possible locating schemes that can occur, sorting out the singular ones (that would not be possible to assemble) and present a tolerance band for the assembly. The function can either simulate all possible locating schemes for all the six locators or a selection based on user input on which locators that are susceptible to mis-constraining. Further, the function can be used to optimise geometrical robustness of existing design solutions and improve quality without any need for product or process layout change.
4.3. Results from virtual simulation of industrial cases
The simulation results are consistent with the physical tests. It shows that changing the screw order, which leads to a change of locating scheme, will affect how variation propagates in the assembly and thereby the geometrical quality of the assembly. The proposed functionality gives an easy and quick way to, in minutes, simulate the effects of mis-constraining in variation simulation.
5. Discussion
When building a CAT simulation model the purpose is to create an accurate representation of the product and process. If the simulated variation is to be relevant, as many as possible of the contributors to variation need to be present in the simulation model. For manual assembly, variation added by the operator is often omitted or added as a generic number seldom representing the actual figures. There is a valid reason for this, since few tools exist to calculate such tolerances and it is time-consuming to derivate these by physical tests.
However, that does not mean that the variation added by the operator can be neglected. In this research, it is shown that just the tolerance added by the operator can be bigger than the entire allowed tolerance zone.
Mis-constraining in manual assembly is a quite immature research area, and there are many more types of mis-constraining that can occur than addressed in this paper; one example being that due to tolerance on parts, physical contact occurs in other areas than intended, creating new, unknown, locators and yet more new locating schemes.
The simulation technique suggested in this research does not cover all types of mis-constraining, but it addresses the most common type and is a good start to adding this contributor to variation sources in geometry assurance. In the cases presented the focus has been on aesthetical errors caused by mis-constraining, but depending on product, functional requirements may be of more importance and the method is universal. Instead of gap and flush, other types of measurements can be simulated such as clearance, grip between an axle and a bearing, etc.
As a first step in the product development, the focus should of course be on avoiding mis-constraining and human effects on the products and assembly. Several good methods exist for this task; DFMA (Design For Manufacture and Assembly) provides a comprehensive set of tools to design products with manufacturing in mind to ensure the best transition to production (Bayoumi Citation2000), physical methods to ensure that the correct assembly order and parts are used, for example Poka-Yoke (Dudek-Burlikowska and Szewieczek Citation2009) and Augmented Reality (Wang, Ong, and Nee Citation2016) or complete strategies for manufacturing with focus on reducing waste throughout the entire process such as Lean Manufacturing (Gupta and Jain Citation2013). However, despite trying to avoid human errors and mis-constraining this will still occur to some extent and therefore it is important to be able to quantify the effects. In addition, in assembly processes where limited consideration to human errors was made during product development, the possibility to optimise these adds important value.
In this research parts are assumed to be rigid, however this is not valid for all parts. Some parts will be non-rigid and then the analysis needs to be based on finite element analysis, i.e. a non-rigid variation simulation needs to be performed (Wärmefjord et al Citation2016). However, the same functionality and calculation can still be used.
Future research includes algorithms that automatically find which locators might mis-constrain and identify additional areas where unwanted physical contacts could occur and adding them to the simulation as potential locators.
6. Conclusions
The proposed method in the CAT tool RD&T enables the simulation of mis-constraining for manual assembly processes, and the inputs can be added in a convenient and structured way to the simulation model. This facilitates improved accuracy in the simulation results and highlights the need for consideration of manual assembly tolerances when predicting total variation of an assembly. In addition, the method can be used to improve geometrical robustness for existing designs by finding the optimal screw/assembly order given the physical shape of the included parts.
The industrial test cases show promising results, verifying that mis-constraining affects the geometrical outcome. Including this in variation simulations improves the accuracy of the CAT simulation results. More test cases need to be done to validate the method and more research is needed to investigate more types of mis-constraining.
Acknowledgements
This work was carried out at the Wingquist Laboratory within the Area of Advance - Production at Chalmers University of Technology in Göteborg, Sweden, supported by the Swedish Governmental Agency for Innovation Systems (VINNOVA). The support is gratefully acknowledged. Furthermore, the authors acknowledge the financial support provided by ‘Fordonsstrategisk Forskning och Innovation’ (FFI). Big thanks to Erik Arvidsson and Vasanth Kumar that performed all the physical tests in this research.
Disclosure statement
No potential conflict of interest was reported by the author(s).
Additional information
Funding
References
- Bayoumi, A. M. E. 2000. “Design for Manufacture and Assembly (DFMA): Concepts, Benefits and Applications.” In Current Advances in Mechanical Design and Production VII, 501–509. Elsevier.
- Berlin, Cecilia, Matilda Wollter Bergman, Maral Babapour Chafi, Ann-Christine Falck, and Roland Örtengren. 2021. “A Systemic Overview of Factors Affecting the Cognitive Performance of Industrial Manual Assembly Workers.” Paper Presented at the Congress of the International Ergonomics Association.
- Boorla, Murthy S, Tobias Eifler, Chris McMahon, and Thomas J Howard. 2018. “Product Robustness Philosophy – A Strategy Towards Zero Variation Manufacturing (ZVM).” Management and Production Engineering Review.
- Chaiprapat, Supapan, and Somkiet Rujikietgumjorn. 2008. “Modeling of Positional Variability of a Fixtured Workpiece due to Locating Errors.” The International Journal of Advanced Manufacturing Technology 36 (7): 724–731. https://doi.org/10.1007/s00170-006-0889-4.
- Chiabert, P., F. Lombardi, and M. Orlando. 1998. “Benefits of Geometric Dimensioning and Tolerancing.” Journal of Materials Processing Technology 78 (1–3): 29–35. https://doi.org/10.1016/S0924-0136(97)00459-7.
- Coletti, Paolo, and Thomas Aichner. 2011. “Mass Customization.” In Mass Customization, 23–40. Springer.
- Di Pasquale, Valentina, Salvatore Miranda, Walther Patrick Neumann, and Azin Setayesh. 2018. “Human Reliability in Manual Assembly Systems: A Systematic Literature Review.” Ifac-Papersonline 51 (11): 675–680. https://doi.org/10.1016/j.ifacol.2018.08.396.
- Dudek-Burlikowska, Marta, and D. Szewieczek. 2009. “The Poka-Yoke Method as an Improving Quality Tool of Operations in the Process.” Journal of Achievements in Materials and Manufacturing Engineering 36 (1): 95–102.
- Falck, Ann-Christine, Roland Örtengren, Mikael Rosenqvist, and Rikard Söderberg. 2017. “Proactive Assessment of Basic Complexity in Manual Assembly: Development of a Tool to Predict and Control Operator-Induced Quality Errors.” International Journal of Production Research 55 (15): 4248–4260. https://doi.org/10.1080/00207543.2016.1227103.
- Fasth, Åsa, Johan Stahre, Kerstin Dencker, W. Karwowski, and G. Salvendy. 2010. “Level of Automation Analysis in Manufacturing Systems.” In Advances in Human Factors, Ergonomics, and Safety in Manufacturing and Service Industries, 233–242.
- Fogliatto, Flavio S, Giovani JC Da Silveira, and Denis Borenstein. 2012. “The Mass Customization Decade: An Updated Review of the Literature.” International Journal of Production Economics 138 (1): 14–25. https://doi.org/10.1016/j.ijpe.2012.03.002.
- Forslund, Karin, MariAnne Karlsson, and Rikard Söderberg. 2013. “Impacts of Geometrical Manufacturing Quality on the Visual Product Experience.” International Journal of Design 7 (1).
- Fujimoto, Hideo, and Alauddin Ahmed. 2001. “Entropic Evaluation of Assemblability in Concurrent Approach to Assembly Planning.” In Paper Presented at the Proceedings of the 2001 IEEE International Symposium on Assembly and Task Planning (ISATP2001). Assembly and Disassembly in the Twenty-First Century. (Cat 01TH8560).
- Garvin, David A. 1984. “Product Quality: An Important Strategic Weapon.” Business Horizons 27 (3): 40–43. https://doi.org/10.1016/0007-6813(84)90024-7.
- Gupta, Shaman, and Sanjiv Kumar Jain. 2013. “A Literature Review of Lean Manufacturing.” International Journal of Management Science and Engineering Management 8 (4): 241–249. https://doi.org/10.1080/17509653.2013.825074.
- Hanson, L. 2020. “Integration of Simulation and Manufacturing Engineering Software-Allowing Work Place Optimization Based on Time and Ergonomic Parameters.” In Paper Presented at the DHM2020: Proceedings of the 6th International Digital Human Modeling Symposium. August 31–September 2, 2020.
- Hanson, Lars, Dan Högberg, Johan S Carlson, Robert Bohlin, Erik Brolin, Niclas Delfs, Peter Mårdberg, Gustafsson Stefan, Ali Keyvani, and Ida-Märta Rhen. 2014. “IMMA – Intelligently Moving Manikins in Automotive Applications.” Paper Presented at the Third International Summit on Human Simulation (ISHS2014).
- Hanson, Lars, Dan Högberg, Johan S Carlson, Niclas Delfs, Erik Brolin, Peter Mårdberg, Domenico Spensieri, Staffan Björkenstam, Johan Nyström, and Fredrik Ore. 2019. “Industrial Path Solutions – Intelligently Moving Manikins.” In DHM and Posturography, 115–124. Elsevier.
- Howard, Thomas J, Tobias Eifler, Søren Nygaard Pedersen, Simon Moritz Göhler, Srinivasa Murthy Boorla, and M. E. Christensen. 2017. “The Variation Management Framework (VMF): A Unifying Graphical Representation of Robust Design.” Quality Engineering 29 (4): 563–572. https://doi.org/10.1080/08982112.2016.1272121.
- Khodaygan, S. 2013. “A Method for Locator Errors Compensation in the Fixture – Workpiece System.” SAE International Journal of Materials and Manufacturing 6 (3): 494–501. https://doi.org/10.4271/2013-01-1382.
- Lindau, Björn, Kristina Wärmefjord, Lars Lindkvist, and Rikard Söderberg. 2013. “Aspects of Fixture Clamp Modeling in non-Rigid Variation Simulation of Sheet Metal Assemblies.” Paper Presented at the ASME International Mechanical Engineering Congress and Exposition.
- Lööf, Johan. 2010. Managing Geometrical Variation Through Optimization and Visualization. Chalmers University of Technology.
- Lööf, Johan, Lars Lindkvist, and Rikard Söderberg. 2009. “Optimizing Locator Position to Maximize Robustness in Critical Product Dimensions.” In Paper Presented at the International Design Engineering Technical Conferences and Computers and Information in Engineering Conference.
- Marin, Rodrigo A, and Placid M Ferreira. 2003. “Analysis of the Influence of Fixture Locator Errors on the Compliance of Work Part Features to Geometric Tolerance Specifications.” Journal of Manufacturing Science and Engineering 125 (3): 609–616. https://doi.org/10.1115/1.1578669.
- Mikael, Rosenqvist, Falck Ann-Christine, Lindkvist Lars, and Söderberg Rikard. 2016. “Variation Analysis Considering Manual Assembly Complexity in a CAT Tool.” Procedia Cirp 43: 94–99. https://doi.org/10.1016/j.procir.2016.02.020.
- Pascual, Aitor Iriondo, Dan Högberg, Anna Syberfeldt, Erik Brolin, and Lars Hanson. 2020. “Optimizing Ergonomics and Productivity by Connecting Digital Human Modeling and Production Flow Simulation Software.” Advances in Transdisciplinary Engineering 13: 193–204.
- Rekiek, Brahim, Pierre De Lit, and Alain Delchambre. 2000. “Designing Mixed-Product Assembly Lines.” IEEE Transactions on Robotics and Automation 16 (3): 268–280. https://doi.org/10.1109/70.850645.
- Riedel, A., J. Gerlach, M. Dietsch, S. Herbst, F. Engelmann, N. Brehm, and T. Pfeifroth. 2021. “A Deep Learning-based Worker Assistance System for Error Prevention: Case Study in a Real-World Manual Assembly.” Advances in Production Engineering & Management 16 (4): 393–404. https://doi.org/10.14743/apem2021.4.408.
- Rong, Y., Wei Hu, Y. Kang, Y. Zhang, and David W Yen. 2001. “Locating Error Analysis and Tolerance Assignment for Computer-Aided Fixture Design.” International Journal of Production Research 39 (15): 3529–3545. https://doi.org/10.1080/00207540110056243.
- Rosenqvist, M., A. C. Falck, and R. Söderberg. 2015. “Working Procedure for Early Proactive Geometry Assurance Considering Manual Assembly Complexity.” In Paper Presented at the ASME International Mechanical Engineering Congress and Exposition.
- Rosenqvist, Mikael, Ann-Christine Falck, and Rikard Söderberg. 2016. “Including Measures of Assembly Complexity in Proactive Geometry Assurance, a Case Study.” Procedia Cirp 44: 151–156. https://doi.org/10.1016/j.procir.2016.01.194.
- Rosenqvist, Mikael, Ann-Christine Falck, R. Söderberg, and K. Wärmefjord. 2013. “Operator Related Causes for low Correlation Between cat Simulations and Physical Results.” In Paper Presented at the ASME International Mechanical Engineering Congress and Exposition.
- Samy, Sameh Nozhy, and Hoda ElMaraghy. 2010. “A Model for Measuring Products Assembly Complexity.” International Journal of Computer Integrated Manufacturing 23 (11): 1015–1027. https://doi.org/10.1080/0951192X.2010.511652.
- Shen, Zhengshu, Gaurav Ameta, Jami J Shah, and Joseph K Davidson. 2005. “A Comparative Study of Tolerance Analysis Methods.”. In International Design Engineering Technical Conferences and Computers and Information in Engineering Conference, vol. 46970, pp. 471–482. 2004.
- Sivadasan, Suja, Janet Efstathiou, Ani Calinescu, and L Huaccho Huatuco. 2006. “Advances on Measuring the Operational Complexity of Supplier–Customer Systems.” European Journal of Operational Research 171 (1): 208–226. https://doi.org/10.1016/j.ejor.2004.08.032.
- Söderberg, Rikard. 1998. “Robust Design by Support of CAT Tools.” In Paper Presented at the International Design Engineering Technical Conferences and Computers and Information in Engineering Conference.
- Söderberg, Rikard, and Lars Lindkvist. 1999. “Computer Aided Assembly Robustness Evaluation.” Journal of Engineering Design 10 (2): 165–181. https://doi.org/10.1080/095448299261371.
- Söderberg, Rikard, Lars Lindkvist, and Johan S Carlson. 2006. “Managing Physical Dependencies Through Location System Design.” Journal of Engineering Design 17 (4): 325–346. https://doi.org/10.1080/09544820500275685.
- Söderberg, Rikard, Lars Lindkvist, Kristina Wärmefjord, and Johan S Carlson. 2016. “Virtual Geometry Assurance Process and Toolbox.” Procedia Cirp 43: 3–12. https://doi.org/10.1016/j.procir.2016.02.043.
- Stylidis, Kostas, Casper Wickman, and Rikard Söderberg. 2020. “Perceived Quality of Products: A Framework and Attributes Ranking Method.” Journal of Engineering Design 31 (1): 37–67. https://doi.org/10.1080/09544828.2019.1669769.
- Svensson Harari, Natalia, Jessica Bruch, and Mats Jackson. 2014. “Mixed-Product Assembly Lines: Characteristics and Design Challenges.” In Paper Presented at the 6th Swedish Production Symposium, SPS14. Gothenburg, Sweden.
- Taguchi, Genichi. 1986. “Introduction to Quality Engineering: Designing Quality into Products and Processes.”
- Taguchi, Genichi, Subir Chowdhury, and Yuin Wu. 2005. Taguchi’s Quality Engineering Handbook, 134. Hoboken, NJ: John Willey.
- Torres, Yaniel, Sylvie Nadeau, and Kurt Landau. 2021. “Classification and Quantification of Human Error in Manufacturing: A Case Study in Complex Manual Assembly.” Applied Sciences 11 (2): 749. https://doi.org/10.3390/app11020749.
- Ullman, David. 2009. EBOOK: The Mechanical Design Process. McGraw hill.
- Vishnupriyan, S., M. C. Majumder, and K. P. Ramachandran. 2011. “Optimal Fixture Parameters Considering Locator Errors.” International Journal of Production Research 49 (21): 6343–6361. https://doi.org/10.1080/00207543.2010.532167.
- Wang, Xiangyu, Soh K Ong, and Andrew YC Nee. 2016. “A Comprehensive Survey of Augmented Reality Assembly Research.” Advances in Manufacturing 4: 1–22. https://doi.org/10.1007/s40436-015-0131-4.
- Wärmefjord, Kristina, Rikard Söderberg, Björn Lindau, Lars Lindkvist, and Samuel Lorin. 2016. “Joining in nonrigid variation simulation.” Computer-aided technologies–applications in engineering and medicine.
- Wartenberg, Constanze, Tania Dukic, Ann-Christine Falck, and Susan Hallbeck. 2004. “The Effect of Assembly Tolerance on Performance of a Tape Application Task: A Pilot Study.” International Journal of Industrial Ergonomics 33 (4): 369–379. https://doi.org/10.1016/j.ergon.2003.10.009.
- webpage, 3DCS. 2022. Accessed June 2, 2022. https://www.3dcs.com/.
- webpage, RD&T. 2022. Accessed June 2, 2022. http://rdnt.se/.
- webpage, VSA. 2022. Accessed June 2, 2022. https://www.geoplm.com/siemens-plm-software-solutions/tecnomatix-digital-factory/manufacturing-planning/vsa-variation-analysis.
- Wickman, Casper, and Rikard Söderberg. 2007. “Perception of gap and Flush in Virtual Environments.” Journal of Engineering Design 18 (2): 175–193. https://doi.org/10.1080/09544820600751023.
- Zhong, Yanru, Yuchu Qin, Meifa Huang, Wenlong Lu, Wenxiang Gao, and Yulu Du. 2013. “Automatically Generating Assembly Tolerance Types with an Ontology-based Approach.” Computer-Aided Design 45 (11): 1253–1275. https://doi.org/10.1016/j.cad.2013.06.006.
- Zhu, Xiaowei, S Jack Hu, Yoram Koren, and Samuel P Marin. 2008. “Modeling of Manufacturing Complexity in Mixed-model Assembly Lines.”
- Zio, Enrico. 2013. “Monte Carlo Simulation: The Method.” In The Monte Carlo Simulation Method for System Reliability and Risk Analysis, 19–58. Springer.