
Abstract
Purpose: To evaluate health care utilization, treatment patterns and costs among patients with mycosis fungoides-cutaneous T-cell lymphoma (MF-CTCL).
Methods: This retrospective cohort study queried the HealthCore Integrated Research Database to identify patients ≥18 years with ≥2 diagnoses of MF-CTCL (ICD-9-CM code 202.1x, 202.2x) between 07 January 2006 and 07 January 2013. Index date was defined as first MF-CTCL diagnosis. Patients were continuously enrolled ≥6 months before and ≥12 months after index date. Severe MF-CTCL was identified via systemic therapy use postindex. Generalized linear model (GLM) was used to estimate the relationship between MF-CTCL severity and healthcare costs controlling for selected factors.
Results: A total of 1981 MF-CTCL patients were evaluated: 493 (24.9%) severe and 1488 (75.1%) with mild to moderate disease. GLM analysis indicated severe MF-CTCL patients incurred higher all-cause healthcare total costs compared to patients with mild-to-moderate MF-CTCL (coefficient estimate: 4.19, p < .0001). About 51% of patients did not receive any MF-CTCL-specific treatment within 60 days after MF-CTCL diagnosis.
Conclusions: MF-CTCL severity was associated with greater healthcare resource utilization and costs. These findings suggest that about half of MF-CTCL patients do not receive MF-CTCL-specific treatment within 60 days following initial diagnosis. Future studies are needed to understand reasons for delayed treatment initiation.
Introduction
Cutaneous T-cell lymphoma (CTCL) refers to a group of visible lymphoproliferative malignancies characterized by neoplastic T-lymphocytes in the skin with mycosis fungoides (MF) as the most frequent subtype (Citation1–3). MF-CTCL and a leukemic form, Sezary Syndrome (SS), make up approximately 80% of these relatively rare but potentially devastating cutaneous lymphomas (Citation1,Citation3). MF-CTCL typically occurs in three stages – patch, plaque and tumor. It is not unusual for the patch or early phase to remain at that stage for several years as patchy nonspecific dermatitis on the lower trunk and buttocks. Patches may sometimes be wrinkled and have irregular pigmentation patterns, and pruritus, the urge to scratch, is low or nonexistent at this stage (Citation4). MF-CTCL may be followed by common, indolent inflammatory courses that include different forms of dermatitis or parapsoriasis, often large plaque type and may exist over years or decades as the plaque-stage or patch-stage MF-CTCL (Citation5). When well developed, plaques form the basis of MF-CTCL diagnoses and are accompanied by intense pruritus. When these plaques are found on 10% of the body surface, they are classified as stage IA, and when these legions exceed 10%, they are categorized as IB and have been known to remain at these stages for years or decades without any additional development. In more severe cases, the disease could progress to clinical lymphadenopathy or stage IIA, and in some instances, growth of the plaques results in tumor formation or stage IIB. These processes take many years and even decades to develop, and ulcers are a likely result of tumor formation (Citation2,Citation6,Citation7).
During 1973–2002, the annual incidence of CTCLs in the United States (US) was 6.4 persons per million population (Citation8). Epidemiological analyses of the Surveillance, Epidemiology, and End Results (SEER) data indicate that from the 1990s, CTCLs were on the increase in the United States (Citation1,Citation9), and studies have indicated a threefold increase during the past two to three decades (Citation8–10). One projection suggested that incidence of CTCL could have reached approximately 10 cases per million in the 2000–2010 time frame (Citation9). Incidence rates for 2011–2012 for mycosis fungoides/Sezary syndrome was estimated at 0.4 per 100,000, and there were 1690 new cases in 2016 (Citation11).
A staging system linked to disease prognosis is important in the treatment of MF-CTCL (Citation12,Citation13). The National Comprehensive Cancer Network (NCCN) guideline, in general, divides treatment into skin-directed therapy, systemic therapy and combination therapy. Treatment selection is based primarily on clinical stage (I, II, III, IV) and TNMB (tumor-node-metastasis-blood) classification (Citation14). In general, patients with early-stage CTCL are given skin-directed treatments, which may be repeated several times using maintenance and medication tapering, and many patients may never advance to systemic therapy (Citation2,Citation14). Patients with more advanced disease may need immunotherapy or chemotherapy (Citation2,Citation14). Biologics are often the first choice in the treatment of advanced or refractory disease, with chemotherapies administered later in the disease process if necessary (Citation2,Citation14). In addition, a role is emerging for allogeneic stem cell technologies, notably transplantation (Citation2,Citation14–16).
Patients with CTCL experience reduced health-related quality of life, specifically in the physical, emotional and functional domains. Demierre et al., reporting results from a 2005 National Cutaneous Lymphoma Foundation Survey reported that CTCL had a profound impact on patients’ health-related quality of life (HRQOL). The majority of patients responding to the survey had MF (89%), 94% reported being troubled by the redness of their skin, 63% noted it affected their choice of clothing, and 62% reported feeling unattractive. Most respondents reported affected sleep, in excess of 90% reported worrying about the seriousness of the disease, while 80% agonized over dying from the condition. While 85% reported benefits from treatment some 61% felt burdened by the treatment costs (Citation17). An earlier study by Demierre et al reported that patients with CTCL in advanced stages had worse HRQOL scores (Citation18).
In addition to the negative impact on quality of life, MF-CTCL may impose a substantial economic burden on the healthcare system. A retrospective observational study of 58 patients with MF stage IIB or worse in Italy found the mean direct medical cost per patient was €9,231.40 (Citation19). Despite the above study’s unique contribution to the field, the findings do not offer insights into costs for mild-to-moderate patients and are hardly relevant to the economic burdens associated with newer specialty treatments such as biologic agents and to health economics implications in the United States.
In light of the foregoing, only limited data describing the clinical characteristics, comorbidities, treatment patterns and economic costs in patients with MF-CTCL are currently available. Such data can be vital to clinicians and health plans seeking to quantify the impact of MF-CTCL on the healthcare system, to identify the unmet medical need and to advocate in support of better treatments for this disease. The objectives of this study were to examine specific treatment patterns for MF-CTCL patients in the United States, to describe their demographics and clinical characteristics and to estimate all-cause and MF-CTCL attributable healthcare resource utilization and costs by severity during the 12-month follow-up period.
Methods
Study design and data source
This retrospective cohort study identified patients who had ≥2 MF-CTCL diagnoses (ICD-9-CM diagnosis code = 202.1x, 202.2x) on distinctly different service dates between January 1 2006 and July 31 2013 from administrative claims information curated in the HealthCore Integrated Research Database (HIRD®). The HIRD is a constantly updated repository of clinically rich and fully adjudicated longitudinal medical, pharmacy and eligibility data for more than 40 million enrollees in 14 Anthem-affiliated health plans, which are geographically dispersed across the United States. The population in the HIRD have been shown to be representative of the population in the US Census reports in terms of age and gender (Citation20).
Study population
Patient selection
Only patients with ≥2 medical claims for MF-CTCL were included in the study; the first MF diagnosis date was defined as the index date. Study patients were required to be aged 18 years or older on the index date and had at least 6 months of continuous enrollment before and 12 months after the index date.
Subcohort classification
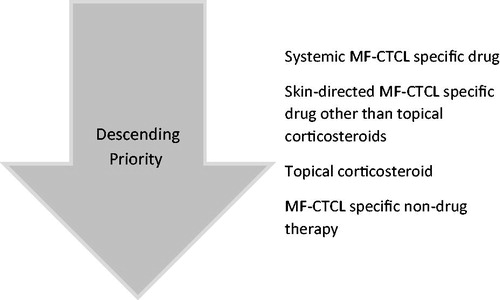
MF-CTCL-specific index treatments were identified within 60 days following the index date. The first category based on a descending priority approach included MF-CTCL-specific drugs: systemic prednisone (dose adjusted), systemic chemotherapy (methotrexate ≤100 mg weekly, temozolomide, vincristine), interferons, systemic retinoids (bexarotene, tretinoin, isotretinoin) and vorinostat, among others. Next were skin-directed MF-CTCL-specific drugs other than topical corticosteroids: topical chemotherapy (mechlorethamine, carmustine), topical bexarotene and topical imiquimod. These were followed by topical corticosteroids: halobetasol, diflorasone, mometasone, halcinonide, desoximetasone, hydrocortisone, desonide, clobetasol, betamethasone, fluocinonide, flurandrenolide, triamcinolone, fluticasone. The final category, MF-CTCL-specific nondrug therapies included another class of index treatments such as local radiation, total skin electron beam therapy (TSEBT), psoralen plus ultraviolet A phototherapy (PUVA), ultraviolet B phototherapy (UVB) and extracorporeal photopheresis (ECP).
Index treatments were selected using a hierarchical approach because patients could have multiple MF-CTCL-specific drug and nondrug therapies: MF-CTCL-specific drugs > skin-directed MF-CTCL-specific drug other than topical corticosteroids > topical corticosteroids > MF-CTCL-specific nondrug therapies, as shown in . For patients with multiple MF-CTCL-specific therapies within the hierarchy, one therapy was randomly selected as the index treatment. Patients were classified into two MF-CTCL severity levels (severe and mild to moderate) based on systemic therapy use during postindex period. Patients treated with systemic therapy during follow-up were classified as severe because these treatments are generally employed in the management of more advanced-stage MF-CTCL disease.
Figure 1. Subcohort classification.
Outcome measures
Treatment patterns
The treatment patterns of interest in this study included adherence, discontinuation, restart, switch and augmentation. Adherence was defined by medication possession ratio (MPR), which was defined as total days supplied divided by a fixed time interval (12 months) from the date of initiation of a specific index MF-CTCL drug; MPR ≥ 70% was considered adherent. Discontinuation of the index MF-CTCL-specific drug was defined by the duration of treatment gaps, and depended on whether administration was monthly (60-day gap) or every 2–3 weeks (45-day gap). Restart was defined as stopping and subsequently resuming treatment with the same index MF-CTCL specific drug. Switching was defined as the discontinuation of the index MF-CTCL-specific drug and resuming treatment with a nonindex MF-CTCL-specific drug. Augmentation was defined as adding a nonindex MF-CTCL-specific drug outside of the treatment class while still receiving the index MF-CTCL-specific drug.
Healthcare resource utilization and costs
All-cause and disease-attributable healthcare resource utilization including inpatient admissions, office and emergency room (ER) visits, and pharmacy scripts were examined. Total all-cause and disease-attributable healthcare costs including medical service costs (inpatient admissions, office visits, ER visits and other outpatient services) and pharmacy costs during the postindex 12 months period were reported. All-cause covered all observed healthcare resource utilization and costs for any reason during the postindex 12 months period, while disease-attributable referred to healthcare resource utilization and costs directly related to MF-CTCL. Any claim with an ICD-9-CM code for MF CTCL in any diagnosis field was categorized as disease-attributable. Costs were adjusted to 2014 US dollars using the medical component of the Consumer Price Index (Citation21).
Statistical analysis
Descriptive statistics were reported for demographic, clinical characteristics, index MF-CTCL-specific drug patterns and index MF-CTCL-specific nondrug utilization and all-cause healthcare resource utilization and costs. Dichotomous or categorical variables were presented as frequency and percentages; continuous variables were reported as means and standard deviations (SD). Comparison by severity was conducted using t-test for continuous variables and chi-square test for categorical variables. Logistic regression was used to evaluate the association between MF-CTCL severity and medication adherence, while controlling for age, gender, region, health plan, physician specialty and comorbidities. Generalized linear model (GLM) with log link function and gamma distribution was used to quantify the relationship between MF-CTCL severity and total all-cause and disease-related healthcare costs controlling for age, gender, region, health plan, physician specialty and comorbidities.
Results
Baseline demographics and clinical characteristics
A total of 1981 MF-CTCL patients who met the inclusion and exclusion criteria and were selected for analysis in this study. The severe group consisted of almost a quarter or 493 of the patients, while 1488 (75.1%) patients were classified as mild to moderate. Age was similar across both groups, (59.6 ± 15.2 vs. 58.0 ± 15.9 years, p = .18). The proportion of males in the severe group was greater than in the mild-to-moderate group (68.8 vs. 55.4%, p = .01). There was a statistically significant difference in treating physician specialty between these two groups, (p < .0001), with dermatologists as the most prominent providers. No statistically significant difference was observed in geographic distribution or health plan types, as shown in . On average, patients in the severe group had higher Deyo-Charlson Comorbidity Index (DCI) scores than those in the mild to moderate group (2.5 ± 2.2 vs. 1.6 ± 2.0, p < .0001). A greater proportion of patients in the severe group had depression (6.5% vs. 3.8%, p = .01), renal disease (7.1% vs. 3.0%, p < .0001) and thyroid disorder (13.8% vs. 10.2%, p = .03) than patients in the mild-to-moderate group. The severe group had higher percentages of patients with anemia (24.3% vs. 10.8%, p < .0001), lymphopenia (3.5% vs. 1.1%, p = .001), nausea and vomiting (16.8% vs. 10.0%, p < .0001), dyspnea (22.5% vs. 9.7%, p < .0001) and pneumonia (7.1% vs. 3.2%, p < .001) relative to the mild-to-moderate group.
Table 1. Baseline demographic and clinical characteristics.
Treatment patterns
Of the study population, 51.2% (1014) of patients did not receive any MF-CTCL-specific pharmacologic or nonpharmacologic treatment within 60 days after the index date. A total of 702 patients received pharmacologic treatment within 60 days after index date, including 334 (67.8%) in the severe group and 368 (24.7%) in the mild-to-moderate group. The mean MPR for all 702 patients who received an index MF-CTCL-specific drug was 19.8% (±23.4%). The average times to discontinuation, augmentation, restarting and switching of index MF-CTCL-specific drug were 52.7 days (±54.5), 70.5 days (±98.6), 201.1 days (±86.3) and 157.1 days (±94.2), respectively, as shown in . Patients in the severe group were more likely to discontinue their index drug treatment than patients in the mild to moderate group (60.2% vs. 23.7%, p < .0001). Among patients who discontinued therapy, those in the severe group were more likely to restart index MF-CTCL drug than the mild to moderate patients (14.0% vs. 6.0%, p < .0001). For patients who continued their therapy, those in the severe group were more likely to add other drugs than patients in the mild-to-moderate group (5.7% vs. 0.1%, p < .0001). A total of 265 patients received nonpharmacologic treatment within 60 days after the index date, including 26 (5.3%) patients in the severe group and 239 (16.1%) patients in the mild-to-moderate group. Among the medications used within the first 60 days of MF-CTCL diagnosis were topical corticosteroids (36.2% of the patients), systemic prednisone (24.6%), topical chemotherapy (2.8%), topical bexarotene (2.8%), systemic chemotherapy (2.7%) and systemic retinoids (2.0%).
Table 2. Index therapy treatment pattern in MF-CTCL cohorts.
Healthcare resource utilization
Healthcare resource utilization during the 12-month period postindex was greater among patients in the severe group relative to the mild-to-moderate patients: mean number of MF CTCL-related inpatient admissions (0.8 ± 1.6 vs. 0.2 ± 0.6, p < .0001), length of stay (7.3 ± 16.9 vs. 1.4 ± 8.3, p < .0001), ER visits (0.04 ± 0.2 vs. 0.02 ± 0.13, p = .0055), and disease-related pharmacy claims (7.0 ± 8.7 vs. 1.4 ± 3.0, p < .0001), respectively. Similarly, severe patients had a higher mean number of all-cause inpatient admissions (1.9 ± 3.0 vs. 0.5 ± 1.4, p < .0001), length of stay (14.6 ± 26.1 vs. 3.2 ± 12.4, p < .0001), ER visits (0.5 ± 1.0 vs. 0.2 ± 0.6, p < .0001), physician visits (26.6 ± 18.6 vs. 15.0 ± 13.9, p < .0001), other outpatient services (52.4 ± 39.0 vs. 29.2 ± 29.2, p < .0001) and pharmacy claims (55.1 ± 38.7 vs. 25.2 ± 28.0, p < .0001), relative to mild-to-moderate patients, as shown in .
Table 3. 12-month postindex all-cause and disease-related healthcare utilization in MF-CTCL cohorts.
Costs
Patients in the severe group had higher MF CTCL-related medical costs ($39,308 ± $107,259 vs. $8,678 ± $43,626, p < .0001), pharmacy costs ($4970 ± $19,993 vs. $343 ± $1,499, p < .0001), MF-CTCL related out of pocket costs ($1103 ± $2185 vs. $518 ± $1,239, p values <.0001) and total costs ($44,277 ± $108,962 vs. $9021 ± $43,618, p < .0001) during the postindex 12 months period, versus patients in the mild-to-moderate group. Patients in the severe group also had higher all-cause medical costs ($112,517 ± $189,724 vs. $25,686 ± $80,305, p < .0001), pharmacy costs ($12,036 ± $23,679 vs. $3217 ± $8005, p < .0001), all cause out of pocket costs ($4000 ± $3795 vs. $2058 ± $2372, p values < .0001) and total costs ($124,553 ± $192,479 vs. $28,903 ± $82,847, p < .0001) compared to patients in the mild-to-moderate group ().
Table 4. 12-month post-index all-cause and disease-related healthcare costsTable Footnotea in MF-CTCL cohorts.
Multivariable analysis
The logistic regression model found that patients in the severe group were more likely (OR = 24.9, 95% CI = 21.8–28.4) to adhere to their treatment than mild-to-moderate patients (p < .0001).
The generalized linear model estimate of MF CTCL-related and all-cause total costs found that patients in the severe group had more than three times (beta coefficient: 3.2; 95% CI: 2.5–7.0) higher all-cause total costs and more than five times (beta coefficient: 5.2; 95% CI: 4.4–8.9) higher MF CTCL-related total costs relative to mild-to-moderate patients (both p < .0001), while controlling for other factors.
Discussion
By all outcome measures in this study, patients with severe MF-CTCL used more healthcare resources of all types and incurred greater all-cause and MF-CTCL-related costs. While these findings appear directionally reasonable, to the best of our knowledge, this is the first study to examine treatment patterns, resource costs among MF-CTCL patients in the United States. In fact, only one small Italian study (N = 58), conducted in 1999, appeared to examine these questions, and its findings are unlikely to be generalizable to patients in the United States because the study was conducted more than 10 years ago, under a different healthcare system and did not include more recent treatment for MF-CTCL (Citation19).
Over half of the patients in this study population were not being treated, irrespective of whether the therapy was pharmacological or nonpharmacological. Among the patients who were treated within 60 days, the proportion in the severe group was two-thirds versus a quarter in the mild-to-moderate group. In general, severe MF-CTCL patients appeared more engaged with their treatment and were more likely to make adjustments and to restart index medicines relative to the patients with mild to moderate disease. They were also more likely to add other drug treatments.
The management of MF-CTCL incorporates different treatment strategies and menus depending on the desired outcomes (Citation22). While treatments are typically initiated with the objective of achieving remission, the more realistic approach with MF-CTCL appears to start treatment early and contain the progression to more advanced disease (Citation23). Treatment uncertainties, and the slow evolution of MF-CTCL may require re-evaluations of the diagnosis. Periods without treatment or monitoring (Citation22–24), along with low adherence rates in patients with mild-to-moderate disease suggest a greater need for clinician and payer input in patient management – with the goals of treating early and keeping clinical and cost burdens low (Citation24,Citation25).
In this study population, drawn from a large nationally representative managed care database (Citation20), one quarter of the study population had severe MF-CTCL versus three quarters with mild to moderate disease. This presents an opportunity to take steps to prevent progression among patients with mild-to-moderate disease to later stages, and stave off the devastating outcomes linked to MF-CTCL. To be sure, such preventative approaches are fraught with challenges. It is hard to determine which of the mild-to-moderate, early disease patients will progress to more severe forms because of the lack of definitive biomarkers and relevant data. Furthermore, despite the emergence of approved newer treatment formulations such as mechlorethamine, a topical, once a day alkylating drug to treat MF-CTCL (Citation26), bexarotene gel and topical bis-chloroethyl-nitrosourea (Citation24), the impact of these treatments are largely unknown at this time indicating a need for additional research.
Limitations
Interpretations of the results of this study must be approached with care as the identification of patients with MF-CTCL relied exclusively on administrative claims data. Disease severity was determined from systemic medication claims that are not clinically validated and cannot differentiate between different clinical disease stages. Due to the lack of severity measures in administrative data, this study used NCCN guideline-recommended treatments to group MF patients into relatively mild to moderate and severe categories, and this might have resulted in some misclassification of severe and mild-to-moderate groups. Reasons for discontinuing patients’ index medication are not available from administrative claims data. Refill dates of topical drugs are susceptible to variability due to the size of the area being treated and may result in imperfect calculation of MPR and discontinuation. The study population consisted of commercially insured patients in the United States, hence the generalizability of these results to patients on Medicare, who are uninsured, or reside outside the United States is unclear.
Conclusions
These findings suggest that the majority of study patients with MF-CTCL have a mild form of the disease as defined in this analysis. Nearly, half of the patients with MF-CTCL did not receive an NCCN guideline-recommended MF-CTCL treatment within 60 days of diagnosis. These results highlighted high unmet needs in the treatment of MF-CTCL. Future studies are needed to understand the reasons for the observed delay in MF-CTCL treatment initiation. As might be expected, patients with severe MF-CTCL had a greater burden of illness – healthcare costs and utilization – than those with mild to moderate disease. Low adherence and high discontinuation rates to drug therapy could be a reflection of disease remission after a few months of treatment, however, the reasons merit additional investigation in future studies.
Acknowledgements
B. Bernard Tulsi MSc, Senior Medical Writer at HealthCore, Inc., provided writing and other editorial support for this manuscript.
Disclosure statement
YT, GS, SR, and BD were employees and stock owners of Actelion, Inc. TG and HT were employees of HealthCore, Inc., which is a consultancy whose activities on the project were funded by various pharmaceutical companies.
Additional information
Funding
References
- Litvinov IV, Tetzlaff MT, Rahme E, et al. Demographic patterns of cutaneous T-cell lymphoma incidence in Texas based on two different cancer registries. Cancer Med. 2015;4:1440–1447.
- Scarisbrick JJ, Kim YH, Whittaker SJ, et al. Prognostic factors, prognostic indices and staging in mycosis fungoides and Sezary syndrome: where are we now? Br J Dermatol. 2014;170:1226–1236.
- Willemze R, Jaffe ES, Burg G, et al. WHO-EORTC classification for cutaneous lymphomas. Blood. 2005;105:3768–3785.
- Quaglino P, Pimpinelli N, Berti E, et al. Time course, clinical pathways, and long-term hazards risk trends of disease progression in patients with classic mycosis fungoides: a multicenter, retrospective follow-up study from the Italian group of cutaneous lymphomas. Cancer. 2012;118:5830–5839.
- Pope E, Weitzman S, Ngan B, et al. Mycosis fungoides in the pediatric population: report from an international childhood registry of cutaneous lymphoma. J Cutan Med Surg. 2010;14:1–6.
- Diamandidou E, Colome M, Fayad L, et al. Prognostic factor analysis in mycosis fungoides/Sézary syndrome. J Am Acad Dermatol. 1999;40:914–924.
- Diamandidou E, Colome-Grimmer M, Fayad L, et al. Transformation of mycosis fungoides/Sezary syndrome: clinical characteristics and prognosis. Blood. 1998;92:1150–1159.
- Criscione VD, Weinstock MA. Incidence of cutaneous T-cell lymphoma in the United States, 1973-2002. Arch Dermatol. 2007;143:854–859.
- Buzzell RA. Carcinogenesis of cutaneous malignancies. Dermatol Surg. 1996;22:209–215.
- Wilson LD, Hinds GA, Yu JB. Age, race, sex, stage, and incidence of cutaneous lymphoma. Clin Lymphoma Myeloma Leuk. 2012;12:291–296.
- Teras LR, DeSantis CE, Cerhan JR, et al. 2016 US lymphoid malignancy statistics by World Health Organization subtypes. CA Cancer J Clin. 2016;66:443–459.
- Trautinger F, Knobler R, Willemze R, et al. EORTC consensus recommendations for the treatment of mycosis fungoides/Sézary syndrome. Eur J Cancer. 2006;42:1014–1030.
- Whittaker SJ, Marsden JR, Spittle M, British Association of D, Group UKCL, et al. Joint British association of dermatologists and U.K. Cutaneous Lymphoma group guidelines for the management of primary cutaneous T-cell lymphomas. Br J Dermatol. 2003;149:1095–1107.
- Horwitz SM, Olsen EA, Duvic M, et al. Review of the treatment of mycosis fungoides and sezary syndrome: a stage-based approach. J Natl Compr Canc Netw. 2008;6:436–442.
- Duarte RF, Canals C, Onida F, et al. Allogeneic hematopoietic cell transplantation for patients with mycosis fungoides and Sezary syndrome: a retrospective analysis of the Lymphoma Working Party of the European Group for Blood and Marrow Transplantation. JCO. 2010;28:4492–4499.
- Prince HM. Are we close to a prognostic index for cutaneous T cell lymphoma? Leuk Lymphoma. 2014;55:7–8.
- Demierre MF, Gan S, Jones J, et al. Significant impact of cutaneous T-cell lymphoma on patients’ quality of life: results of a 2005 National Cutaneous Lymphoma Foundation Survey. Cancer. 2006;107:2504–2511.
- Demierre MF, Tien A, Miller D. Health-related quality-of-life assessment in patients with cutaneous T-cell lymphoma. Arch Dermatol. 2005;141:325–330.
- Ricci E, Cortelazzo S, Krulichova I, et al. Direct medical costs of mycosis fungoides in specialized Italian hospital departments. Haematologica. 2005;90:270–272.
- Wasser T, Wu B, Ycas J, et al. Applying weighting methodologies to a commercial database to project US census demographic data. Am J Account Care. 2015;3:33–38.
- United States Department of labor. Consumer Price Index. Available at: https://www.bls.gov/cpi/ [cited 13 Nov 2017].
- Poligone B, Heald P. Menus for managing patients with cutaneous T-cell lymphoma. Semin Cutan Med Surg. 2012;31:25–32.
- Zic JA. Controversies in the management of the cutaneous T cell lymphomas. Dermatol Ther. 2009;22:407–417.
- Latkowski JA, Heald P. Strategies for treating cutaneous T-cell lymphoma: part 1: remission. J Clin Aesthet Dermatol. 2009;2:22–27.
- Suchin KR, Cucchiara AJ, Gottleib SL, et al. Treatment of cutaneous T-cell lymphoma with combined immunomodulatory therapy: a 14-year experience at a single institution. Arch Dermatol. 2002;138:1054–1060.
- VALCHLOR Prescribing Information. Available at https://www.accessdata.fda.gov/drugsatfda_docs/label/2013/20231-7lbl.pdf [cited 16 Nov 2017].