
Abstract
Background
Reflectance confocal microscopy (RCM) enables noninvasive Demodex mite detection in rosacea. Objective scoring of rosacea severity is currently lacking.
Objectives
To determine the value of RCM for monitoring Demodex, inflammation and vascular parameters in rosacea during treatment.
Methods
In 20 rosacea patients, clinical and RCM examination were performed before, during, and 12 weeks after a 16-week treatment course with topical ivermectin. Using RCM, number of mites and inflammatory cells, epidermal thickness, and vascular density and diameter were measured. RCM features were correlated with clinical assessment.
Results
Treatment resulted in clinical reduction of inflammatory lesions. Mites were detected in 80% of patients at baseline, 30% at week 16, and 63% at week 28. The number of mites reduced significantly during treatment, but no changes in inflammatory cells, epidermal thickness or vascular parameters were observed. Correlation between number of inflammatory lesions and mites was low. None of the RCM variables were significant predictors for clinical success.
Conclusions
RCM enables anti-inflammatory effect monitoring of topical ivermectin by determining mite presence. Quantifying exact mite number, and inflammatory and vascular characteristics is challenging due to device limitations. In its current form, RCM seems of limited value for noninvasive follow-up of rosacea in clinical practice.
Introduction
Reflectance confocal microscopy (RCM) is a noninvasive imaging technique for in vivo visualization of the superficial skin layers with a resolution comparable to conventional histology (Citation1,Citation2). Unlike invasive tools such as skin biopsies, RCM enables temporal monitoring of the skin without causing irritation, damage or alteration. Historically, RCM has been mainly used for the diagnosis of (non-)melanoma skin cancer (Citation3–6), but it also has promising potential in the evaluation of inflammatory skin diseases (Citation7). Some knowledge has already been gained with the detection and quantification of Demodex mites in rosacea (Citation8–13).
Rosacea is a chronic inflammatory skin disorder of uncertain etiology, characterized by among others papules, pustules, erythema, telangiectasia, and flushing (Citation14–16). Demodex mites have been implicated in rosacea etiology (Citation14,Citation17–19), and studies show that the Demodex population is markedly increased in patients with rosacea compared to healthy controls (Citation20–25). With RCM, mites are visible as roundish or cone-shaped, bright structures inside hair follicles (Citation8,Citation9,Citation26,Citation27). Moreover, structural changes in Demodex mites have been observed after ivermectin treatment using RCM (Citation28). However, no RCM studies have yet assessed inflammatory and vascular parameters in rosacea (Citation29,Citation30).
Due to the variety in clinical features among individual rosacea patients and the presence of multiple subjective, often not validated, classification systems, there is a need for methods quantifying rosacea severity in an objective manner (Citation31–35). It is hypothesized that clinical effects of rosacea treatment can be quantified and ideally also be predicted using RCM monitoring. Topical ivermectin, an antiparasitic preparation that has dual anti-inflammatory and acaricidal effects, has been widely studied as a safe, easy to use, and effective treatment to reduce papules and pustules in rosacea (Citation36). This makes ivermectin a suitable intervention to monitor rosacea treatment effects.
The aim of this study was to determine the value of RCM to monitor Demodex mites, inflammation and vascular parameters in rosacea patients during treatment with topical ivermectin. To do so, RCM features were correlated to clinical scores, and possible prognostic features correlating to successful clinical response were determined.
Materials and methods
Patients
This study was approved by the ethics committee. Patients were recruited between January 2018 and April 2019 at the Department of Dermatology, Radboud University Medical Center, Nijmegen, The Netherlands. Eligible participants were ≥18 years old, and had a clinical diagnosis of moderate to severe facial rosacea (investigator’s global assessment [IGA] ≥ 3, >15 papules or pustules, and/or erythema scale ≥3 plus telangiectasia scale ≥2). Patients currently using ivermectin cream, having other facial dermatological conditions or underlying diseases requiring use of topical or systemic therapies interfering with rosacea diagnosis or assessment, or the inability to adhere to the washout period for these interfering therapies (Supplementary Table 1) were excluded. Participants were instructed to avoid known rosacea aggravating environmental factors and foods, and to abstain from sunbathing or using tanning beds throughout the study.
Clinical and RCM procedures
Written consent was obtained from all participants. After an acclimatization period of at least 15 min, facial clinical scores were assessed including IGA scale, IGA success scale (0 or 1), papules and pustules scale, erythema scale, telangiectasia scale, and inflammatory lesion count (Supplementary Table 2). Next, participants’ cheek with the highest clinical scores (left cheek: n = 13; right cheek: n = 7) was examined using RCM. The cheek was chosen because highest Demodex densities have been found here, and the RCM ring can be attached firmly on the relatively flat surface (Citation37,Citation38). After examination, participants were instructed to apply topical ivermectin 1% once daily in the evening for 16 consecutive weeks. Clinical and RCM examination were performed at five time points: week 0 (baseline), 6, 12, 16 (during treatment), and week 28 (follow-up). The same cheek was examined with RCM during consecutive visits. Therapy compliance was monitored using patient diaries and by weighing the used ivermectin tubes at week 6, 12, and 16. All examinations were performed in the same room by the same clinician (J. G. M. L.), and room temperature was kept constant between 19 and 24 °C.
RCM device and image analysis
RCM analysis was performed using a Vivascope 1500® confocal microscope (Mavig, Munich, Germany) (Citation39). Four surface-parallel horizontal areas of 8 × 8 mm2 were scanned with the Vivablock function at the level of the stratum corneum/granulosum, stratum spinosum, dermo-epidermal junction (DEJ), and the superficial dermis. Next, four vertical mappings (Vivastacks) of 0.5 × 0.5 mm2 were obtained, starting from the skin surface up to a depth of 150 µm with interval steps of 3 µm. Then, three movies of 0.5 × 0.5 mm2 of approximately 5 s each were made in the superficial dermis to visualize dermal blood flow. Analysis of RCM images was performed by one investigator (J. G. M. L.). Using all Vivablocks, Vivastacks and movies, the number of Demodex mites, inflammatory cells, degree of spongiosis, epidermal thickness, and vascular diameter and density were calculated.
Calculating Demodex mites
After selecting one 8 × 8 mm2 Vivablock at z = 20–80 µm (i.e. stratum granulosum/spinosum; mite quantification is best performed at this level (Citation8,Citation11)), mites were noted as present or absent. Then, the number of mites, hair follicles, infested follicles, and number of mites per individual follicle were counted; a separate category doubt was added if the follicle content was not well defined. Mean number of mites per follicle and mean number of mites per infested follicle were calculated.
Calculating inflammatory cells and spongiosis
The number of inflammatory cells, visible as round-to-polygonal bright cells (Citation40), was counted in one 8 × 8 mm2 Vivablock at the level of the DEJ. A group of >40 inflammatory cells was defined as one inflammatory nest. Dendritic cells were noted as present or absent.
To determine degree of spongiosis, three single images in a Vivablock with a clear honeycombed pattern from the stratum granulosum were selected. In these images, a number of keratinocytes in a square with known surface area without hair follicles were counted manually using ImageJ® freeware (Citation41), and extrapolated into number of keratinocytes/mm2. Lower values mean more intercellular edema, indicating increased spongiosis. The mean score of the three images was calculated.
Calculating epidermal thickness
Thickness of the stratum corneum (SC) and the viable epidermis, without SC, were determined (in µm) from the four Vivastacks with a standardized protocol as described in our earlier work (Citation39). The mean thickness of the SC and the viable epidermis of the four Vivastacks were calculated.
Scoring vascularity
Vascular diameter and density were determined separately from the three movies of the superficial dermis, and classified using a five-point scale: 1 (normal, i.e. similar to healthy facial skin), 2 (mildly increased), 3 (moderately increased), 4 (severely increased), and 5 (very severely increased). Example movies of each score can be found in Supplementary Table 3. The mean score of three movies for both parameters was calculated.
Statistical analysis
Descriptive statistics were used to explore baseline characteristics and categorical data. Differences in the same continuous variable between various time points were evaluated with Wilcoxon signed-rank tests for matched pairs. No correction for multiple comparisons was applied, because of the exploratory character of this study. Correlating clinical scores and RCM variables using measurements in the same patients at various time points can lead to biased estimates if the clustering within patients is ignored. Therefore, to get an overall estimate of correlation between number of inflammatory lesions and number of mites, a meta-analysis was constructed to aggregate the Spearman correlations (R) at the five consecutive time points. Additionally, possible interactions between RCM features and achieving IGA 0 or 1 (=clinical success) were measured in term of an odds ratio in the 95% confidence interval by using mixed model logistic regression analysis. Statistical analysis was performed using GraphPad Prism 5.03 (GraphPad Software, Inc., San Diego, CA) and R 3.6.0 (Foundation for Statistical Computing, Vienna, Austria). For all tests, p < .05 was considered statistically significant. Missing values were excluded from the analyses.
Results
Patient characteristics
Twenty-one patients were included in this study. One patient was excluded because of starting tetracycline during the study. Therefore, data from 20 participants were used for statistical analysis. In one patient, the week 28 visit was not performed due to the patients’ inability to travel to the hospital within the study visit window (2 weeks). The RCM data of the week 12 visit of one patient were unexpectedly not saved at the computer, and were therefore missing.
Demographic and baseline characteristics are displayed in . Most patients had IGA 3 (80%), erythema 3 (65%), and telangiectasia 2 or 3 (80%) scores. Median facial inflammatory lesion count at baseline was 36.5 (range 0–144). All patients applied ivermectin daily and according to prescription; mean daily quantity applied was 0.36 g.
Table 1. Demographic and baseline clinical characteristics.
Eleven patients reported one or more dermatologically related adverse event (AE); stinging/burning (n = 7), increased facial erythema (n = 4), itching (n = 3), and facial skin dryness (n = 1). All AEs occurred during the 16-week treatment period, and were mild and self-limiting.
Clinical assessment
presents the clinical scores at the five time points, and representative clinical pictures are shown in . Treatment resulted in clinical success (IGA 0 or 1) in 45% and 47% of patients at week 16 and at week 28, respectively. Median number of facial inflammatory lesions significantly decreased from baseline to week 12 (8.5, range 0–39; p < .001) and week 16 (2.0, range 0–44; p < .001), with no further changes at week 28 compared to week 16 (3.0, range 0.0–30; p = .19). Some improvement in erythema scores was noticed, while telangiectasias remained mainly unaffected.
Figure 1. Clinical scores of all patients during 16 weeks of treatment with topical ivermectin and at week 28 (follow-up). (a–e) IGA scale, IGA success scale (IGA 0 or 1), papules and pustules scale, erythema scale, and telangiectasia scale. (f) Number of facial inflammatory lesions, expressed as median with range. IGA: investigator’s global assessment.
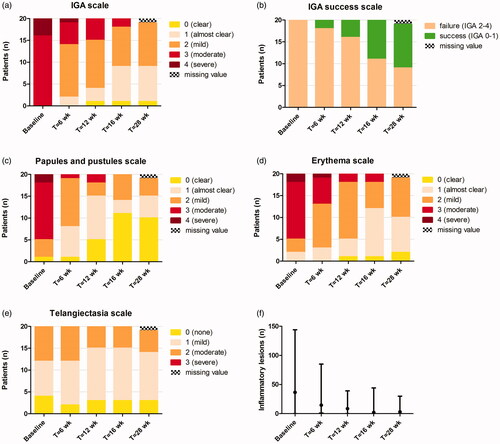
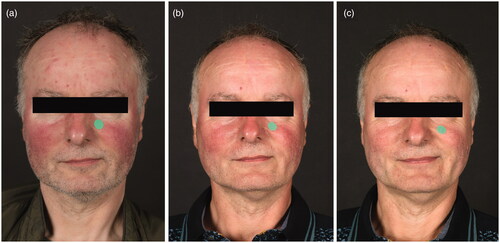
Figure 2. Rosacea in a 56-year old man, (a) at baseline, (b) at week 16 of treatment with topical ivermectin 1% once daily, and (c) 12 weeks post-treatment. Notice the disappearance of papules and pustules at the forehead and prominent erythema at the cheeks, while telangiectasias and residual erythema at both cheeks are persisting. The green dots serve as a tool to assess clinical erythema.
RCM assessment
Demodex mites
Mites were detected in 80% of participants at baseline, 30% at week 12 and 16, and 63% at week 28 ( and ). Median number of mites significantly decreased from baseline (13, range 0.0–203) to week 12 (0.0, range 0.0–10; p < .001) and week 16 (0.0, range 0.0–14; p < .001), and remained low at week 28 (1.0, range 0.0–21; p = .51 compared to week 16). Median number of follicles was comparable before, during, and after treatment. The median number of infested follicles and mites per follicle and mites per infested follicle were all significantly decreased after 16 weeks of treatment (p < .001, ), while only number of mites per infested follicle increased slightly at follow-up compared to week 16. Most follicles contained zero mites. The percentage of follicles with unclear content (doubt) was higher than follicles with clearly visible mites, which is visualized in .
Figure 3. Demodex mites during 16 weeks of treatment with topical ivermectin and at week 28 (follow-up), measured with RCM. (a) Mite presence per 8x8 mm2, expressed as present or absent. (b) Number of mites per 8 × 8 mm2, expressed as median with range.
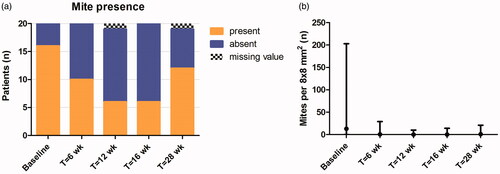
Figure 4. Confocal images of the cheek (0.5 × 0.5 mm2). (a) Follicle at the level of the stratum granulosum containing seven Demodex mites, clearly visible as bright, round contours. (b) Follicle at the level of the stratum granulosum with unclear content due to vague, white-roundish structures, included in mite category doubt. (c) Multiple bright, round to oval or fusiform cells with dendritic processes at the level of the dermo-epidermal junction, possibly melanocytes or Langerhans cells. (d) Multiple bright, round cells at the level of the dermo-epidermal junction, possibly inflammatory cells.
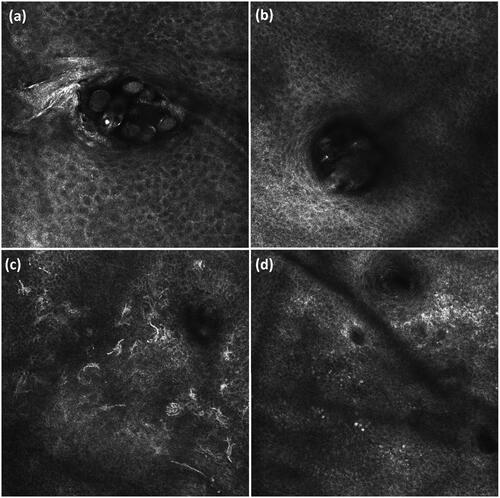
Table 2. Mite and follicle numbers per 8 × 8 mm2.
Inflammation, epidermal thickness and vascularity
Median number of inflammatory cells, inflammatory nests, and thickness of the SC and viable epidermis did not change significantly at week 16 or at follow-up compared to baseline (). Dendritic-like cells were seen before, during and after treatment in all patients (). Interestingly, median number of keratinocytes/mm2 slightly decreased from baseline to week 16 (p = .004) and week 28 (p = .031), implying an increase in spongiosis. As shown in , vascular diameter decreased only slightly after topical ivermectin application, while vascular density barely changed.
Figure 5. (a) Vascular diameter and (b) vascular density scores during 16 weeks of treatment with topical ivermectin and at week 28 (follow-up), determined with RCM.
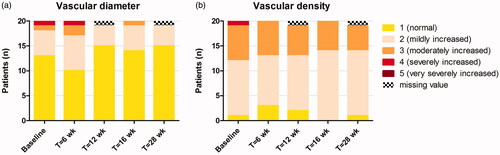
Table 3. Inflammatory parameters and epidermal thickness.
Correlating clinical scores with RCM parameters
As the correlation estimates in the meta-analysis were homogeneous over time, standard averaging with inversed variance weighting was used in this method. A low correlation existed between number of inflammatory lesions and number of mites (R = 0.28, 95% CI 0.08–0.48). Mixed model logistic regression revealed that none of the RCM variables were significant predictors for clinical success. Despite this, mite presence was the most promising parameter ().
Table 4. Mixed model logistic regression models determining RCM features associated with clinical success (IGA 0/1).
Discussion
This study confirmed the well-known efficacy of topical ivermectin to reduce inflammatory lesions in rosacea (Citation36). To the best of our knowledge, this is the first study combining a broad spectrum of RCM and clinical variables to monitor rosacea during treatment. Using RCM, we were able to monitor the anti-inflammatory effect of topical ivermectin by determination of Demodex mite presence, number of infested follicles and number of mites per follicle. However, quantifying exact mite number, inflammatory parameters and vascular characteristics was challenging due to various device limitations.
To guarantee adequate evaluation of rosacea severity, clinical assessment was performed using multiple scales, based on the newly developed phenotype-based classification system for rosacea (Citation31,Citation36,Citation42). Topical ivermectin treatment reduced the number of facial inflammatory lesions and erythema, with the greatest reduction at week 16. We found no changes in telangiectasias, corresponding to previous results (Citation36), supporting the hypothesis that telangiectasias are non-inflammatory features. A significant decrease in mite number was measured with RCM, with lowest counts after 12 weeks of treatment, preceding clinical outcomes; these findings suggest that topical ivermectin treatment should be continued for at least 12 weeks. Ivermectin blocks signal transduction in the neuromuscular system of Demodex mites, causing paralysis and death (Citation28,Citation43). Our results support the notion that a reduction of Demodex may be causative for the observed decrease in inflammation. Various mechanisms for immune system triggering by Demodex have been proposed, such as hair follicle blockage, foreign-body reactions, and secretion of bacteria and waste (Citation11,Citation44–46). On the other hand, Demodex was absent in 20% of rosacea patients at baseline while they responded well to ivermectin treatment, and correlation between number of inflammatory lesions and mites was low. This suggests that the pathogenesis of rosacea cannot be entirely explained by Demodex, and mites could be one of multiple factors inducing follicular inflammation.
Compared to earlier RCM studies calculating Demodex density in rosacea (Citation8,Citation9,Citation11–13,Citation47), we measured low mite numbers, while follicle amounts were very similar (Citation8,Citation11). These differences could be explained by the fact that we excluded follicles with unclear content from the mite count (). These follicles could contain sebum, sludge, hair shafts, or (disintegrating) mites (Citation28,Citation48). Additionally, counting exact mite number was challenging; mites’ contours were often vaguely debordered (Citation49,Citation50). Thirdly, despite the used washout periods (Supplementary Table 1), we cannot exclude an influence of previous rosacea treatments applied such as topical metronidazole; however, metronidazole does not directly kill Demodex mites (Citation11,Citation51). RCM has some other limitations for mite analysis. First, Demodex folliculorum is detectable, but not Demodex brevis which lives beneath the RCM maximum visualization depth, namely near the sebaceous glands (Citation45,Citation50). Second, mite distribution within the follicular canal varies, giving false-negative results when counting mites at only one level (Citation52). Lastly, RCM does not enable evaluation of mite viability or life stage (Citation23,Citation49,Citation53,Citation54).
In histological sections, the inflammatory infiltrate in rosacea can be observed in both superficial and deeper skin layers (Citation29,Citation30). In the current study, the DEJ was used as a representative level to score inflammation, because deeper layers impair detailed vision due to reduced image resolution and co-presence of bright collagen bundles (Citation2). No changes in inflammatory cell number at the DEJ were measured, which may be due to the difficulty of differentiating inflammatory cells from pigmented keratinocytes and melanocytes, which all are visible as polygonal, bright structures () (Citation2,Citation55). Furthermore, RCM cannot differentiate within leukocyte type (Citation29,Citation30).
Both vasodilation and increased vascular density are thought to be involved in the pathophysiology of facial erythema in rosacea (Citation56). We expected to measure a decrease in vasodilation in multiple participants, as this feature is most linked to inflammation, but we did not. Capillary diameter can be easily measured with RCM in vessels inside dermal papillae (Citation57–60), but as papillae are hardly visible in facial skin (Citation55), this method is not suitable in rosacea. Therefore, we tried quantifying vascular density and diameter using MATLAB by calculating differences in blood vessel movement between two consecutive movie frames. Unfortunately, these differences were not only caused by blood flux, but also by movement of the vessel surroundings, namely the patient and the RCM device. Consequently, we used Likert scales to grade vascular density and diameter, which are unfortunately still subjective.
Our study has several strengths. All examinations were performed in the same room by the same researcher, reducing light- and interobserver variability. Missing values were minimal due to high visit and therapy compliance. Both genders were equally represented, and age range was large, providing decent generalizability of our findings.
The advantage of RCM is its noninvasiveness without causing discomfort or damage, providing the ability to monitor the same facial location over time (Citation27). Limitations of our study are due to RCM limitations. Imaging of convex areas is challenging, impeding the generation of a perfectly horizontal Vivablock necessary for analysis in one skin level; image analysis takes time and requires an experienced investigator; RCM images are two-dimensional and in black-and-white only; and the apparatus is bulky, not wireless, and requires startup of approximately 10 min. Taking these factors into account, the RCM in its current form seems unsuitable for quick monitoring of rosacea patients in daily clinical practice. On the other hand, in research setting, RCM provides valuable additional information about mite presence that could otherwise not have been obtained in a noninvasive way.
In summary, we showed that RCM can be used for monitoring of Demodex presence in rosacea patients during successful anti-inflammatory treatment with topical ivermectin. Quantifying exact mite number and inflammatory and vascular parameters is challenging due to various device limitations. In its current form, RCM seems of limited value for noninvasive follow-up of rosacea treatment in daily clinical practice. However, as imaging techniques become more compact, intelligent (i.e. enabling automatic counting), and affordable, RCM’s future widespread application in research and possibly also clinical practice for rosacea monitoring can be expected.
| Abbreviations | ||
| AE | = | adverse event; |
| CI | = | confidence interval; |
| DEJ | = | dermo-epidermal junction; |
| IGA | = | investigator’s global assessment; |
| OR | = | odds ratio; |
| RCM | = | reflectance confocal microscopy; |
| SC | = | stratum corneum |
Supplemental Material
Download Zip (7.4 MB)Disclosure statement
J. G. M. L. has received a research grant from Galderma. She carried out clinical trials for Abbvie, Novartis, Janssen and LEO Pharma. She has received reimbursement for attending meetings from Abbvie. R. J. B. D. has received a research grant from Galderma. She carried out clinical trials for Cutanea Life Sciences, Galderma, Abbvie, Novartis and Janssen. She has received reimbursement for attending meetings from Abbvie and Galderma. She has served as a consultant for Abbvie, Galderma and Novartis. Fees were paid directly to the institution. M. P., P. E. J. E., E. M. G. J. J. and K. P. N. have no conflicts of interest to declare.
Additional information
Funding
References
- Calzavara-Pinton P, Longo C, Venturini M, et al. Reflectance confocal microscopy for in vivo skin imaging. Photochem Photobiol. 2008;84(6):1421–1430.
- Levine A, Markowitz O. Introduction to reflectance confocal microscopy and its use in clinical practice. JAAD Case Rep. 2018;4(10):1014–1023.
- Lupu M, Popa IM, Voiculescu VM, et al. A systematic review and meta-analysis of the accuracy of in vivo reflectance confocal microscopy for the diagnosis of primary basal cell carcinoma. J Clin Med. 2019;8(9):1462.
- Xiong YQ, Ma SJ, Mo Y, et al. Comparison of dermoscopy and reflectance confocal microscopy for the diagnosis of malignant skin tumours: a meta-analysis. J Cancer Res Clin Oncol. 2017;143(9):1627–1635.
- Ahlgrimm-Siess V, Laimer M, Rabinovitz HS, et al. Confocal microscopy in skin cancer. Curr Derm Rep. 2018;7(2):105–118.
- Edwards SJ, Osei-Assibey G, Patalay R, et al. Diagnostic accuracy of reflectance confocal microscopy using VivaScope for detecting and monitoring skin lesions: a systematic review. Clin Exp Dermatol. 2017;42(3):266–275.
- Hoogedoorn L, Peppelman M, van de Kerkhof PC, et al. The value of in vivo reflectance confocal microscopy in the diagnosis and monitoring of inflammatory and infectious skin diseases: a systematic review. Br J Dermatol. 2015;172(5):1222–1248.
- Sattler EC, Maier T, Hoffmann VS, et al. Noninvasive in vivo detection and quantification of Demodex mites by confocal laser scanning microscopy. Br J Dermatol. 2012;167(5):1042–1047.
- Turgut Erdemir A, Gurel MS, Koku Aksu AE, et al. Demodex mites in acne rosacea: reflectance confocal microscopic study. Australas J Dermatol. 2017;58(2):e26–e30.
- Harmelin Y, Delaunay P, Erfan N, et al. Interest of confocal laser scanning microscopy for the diagnosis and treatment monitoring of demodicosis. J Eur Acad Dermatol Venereol. 2014;28(2):255–257.
- Sattler EC, Hoffmann VS, Ruzicka T, et al. Reflectance confocal microscopy for monitoring the density of Demodex mites in patients with rosacea before and after treatment. Br J Dermatol. 2015;173(1):69–75.
- Turgut Erdemir A, Gurel MS, Koku Aksu AE, et al. Reflectance confocal microscopy vs. standardized skin surface biopsy for measuring the density of Demodex mites. Skin Res Technol. 2014;20(4):435–439.
- Logger JGM, Vries FMC, Erp PEJ, et al. Noninvasive objective skin measurement methods for rosacea assessment: a systematic review. Br J Dermatol. 2020;182(1):55–66.
- Two AM, Wu W, Gallo RL, et al. Rosacea: part I. Introduction, categorization, histology, pathogenesis, and risk factors. J Am Acad Dermatol. 2015;72(5):749–758. quiz 759–60.
- Gallo RL, Granstein RD, Kang S, et al. Standard classification and pathophysiology of rosacea: the 2017 update by the National Rosacea Society Expert Committee. J Am Acad Dermatol. 2018;78(1):148–155.
- Gether L, Overgaard LK, Egeberg A, et al. Incidence and prevalence of rosacea: a systematic review and meta-analysis. Br J Dermatol. 2018;179:239–240.
- Holmes AD, Steinhoff M. Integrative concepts of rosacea pathophysiology, clinical presentation and new therapeutics. Exp Dermatol. 2017;26(8):659–667.
- Woo YR, Lim JH, Cho DH, et al. Rosacea: molecular mechanisms and management of a chronic cutaneous inflammatory condition. Int J Mol Sci. 2016;17(9):E1562.
- Addor FA. Skin barrier in rosacea. An Bras Dermatol. 2016;91(1):59–63.
- Forton F, Seys B. Density of Demodex folliculorum in rosacea: a case-control study using standardized skin-surface biopsy. Br J Dermatol. 1993;128(6):650–659.
- Casas C, Paul C, Lahfa M, et al. Quantification of Demodex folliculorum by PCR in rosacea and its relationship to skin innate immune activation. Exp Dermatol. 2012;21(12):906–910.
- Zhao YE, Wu LP, Peng Y, et al. Retrospective analysis of the association between Demodex infestation and rosacea. Arch Dermatol. 2010;146(8):896–902.
- Forton F, Maertelaer V. Two consecutive standardized skin surface biopsies: an improved sampling method to evaluate Demodex density as a diagnostic tool for rosacea and Demodicosis. Acta Derm Venerol. 2017;97(2):242–248.
- Lacey N, Russell-Hallinan A, Zouboulis CC. Demodex mites modulate sebocyte immune reaction: possible role in the pathogenesis of rosacea. Br J Dermatol. 2018;179:420–430.
- Chang YS, Huang YC. Role of Demodex mite infestation in rosacea: a systematic review and meta-analysis. J Am Acad Dermatol. 2017;77(3):441–447.e6.
- Cinotti E, Perrot JL, Labeille B, et al. Reflectance confocal microscopy for cutaneous infections and infestations. J Eur Acad Dermatol Venereol. 2016;30(5):754–763.
- Longo C, Pellacani G, Ricci C, et al. In vivo detection of Demodex folliculorum by means of confocal microscopy. Br J Dermatol. 2012;166(3):690–692.
- Ruini C, Sattler E, Hartmann D, et al. Monitoring structural changes in Demodex mites under topical Ivermectin in rosacea by means of reflectance confocal microscopy: a case series. J Eur Acad Dermatol Venereol. 2017;31(6):e299–e301.
- Cribier B. Rosacea under the microscope: characteristic histological findings. J Eur Acad Dermatol Venereol. 2013;27(11):1336–1343.
- Lee WJ, Jung JM, Lee YJ, et al. Histopathological analysis of 226 patients with rosacea according to rosacea subtype and severity. Am J Dermatopathol. 2016;38(5):347–352.
- Tan J, Almeida LM, Bewley A, et al. Updating the diagnosis, classification and assessment of rosacea: recommendations from the global ROSacea COnsensus (ROSCO) panel. Br J Dermatol. 2017;176(2):431–438.
- Tan J, Steinhoff M, Berg M, et al.; the Rosacea International Study Group. Shortcomings in rosacea diagnosis and classification. Br J Dermatol. 2017;176(1):197–199.
- Hopkinson D, Moradi Tuchayi S, Alinia H, et al. Assessment of rosacea severity: a review of evaluation methods used in clinical trials. J Am Acad Dermatol. 2015;73(1):138–143.e4.
- Bamford JT, Gessert CE, Renier CM. Measurement of the severity of rosacea. J Am Acad Dermatol. 2004;51(5):697–703.
- Gessert CE, Bamford JT. Measuring the severity of rosacea: a review. Int J Dermatol. 2003;42(6):444–448.
- Zuuren EJ, Fedorowicz Z, Tan J, et al. Interventions for rosacea based on the phenotype approach: an updated systematic review including GRADE assessments. Br J Dermatol. 2019;181(1):65–79.
- Bonnar E, Eustace P, Powell FC. The Demodex mite population in rosacea. J Am Acad Dermatol. 1993;28(3):443–448.
- Erbagci Z, Ozgoztasi O. The significance of Demodex folliculorum density in rosacea. Int J Dermatol. 1998;37(6):421–425.
- Logger JGM, Olydam JI, Woliner-van der Weg W, et al. Noninvasive skin barrier assessment: multiparametric approach and pilot study. Cosmetics. 2019;6(1):20.
- Ilie MA, Caruntu C, Lixandru D, et al. In vivo confocal laser scanning microscopy imaging of skin inflammation: clinical applications and research directions. Exp Ther Med. 2019;17:1004–1011.
- Image J – Image Processing and Analysis in Java. Available at: https://imagej.nih.gov/ij/
- Schaller M, Almeida LMC, Bewley A, et al. Recommendations for rosacea diagnosis, classification and management: update from the global ROSacea COnsensus (ROSCO) 2019 panel. Br J Dermatol. 2019. [Epub ahead of print]
- Wolstenholme AJ, Rogers AT. Glutamate-gated chloride channels and the mode of action of the avermectin/milbemycin anthelmintics. Parasitology. 2005;131(S1):S85–S95.
- Forton F, De Maertelaer V. Erythematotelangiectatic rosacea may be associated with a subclinical stage of demodicosis: a case-control study. Br J Dermatol. 2019;181:818–825.
- Lacey N, Ni Raghallaigh S, Powell FC. Demodex mites – commensals, parasites or mutualistic organisms? Dermatology. 2011;222(2):128–130.
- Jarmuda S, O'Reilly N, Zaba R, et al. Potential role of Demodex mites and bacteria in the induction of rosacea. J Med Microbiol. 2012;61(Pt_11):1504–1510.
- Falay Gur T, Erdemir AV, Gurel MS, et al. The investigation of the relationships of demodex density with inflammatory response and oxidative stress in rosacea. Arch Dermatol Res. 2018;310(9):759–767.
- Veasey J, Framil V, Ribeiro A, et al. Reflectance confocal microscopy use in one case of Pityriasis folliculorum: a Demodex folliculorum analysis and comparison to other diagnostic methods. Int J Dermatol. 2014;53(4):e254–e257.
- Lacey N, Forton FM, Powell FC. Demodex quantification methods: limitations of confocal laser scanning microscopy. Br J Dermatol. 2013;169(1):212–213.
- Lacey N, Russell-Hallinan A, Powell FC. Study of Demodex mites: challenges and solutions. J Eur Acad Dermatol Venereol. 2016;30(5):764–775.
- Forton F, Seys B, Marchal JL, et al. Demodex folliculorum and topical treatment: acaricidal action evaluated by standardized skin surface biopsy. Br J Dermatol. 1998;138(3):461–466.
- Kligman AM, Christensen MS. Demodex folliculorum: requirements for understanding its role in human skin disease. J Invest Dermatol. 2011;131(1):8–10.
- Gatault S, Foley R, Shiels L, et al. Evaluation of Demodex mite viability using motility and scattered light intensity. Exp Appl Acarol. 2019;77(4):463–469.
- Huang HP, Hsu CK, Lee JY. A new superficial needle-scraping method for assessing Demodex density in papulopustular rosacea. J Cosmet Dermatol. 2019:1–5.
- Ardigo MAM. Reflectance confocal microscopy for skin diseases. In: Hoffmann-Wellenhof R, editor. Heidelberg: Springer; 2012.
- Steinhoff M, Schmelz M, Schauber J. Facial erythema of rosacea – aetiology, different pathophysiologies and treatment options. Acta Derm Venerol. 2016;96(5):579–586.
- Peppelman M, van den Eijnde WA, Jaspers EJ, et al. Combining tape stripping and non-invasive reflectance confocal microscopy: an in vivo model to study skin damage. Skin Res Technol. 2015;21(4):474–484.
- Batani A, Branisteanu DE, Ilie MA, et al. Assessment of dermal papillary and microvascular parameters in psoriasis vulgaris using in vivo reflectance confocal microscopy. Exp Ther Med. 2018;15(2):1241–1246.
- Wolberink EA, van Erp PE, de Boer-van Huizen RT, et al. Reflectance confocal microscopy: an effective tool for monitoring ultraviolet B phototherapy in psoriasis. Br J Dermatol. 2012;167(2):396–403.
- Wolberink EA, van Erp PE, Teussink MM, et al. Cellular features of psoriatic skin: imaging and quantification using in vivo reflectance confocal microscopy. Cytometry B Cytometry. 2011;80(3):141–149.