
 ?Mathematical formulae have been encoded as MathML and are displayed in this HTML version using MathJax in order to improve their display. Uncheck the box to turn MathJax off. This feature requires Javascript. Click on a formula to zoom.
Abstract
Introduction
For Hiroshima and Nagasaki survivors, it has not been possible to calculate individual doses from the cytogenetic data and compare them with the physically estimated doses. This is because the cytogenetic studies used solid Giemsa staining which only provides the percent of cells bearing at least one stable-type aberration (most of the unstable-type aberrations had already disappeared), and a gamma-ray dose plus a 10-times neutron dose was used to integrate the data for both cities.
Objectives
To compare the FISH-derived gamma-ray dose with the DS02R1-derived gamma-ray dose after correcting for a contribution of the neutron dose. It was also an attempt to determine if the frequency of stable-type aberrations had remained unchanged after the exposure.
Methods
Stable exchange-type aberration data was obtained using the 2-color FISH method from 1,868 atomic bomb survivors in Hiroshima and Nagasaki. The collected frequency was first extended to a genome-equivalent frequency. Then, by using known induction rates of exchange-type aberrations in vitro caused by neutrons and gamma-rays, respectively, and the mean relationship between the neutron and gamma-ray doses in the DS02R1 estimates for the survivors, the gamma-ray effect was estimated from the total yield of translocations.
Results
It was found that over 95% of individual cytogenetic gamma-ray doses fell within the expected range of plus/minus about 1 Gy from the DS02R1 dose and the mean slope for the linear regression was 0.98, which reassures us of the validity of the DS02R1 study.
Conclusions
The present results demonstrate the validity of the individual DS02R1 doses, and that the frequency of stable-type aberrations in blood lymphocytes did not decay over the years, and thus is useful for retrospective dose evaluations of exposures which took place in the distant past.
Introduction
Previous studies on chromosome aberration frequencies in blood lymphocytes from atomic bomb (A-bomb) survivors have shown that the individual frequencies varied, but that the mean frequency increased with an increase in the physically estimated dose in an upwardly curving manner up to 1 to 2 Gy, and then started to gradually level off (e.g. Kodama et al. Citation2001 who analyzed Giemsa data, and Sposto et al. Citation2023 who analyzed FISH data). Also, individual responses varied widely among survivors bearing similar physically estimated doses, and the mean responses differed among those who were exposed under different shielding conditions (Stram et al. Citation1993; Kodama et al. Citation2001; Sposto et al. Citation2023). However, since old RERF studies used the solid Giemsa staining method and the aberration frequency was expressed as the frequency of cells bearing at least one abnormality, it was not possible to calculate radiation doses from the observed aberration frequency because no in vitro studies to mimic the conditions is feasible. Subsequently, starting from the late 1980s, the FISH method was introduced and used to examine 1,868 survivors over the last 20 years. Since gamma-ray-induced FISH data for the induction of translocations in vitro has been reported (e.g. Lucas et al. Citation1995), it seemed possible to compare the cytogenetic dose and the physically estimated DS02R1 dose.
However, one problem still existed: how to deal with contributions from neutrons. The Hiroshima bomb was a Uranium-type bomb, and only a single one was ever produced, while the Nagasaki bomb was a Plutonium-type bomb which was a type manufactured often over the subsequent years. A Uranium-type bomb could produce more neutrons per unit dose of gamma rays (Young and Kerr Citation2005). In radiation epidemiology for A-bomb survivors, a weighted dose which consists of the gamma-ray dose (G dose) plus a 10-times neutron dose (N dose) has been used to integrate the data for Hiroshima and Nagasaki survivors.
In a recent study by Sposto et al. (Citation2023), the frequency of stable-type aberrations observed with FISH was plotted against the DS02R1 weighted bone marrow dose in order to integrate the data from both cities. In the present study, we wanted to show individual data graphically so that one may see how often the two estimated doses (cytogenetic vs. physical) agree or disagree. For this purpose, we took another approach to combine the data of both cities; namely, the use of a neutron-versus-gamma-ray dose relationship, and estimated the gamma-ray dose under the assumption that neutron damage and gamma-ray damage do not interact (Wolff et al. Citation1958; Furusawa et al. Citation2002; Wojcik et al. Citation2012).
Through the present analysis, we also wanted to know if the frequency of radiation-induced stable-type aberrations in blood lymphocytes persisted stably for more than 50 years after the exposure. In fact, our past small-scale data acquisition efforts for direct comparisons of gamma-ray doses estimated from tooth enamel (which practically does not decay) by means of the electron-spin-resonance (ESR) method and from lymphocyte translocation data with FISH from the same survivors indicated that there seems to be no trend in the decay of cytogenetic doses with time, and that the two sets of data closely agreed (Nakamura et al. Citation2017, Hirai et al. Citation2019). Finally, we also wanted to know if there is a difference in the gamma-ray dose response between Hiroshima and Nagasaki survivors which was not clearly seen in results which consisted of weighted doses on the X axis (Sposto et al. Citation2023).
Materials and methods
The study subjects consisted of 1,868 A-bomb survivors (1179 in Hiroshima and 689 in Nagasaki) and shows details for the subjects with regard to the city of residence, radiation dose, and shielding conditions (see also Sposto et al. Citation2023). Blood samples were collected from 1989 to 2014 and FISH examinations were conducted from 1989 to 2016. Estimation of individual doses which include air dose as well as different organ doses has been conducted for many years based on the interview records taken in the 1950s regarding the location of each survivor at the time of the bombings and shielding conditions using the DS02R1 dosimetry system which was developed in 2002 (Young and Kerr Citation2005; Cullings et al Citation2017).
Table 1. Number of survivors studied according to bone marrow dose and shielding categories.
This study consists of a part of the Adult Health Study (RP2-75) at the Radiation Effects Research Foundation and is based on RP8-93 which is approved by the IRB.
Estimations of cytogenetic gamma-ray doses used three sets of data; namely, an in vitro study with the FISH method for the yield of translocations by gamma rays, an in vitro study with the Giemsa staining method for the yield of dicentrics by neutron irradiation, and neutron-to-gamma-ray dose relationship in DS02R1. Specifically, following the FISH painting of chromosomes 1, 2, and 4 (Nakano et al. Citation2001), the frequency of stable-type aberrations which consisted of bicolored chromosomes was multiplied by sex-specific values (2.771 for males and 2.806 for females) to scale them against the full genome according to the equation by Lucas et al. (Citation1992). Identical translocations detected in the same blood samples (clonal translocations) were counted as single events.
For an estimation of the cytogenetic gamma-ray dose, a composite dose-response equation for the yield of exchange-type aberrations was created for Hiroshima and Nagasaki survivors separately: translocation yield = f1(G) + f2 (N) where G stands for the gamma-ray dose and N for the neutron dose, and the N dose is described as a function of the mean G dose.
Step 1: Describe the mean neutron dose from the gamma-ray dose
From , the mean DS02R1 neutron dose in bone marrow is expressed from the gamma-ray dose as
(1)
(1)
(2)
(2)
where D represent DS02R1 gamma-ray dose in bone marrow in mGy.
Figure 1. The relation of DS02R1 neutron dose against gamma-ray dose in bone marrow for 1179 survivors in Hiroshima (A) and 689 survivors in Nagasaki (B). The survivors studied in the present study are part of the survivors presented by Cordova and Cullings (Citation2019).
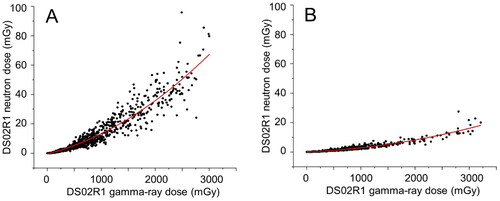
Step 2: Describe the neutron contribution from the gamma-ray dose
The induction rate for dicentrics plus rings by fission spectrum neutrons (Dobson et al. Citation1991, which used Hiroshima-type bomb replica) was expressed as y (%) = 0.118X where X is the neutron dose in mGy and y is the yield for dicentrics and rings. Because translocations and inversions are the counterpart of dicentrics and rings, respectively, and the FISH method does not detect inversions, and furthermore, the induction rate for rings is about 1/10 that of dicentrics (Bauchinger and Schmid Citation1997, Loucas and Cornforth Citation2001), the induction rate of dicentrics (and hence translocations) was estimated as y (%) = 0.1X, or an exposure to 1 mGy of the neutron would induce one translocation in 1,000 cells (0.1%) of the translocations since dicentrics and translocations are believed to be induced with equal frequencies. Therefore, the contribution of fast neutrons to the yield of translocations (in %) is expressed as 1/10 of the NH dose and NN dose in Equationeq. (1)(1)
(1) and Equation(2)
(2)
(2) , respectively. Thus, the contribution of neutrons to the translocation frequency (%) is expressed as
(3)
(3)
and
(4)
(4)
where D represents DS02R1 gamma-ray dose in bone marrow in mGy.
Step 3: Describe total translocation yield from the gamma-ray dose
On the other hand, the dose response relationship for the induction of translocations by 60Co gamma rays is described by Lucas et al. (Citation1995) as y (%) = 0.0023D + 5.3 × 10⁻⁶D2 (D in mGy) … Equation(5)(6)
(6) . Thus, the expected dose response which includes a neutron effect, but is expressed by the gamma-ray dose alone can then be described as the sum of the two Equationequations (3)
(3)
(3) + Equation(5)
(6)
(6) for Hiroshima survivors and Equation(4)
(4)
(4) + Equation(5)
(6)
(6) for Nagasaki survivors. Namely,
(6)
(6)
and
(7)
(7)
The two equations were used to calculate individual gamma-ray doses from the observed but genome-wide scaled translocation frequencies. Unfortunately, it is noted that the linear term is not very stable and varies considerable among different reports on the induction of dicentric chromosomes, an unstable counterpart of translocations, in vitro.
Individual data were not adjusted for the age at the time of drawing blood or at the time of the exposures because the mean frequency in the control subjects varied only from 2.2% at age 55 to 3.5% at age 85. Consequently, the background frequency was fixed as 2.8%. It was not possible to adjust for the age at exposure since there is no pertinent data to permit the adjustment.
Step 4: Estimation of normal ranges of variations in the FISH-derived doses
Estimated normal ranges of variations in the estimated cytogenetic data will be shown as shaded area which represents ±1,175 mGy deviations from the one-to-one relation. This was derived from our past study on 99 Hiroshima survivors who could provide both FISH-derived gamma-ray dose in blood lymphocytes and electron-spin-resonance (ESR)-derived gamma-ray dose in tooth enamel from the same survivors (Nakamura et al. Citation2017). In that study, the Bland-Altman plot of the data showed that 95% of the cases fell within a range of 1,138 to −1,212 mGy (mean: 1,175 mGy). It is noted that the variability was nearly constant throughout the dose range of zero to 4 Gy.
Results
Cytogenetic doses scattered widely
The individual gamma-ray doses obtained using Equationequations 6(6)
(6) and 7 are plotted against the DS02R1 gamma-ray dose in for Hiroshima survivors, and for Nagasaki survivors. Although there are a number of individual points above and below the shaded area, it is notable that 96% of Hiroshima survivors (1127 out of 1179) and 97% of Nagasaki survivors (670 out of 689) fell in the shaded zone. The number of outliers whose cytogenetic doses located above the shaded zone was 26 (2%) in Hiroshima and 6 (0.9%) in Nagasaki. The remaining 26 survivors (2%) in Hiroshima and 13 survivors (2%) in Nagasaki were located below the zone. The mean slope of the linear regression was 0.98 ± 0.012 for all the survivors, which clearly lends support to the validity of the DS02R1. When the survivors were separately analyzed by the city, the slope was 1.02 ± 0.02 for Hiroshima and 0.92 ± 0.02 for Nagasaki, which indicates a slightly lower overall response in Nagasaki by about 10% (thick solid lines in ).
Figure 2. Comparisons of cytogenetically derived gamma-ray dose against the DS02R1 gamma-ray dose. Shaded zone indicates ± 1,175 mGy deviation from the one-to-one relation which is expected to occur as a result of natural variation (see text). A and B) Individual data for Hiroshima and Nagasaki survivors, respectively. Thin solid lines indicate the expected one-to-one relationship (y = x), and thick lines indicate the results of linear regression analysis. C) grouped mean cytogenetic doses. Bars indicate SD’s for the mean.
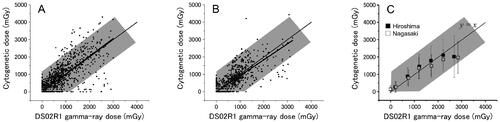
The mean cytogenetic doses which were grouped in every 500 mGy in the DS02R1 doses are shown in . As could be seen in individual plots of the data, the mean cytogenetic doses were slightly higher than that of DS02R1 doses in Hiroshima (dose range of 500 to 1500 mGy) and lower at doses above 2500 mGy while in Nagasaki the grouped means are close to that of DS02R1 below 1500 mGy but are somewhat lower at 1500 to 2500 mGy and definitely lower at doses above 2500 mGy. While the IAEA textbook indicates that FISH can be applied to exposures ranging from 0.25 to 4 Gy (IAEA Citation2011), the decline from linearity observed in the mean frequency of translocations above 2500 mGy is most likely due to preferential deaths of survivors whose true doses were larger than the estimated dose by the DS02R1 (Pierce et al. Citation1990).
Effect of sex
Next, to determine if the dose response might have been affected by the sex of the survivors, the cytogenetic doses were plotted separately by sex, but there were no notable differences between males and females in either city ().
Effect of age at exposure
Although it has not been established whether or not radiation sensitivity for the induction of chromosome aberrations in blood lymphocytes changes with age, it was of interest to see the data showing age at exposure, because in addition to the possible difference in cellular radiosensitivity, there could be a reporting bias depending on the age at the time of exposure (ATE). Specifically, survivors who were older than 15 years ATE could have reported detailed information on the location and shielding conditions when they were interviewed 10 years or more after the event, whereas those who were under 10 years of age ATE were likely to be incapable of fully reporting the information by themselves, and thus some proxy (e.g. senior family members) could have provided the information.
To test for the possible effect of age ATE, survivors were sorted into two groups of nearly equal sizes, 0 to 15 years old and 16 or older. The results showed that there was little difference in the cytogenetic dose response between the two age groups (). Overall, the results indicate that the quality of the information on the exposure conditions was not largely different if the proxies or the survivors themselves had provided the information.
Effects of shielding conditions
Overall, examination of the data describing different shielding conditions did not provide new information which was not previously known.
Survivors who were exposed in Japanese-style houses (9-parameter group)
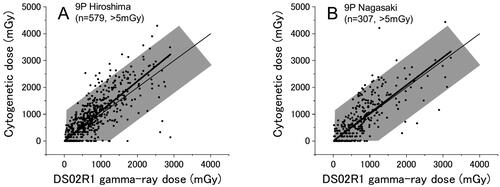
shows the results for survivors in Hiroshima and Nagasaki whose DS02R1 doses were calculated by the 9-parameter (9 P) method which could be applied only to those who were exposed in Japanese houses or tenements and provided detailed shielding information (their information is regarded as the most reliable among the survivors), and these survivors constitute about one half (49%) of all survivors (588/1179 and 320/689 survivors in Hiroshima and Nagasaki, respectively). Overall, the results may look similar to the results for all survivors (), but the slopes of the linear regressions were 1.11 ± 0.02 for Hiroshima and 1.03 ± 0.03 for Nagasaki, both of which are the highest among the coefficients obtained for different shielding groups in each city. These results provide us with an additional assurance that the 9 P method can provide the best estimates of the dose.
Figure 3. Cytogenetic dose vs DS02R1 dose for survivors who were exposed to the bomb in japanese style houses and whose doses were estimated with the 9 P method. A) Hiroshima, B) Nagasaki. Thin and thick lines indicate the expected (y = x) and the fitted lines, respectively.
Survivors who were exposed outside of houses but were shielded
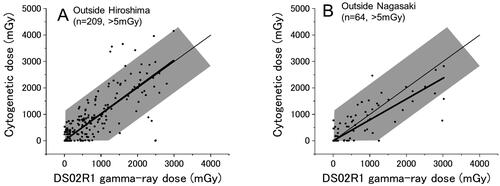
show the results for survivors in Hiroshima and Nagasaki, respectively, who were exposed outdoors, but with some shielding. They constitute 20% of the survivors examined in the present study, namely, 275 and 99 survivors (of whom 209 and 64 had DS02R1 estimates of > 5 mGy) in Hiroshima and Nagasaki, respectively. Among those survivors, about 95% of the points were in the shaded area in both Hiroshima and Nagasaki, and the slope of the linear regressions were 1.02 ± 0.04 for Hiroshima and 0.79 ± 0.05 for Nagasaki.
Figure 4. Survivors who were exposed outside of houses but with shielding in Hiroshima (A) and Nagasaki (B). Thin and thick lines indicate the expected (y = x) and the fitted lines, respectively.
Nagasaki factory workers
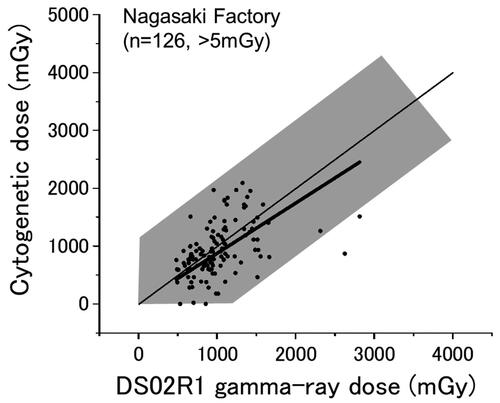
shows the results for factory workers in Nagasaki (126 survivors whose DS02R1 doses were larger than 5 mGy). They comprise 18% of the Nagasaki survivors (126/689). Although it was indicated in the past that the physically estimated doses of the Nagasaki factory workers tended to be overestimated when compared to the cytogenetic doses (Kodama et al. Citation2001), the present results do not clearly indicate the trend at doses below 2,000 mGy (the slope is 0.93 ± 0.03), while the overall slope of the linear regression was 0.87 ± 0.03 ( thick line).
Figure 5. Nagasaki survivors who were exposed in factories. Thin and thick lines indicate the expected (y = x) and the fitted lines, respectively.
Survivors who were exposed in other types of houses (i.e. in non-Japanese style houses)
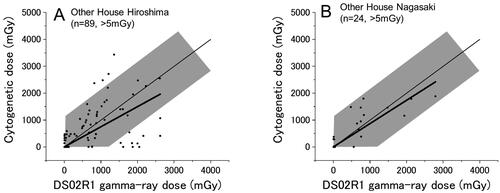
shows the results for survivors who were exposed to the bomb inside of a house, but detailed shielding information could not be obtained for calculation of physical dose with the 9 P method. There were 258 survivors in Hiroshima and 120 survivors in Nagasaki who belong to this group (20% of the total) but most of them (169 in Hiroshima and 96 in Nagasaki) were exposed distally and hence their DS02R1 doses are below 5 mGy. Only 89 and 24 survivors in Hiroshima and Nagasaki, respectively, had DS02R1 estimates larger than 5 mGy. In Hiroshima, the mean slope was 0.75 ± 0.07, and there were 4 survivors who showed cytogenetic doses above the shaded area, and notably there were 8 survivors whose cytogenetic doses were zero or nearly zero among the survivors who have DS02R1 estimates of 500 mGy or larger. In Nagasaki, although the number of survivors who belong to this shielding group is small (n = 24), all cytogenetic doses fell in the shaded zone.
Figure 6. Survivors who were exposed in non-Japanese style houses in Hiroshima (A) and Nagasaki (B). Thin and thick lines indicate the expected (y = x) and the fitted lines, respectively.
Survivors who were exposed without shielding (in the open)
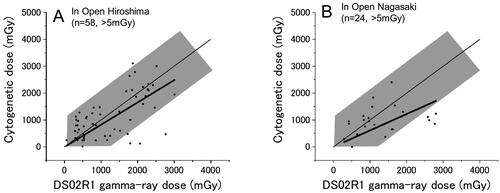
shows the results for Hiroshima and Nagasaki survivors, respectively, who were exposed to the bomb outdoors but without shielding (58 survivors in Hiroshima and 24 in Nagasaki). While it must have been difficult to reconstruct the exposure conditions of those survivors compared to survivors with other shielding conditions, the cytogenetically estimated doses did not seem widely scattered. The deficiency of survivors whose cytogenetic doses locate above the shaded area may well be a result of selective acute deaths from heat radiation which occurred among those who actually received larger doses than the estimated ones under the conditions of no shielding.
Figure 7. Survivors who were exposed in the open (i.e. with no shielding) in Hiroshima (A) and Nagasaki (B). Thin and thick lines indicate the expected (y = x) and the fitted lines, respectively.
Summary of the dose response slopes
summarizes the results for the slopes of linear regression analyses. While it is clear that the slopes may look different depending on the shielding conditions, the number of the survivors is small in some categories, and we should be aware that over 95% of the individual doses fell in the expected zone (shaded area).
Table 2. Slopes of the linear regressions by shielding categories (mean ± SE).
Dose response for severe epilation
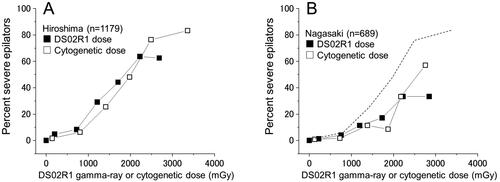
Since we have now obtained physical and biological individual dose estimates, it was of interest to compare the two dose systems for some biological endpoint. For this purpose, the frequency of severe epilators, which is defined as a loss of scalp hair by 2/3 or more, was chosen. As shown in , the dose response curve for the DS02R1 gamma-ray dose was slightly above the curve for the cytogenetic doses and levels off over 2000 mGy to reach the frequency of 60% while the curve for the cytogenetic dose kept increasing above 3000 mGy to reach over 80%. The difference indicates that DS02R1 doses were generally underestimated below 2000 mGy and overestimated above 2000 mGy, which led to a leveling off of the proportion of severe epilators at around 60%. In contrast, in Nagasaki, the two curves look in close agreement, but the frequency was distinctively lower, nearly one half of that in Hiroshima. The city difference indicates that there might have been some systematic difference between the two cities in training the interviewers who collected information on the shielding and health conditions of the survivors.
Figure 8. Comparison of the fraction of severe epilators in relation to the DS02R1 gamma-ray (■) or cytogenetically estimated gamma-ray dose (□) for Hiroshima survivors (A) and Nagasaki survivors (B). The dotted line indicates the response of Hiroshima survivors using the cytogenetic dose.
Discussion
Comparison with a previous study
The present FISH data was also analyzed by Sposto et al. (Citation2023). In that study, individual frequencies of translocations (which include both gamma-ray and neutron effects) were plotted against the DS02R1 weighted dose (i.e. gamma-ray dose plus 10-times neutron dose). In contrast, in the present report, the observed translocation frequencies were converted into gamma-ray doses so that direct comparisons could be made between the cytogenetic versus the DS02R1 doses. The latter approach could make it possible to visually see the extent of individual variations associated with the cytogenetic outcome. Furthermore, while no major differences were found in the outcomes between the Sposto paper and the present study, the present study clearly demonstrated that the frequency of stable-type aberrations did not decay and remained constant because the mean estimated gamma-ray dose from the translocation frequency agreed closely to the physically estimated dose by the DS02R1 () and also to the estimated dose by means of electron paramagnetic resonance using tooth enamel from the same survivors (Nakamura et al. Citation2017). Thus, the frequency of translocations is a valid quantitative indicator of radiation exposures in the distant past.
The large scatter is not a biological property
It has been known since the 1960s that the frequency of chromosome aberrations observed among the survivors scatter widely when plotted against the physically estimated doses. This was partly due to insufficient knowledge of the physical characteristics of the radiation released from the bombs as the dosimetry system evolved from T65DR (1965) to DS86 (1986), to DS02 (2002), and most recently to DS02R1. The scatter was also considered partly due to possible individual differences in radiation sensitivity because it was a common thought in the 1970s and 80s that individual radiosensitivity differed based upon in vitro dose-survival experiments using mainly skin fibroblasts (e.g. Little et al. Citation1988). However, this notion was challenged in the late 1980s by using blood lymphocytes, and the dose-survival data showed that individual responses are quite similar among individuals, and that apparent inter-individual variations did not exceed that of repeated tests of a single person (Nakamura et al. Citation1991, Citation1993). Therefore, the present scattered data are unlikely to reflect individual differences in radiation sensitivity.
In this regard, Sposto et al. (Citation1991) examined solid Giemsa data in relation to DS86 doses and compared dose-response slopes between survivors who reported severe epilation versus those who did not. The slope of the former was larger than that of the latter by about 2-fold, which indicated that a 45 to 50% random error in the assigned doses may explain the differences, given that there were likely no individual differences in radiation sensitivity. The difference in the slopes between severe epilators and others became much smaller in the present study; namely, 1.3 times difference in Hiroshima (the slopes were 1.18 for severe epilators and 0.89 for the rest), and 1.2 times in Nagasaki (1.08 and 0.88, respectively (). The trend of larger slopes among the severe epilators is likely to be a natural consequence of large variations in true doses at a given DS02R1 dose, especially at above 1,000 mGy. This is because high dose survivors are likely to include those who have received substantially larger true doses than the assigned dose () and thus their probability of undergoing severe epilation and their translocation frequency would become higher than that of the survivors who did not experience severe epilation.
The majority of cytogenetically estimated individual doses agree with the expected range
The present results provide information which for the first time lends support to the individual doses estimated by DS02R1. Although we see that the cytogenetically derived individual doses scatter widely when plotted against the DS02R1 doses (), it is important to note that about 95% of the individual points fell in the range expected from our past experience (shaded zone in the figures). The validity for the use of translocation frequencies several decades after the exposure to radiation was previously supported by our studies in which the translocation frequency in blood lymphocytes and the ESR-estimated dose in tooth enamel (which essentially does not decay) from the same survivors were measured, and the results showed a clear one-to-one correlation between the two gamma-ray estimates with about ± 1,000 mGy variation in 95% of the cases irrespective of the dose level (Nakamura et al. Citation2017, Hirai et al. Citation2019).
Possible reasons for the survivors whose cytogenetic doses differed largely from DS02R1 doses
While over 95% of the cytogenetically estimated doses of the survivors fell in the shaded zone, the remaining few percent of the cases were either below or above the expected range (). With regard to the lower-than-expected outliers, clonal expansion of lymphocytes could have contributed at least partly to it. Namely, it has been known that blood lymphocytes often undergo clonal expansions during the recovery process from radiation injury, which was revealed by the presence of multiple lymphocytes bearing identical chromosome alterations (Nakamura et al. Citation2004; Nakano et al. Citation2004; Kodama et al. Citation2005). This means that clonal expansions should occur, not only among aberrant cells, but also among non-aberrant cells, and such clonal cells are not distinguishable from other non-clonal derivatives and inevitably counted as independently derived, thereby leading to an inflated increase in the denominator in the calculation of translocation frequencies and thus lower the frequency. In one extreme case, nearly 50% of the blood lymphocytes were found to contain identical translocations (Nakano et al., Citation2004).
In contrast, survivors who showed higher-than-expected cytogenetic doses are more difficult to explain. Obviously, clonal translocations do not contribute to the results here because they are counted as single events. One possible mechanism for the generation could be due to radiation-induced genetic instability, i.e. cells that were exposed to high doses of radiation could become genetically unstable and generate aberrant progeny with increased frequencies (e.g. Kadhim et al. Citation1995). However, our past studies on A-bomb survivors which measured the frequency of additional chromosome aberrations which occurred in vivo among the clonal cells bearing identical marker translocations did not support this notion (Kodama et al. Citation2005, Hamasaki et al. Citation2009). Another possibility is that there might have been exposures to residual radiation which was caused by neutron activation of elements in the ground or in buildings. However, its probability is low because the currently estimated doses from residual radiation are not large enough to explain the observations (see below).
By taking into account these possibilities, it seems most likely that the apparent outliers were caused by incorrect information describing the exposure conditions which were reported by the survivors either deliberately or inadvertently, or by the interviewers. Possible reasons for underreporting the exposures might have come from a desire to hide their exposures in order to avoid discriminatory actions that the survivors had experienced in having a job or getting married during the early postwar era prior to the interviews which took place primarily 10 years or more after the events. In contrast, it seems that there were rumors that the Government might provide compensation money, which could have motivated some low-dose survivors to overstate their exposure conditions and led to the current survivors bearing unusually low cytogenetic doses compared to the physical DS02R1 doses.
In the present study, the bone marrow dose was used since blood lymphocytes are the target cells. However, long-lived lymphocytes or stem/progenitor cells may reside in places other than in the bone marrow, such as in the spleen and Peyer’s patch. Importantly, the absorbed doses of internal organs such as the colon are generally lower than the bone marrow dose by roughly 10%. Therefore, the use of other organ doses would act toward producing a decrease in the DS02R1 dose, which leads to increase in the number of survivors who have larger-than-expected cytogenetic doses, and therefore would not solve the problem.
Exposure to residual radiation and survivors bearing unusually high cytogenetic doses
One might raise the possibility that survivors bearing excessively large cytogenetic doses is a result of additional exposures to residual gamma radiation triggered by neutron activation in the soil or in buildings. However, the residual radiation dose released from the neutron-activated ground or buildings does not seem large enough to give rise to such cases. Specifically, at a ground distance of 1 km from the hypocenter in Hiroshima, for example, where the estimated gamma-ray air kerma is 4.2 Gy and thus the shielded kerma would be around 2 Gy if exposed in an ordinary Japanese house (Young and Kerr Citation2005), the initial dose rate generated by the residual radiation is reported as 20 mGy/h but it decreased rapidly to 0.15 mGy/h in one hour, and the estimated cumulative dose is about 4 mGy (Okajima et al. Citation1987, Gritzner and Woolson Citation1987). Thus, if a person was trapped under a demolished house after the blast and had to remain there for, say, five hours before escaping, the cumulative dose would still be far less than 100 mGy. Another possibility is that during their escape from the central area of the city, some survivors could have passed by near the hypocenter, e.g. say 500 m from the hypocenter. In such a case, the initial dose rate shortly after the bombing could be as high as 1000 mGy/h, but this decreased rapidly to 7.5 mGy/h in one hour (Okajima et al. Citation1987, Gritzner and Woolson Citation1987), and hence spending one hour in that area could have caused an exposure to ∼200 mGy in theory. However, it is believed that the central area of the city was experiencing a major fire, and thus it would have been difficult to enter and stay near the central part of the city soon after the explosion.
Effects of cytogenetic dose response on neutron RBE
Another issue which relates to the city differences in the cytogenetic dose response is the estimation of the neutron RBE value. As mentioned in the Introduction, the Hiroshima bomb yielded more neutrons than the Nagasaki bomb per unit dose of gamma rays. This neutron difference had led some researchers to make efforts to estimate a neutron RBE for radiation carcinogenesis. Although ICRP suggests energy-dependent neutron RBE values of 2.5 to 20 (ICRP Citation2007), some larger estimates are also reported (Cordova and Cullings Citation2019, Hafner et al. Citation2023). However, it should be kept in mind that the ratio of the neutron dose to the gamma-ray dose is small, and therefore estimating a neutron RBE is inevitably associated with a large uncertainty. Moreover, for any such analyses to be valid, it is important that the estimated individual doses are of good quality, but the present data do not seem to support this assumption (e.g. the mean slope in the cytogenetic dose response is about 10% higher in Hiroshima than in Nagasaki: ). Thus, the observation that the cancer risk in Nagasaki survivors was lower than that in the Hiroshima survivors by 12% (Grant et al. Citation2017) may be irrelevant to any neutron effect, but simply due to the lower true doses in the Nagasaki survivors.
Difficulties in retrospective dosimetry
When FISH tests are to be conducted, the study subjects are usually those who had experienced radiation exposures long ago because in the case of recent exposures, ordinary solid Giemsa staining would be enough to detect dicentric chromosomes. The most serious problem that we can face when FISH tests are to be conducted many years after the exposure is a substantial increase in the background frequency of translocations as people age. For example, chronic exposures to 1 Gy increase the frequency of translocations only by 1% whereas control people with advanced ages over 60 or 70 may typically have a frequency of a few percent (Burak et al. Citation2001).
FigureS3.docx
Download MS Word (451.5 KB)FigureS1.docx
Download MS Word (873.9 KB)FigureS2.docx
Download MS Word (640.6 KB)Acknowledgements
The authors are indebted to Dr. Akio Awa and Dr. Masahiro Itoh for their long-standing contribution to this work, and thank Dr. Leon Kapp for his careful reading of the manuscript, M. Miura, K. Muramoto, T. Matsumoto and H. Ryukaku for their technical assistance. The Radiation Effects Research Foundation (Hiroshima and Nagasaki, Japan) is a public interest foundation funded by the Japanese Ministry of Health, Labor and Welfare and the US Department of Energy. This publication was supported by RERF Research Protocol RP8-93. The views of the authors do not necessarily reflect those of the two governments.
Disclosure statement
No potential conflict of interest was reported by the author(s).
Additional information
Funding
Notes on contributors
Y. Kodama
Yoshiaki Kodama, PhD, Cytogeneticist, Consultant, Department of Molecular Biosciences, Radiation Effects Research Foundation (RERF), Hiroshima, Japan
N. Nakamura
Nori Nakamura, PhD, Radiation Research Scientist, Consultant, Department of Molecular Biosciences, Radiation Effects Research Foundation (RERF), Hiroshima, Japan
M. Nakano
Mimako Nakano, PhD, Cytogeneticist, Research Scientist, Department of Molecular Biosciences, Radiation Effects Research Foundation (RERF), Hiroshima, Japan
K. Ohtaki
Kazuo Ohtaki, PhD, Cytogeneticist, Research Scientist, Department of Molecular Biosciences, Radiation Effects Research Foundation (RERF), Hiroshima, Japan
K. Hamasaki
Kanya Hamasaki, PhD, Cytogeneticist, Associate Senior Scientist, Department of Molecular Biosciences, Radiation Effects Research Foundation (RERF), Hiroshima, Japan
A. Noda
Asao Noda, PhD, Radiation Research Scientist, Department Chief, Department of Molecular Biosciences, Radiation Effects Research Foundation (RERF), Hiroshima, Japan
References
- Bauchinger M, Schmid E. 1997. Commentary: Is there reliable experimental evidence for a chromosomal “fingerprint” of exposure to densely ionizing radiation? Radiat Res. 147(4):506–510.
- Burak LE, Kodama Y, Nakano M, Ohtaki K, Itoh M, Okladnikova ND, Vasilenko EK, Cologne JB, Nakamura N. 2001. FISH examination of lymphocytes from Mayak workers for assessment of translocation induction rate under chronic radiation exposures. Int J Radiat Biol. 77(8):901–908. doi:10.1080/09553000110063386
- Cordova KA, Cullings HM. 2019. Assessing the relative biological effectiveness of neutrons across organs of varying depth among the atomic bomb survivors. Radiat Res. 192(4):380–387. doi:10.1667/RR15391.1
- Cullings HM, Grant EJ, Egbert SD, Watanabe T, Oda T, Nakamura F, Yamashita T, Fuchi H, Funamoto S, Marumo K, et al. 2017. DS02R1: improvements to atomic bomb survivors’ input data and implementation of dosimetry system 2002 (DS02) and resulting changes in estimated doses. Health Phys. 112(1):56–97. doi:10.1097/HP.0000000000000598
- Dobson RL, Straume T, Carrano AV, Minkler JL, Deaven LL, Littlefield LG, Awa AA. 1991. Biological effectiveness of neutrons from Hiroshima bomb replica: results of a collaborative cytogenetic study. Radiat Res. 128(2):143–149. doi:10.2307/3578131
- Furusawa Y, Aoki M, Durante M. 2002. Simultaneous exposure of mammalian cells to heavy ions and X-rays. Adv Space Res. 30(4):877–884. doi:10.1016/s0273-1177(02)00409-x
- Grant EJ, Brenner A, Sugiyama H, Sakata R, Sadakane A, Utada M, Cahoon EK, Milder CM, Soda M, Cullings HM, et al. 2017. Solid Cancer Incidence among the Life Span Study of Atomic Bomb Survivors: 1958-2009. Radiat Res. 187(5):513–537. doi:10.1667/RR14492.1
- Gritzner MI, Woolson WA. 1987. Calculation of doses due to atomic bomb induced soil activation. In US-Japan joint reassessment of atomic bomb radiation dosimetry in hiroshima and nagasaki, final report, Vol. 2, Radiation Effects Research Foundation, Hiroshima, p. 342–351.
- Hafner L, Walsh L, Rühm W. 2023. Assessing the impact of different neutron RBEs on the all solid cancer radiation risks obtained from the Japanese A-bomb survivors data. Int J Radiat Biol. 99(4):629–643. doi:10.1080/09553002.2022.2117871
- Hamasaki K, Kusunoki Y, Nakashima E, Takahashi N, Nakachi K, Nakamura N, Kodama Y. 2009. Clonally expanded T lymphocytes from atomic bomb survivors in vitro show no evidence of cytogenetic instability. Radiat Res. 172(2):234–243. doi:10.1667/RR1705.1
- Hirai Y, Cordova KA, Kodama Y, Hamasaki K, Awa AA, Tomonaga M, Mine M, Cullings HM, Nakamura N. 2019. Tooth enamel ESR doses and cytogenetic doses of Nagasaki atomic-bomb survivors in comparison with DS02R1 doses. Int J Radiat Biol. 95(3):321–328. doi:10.1080/09553002.2019.1552807
- IAEA. 2011. Cytogenetic dosimetry: Applications in preparedness for and response to radiation emergencies, emergency preparedness and response. Vienna: IAEA.
- ICRP. 2007. The 2007 recommendations of the International Commission on Radiological Protection. ICRP publication 103. An ICRP 2007. 37:1–332.
- Kadhim MA, Lorimore SA, Townsend KM, Goodhead DT, Buckle VJ, Wright EG. 1995. Radiation-induced genomic instability: delayed cytogenetic aberrations and apoptosis in primary human bone marrow cells. Int J Radiat Biol. 67(3):287–293. doi:10.1080/09553009514550341
- Kodama Y, Pawel D, Nakamura N, Preston D, Honda T, Itoh M, Nakano M, Ohtaki K, Funamoto S, Awa AA. 2001. Stable chromosome aberrations in atomic bomb survivors: results from 25 years of investigation. Radiat Res. 156(4):337–346. doi:10.1667/0033-7587(2001)156[0337:scaiab
- Kodama Y, Ohtaki K, Nakano M, Hamasaki K, Awa AA, Lagarde F, Nakamura N. 2005. Clonally expanded T-cell populations in atomic bomb survivors do not show excess levels of chromosome instability. Radiat Res. 164(5):618–626. doi:10.1667/rr3455.1
- Little JB, Nove J, Strong LC, Nichols WW. 1988. Survival of human diploid skin fibroblasts from normal individuals after X-irradiation. Int J Radiat Biol. 54(6):899–910. doi:10.1080/09553008814552311
- Loucas BD, Cornforth MN. 2001. Complex chromosome exchanges induced by gamma rays in human lymphocytes: an mFISH study. Radiat Res. 155(5):660–671. doi:10.1667/0033-7587(2001)155[0660:cceibg
- Lucas JN, Awa AA, Straume T, Poggensee M, Kodama Y, Nakano M, Ohtaki K, Weier H-U, Pinkel D, Gray J. 1992. Rapid translocation frequency analysis in humans decades after exposure to ionizing radiation. Int J Radiat Biol. 62(1):53–63. doi:10.1080/09553009214551821
- Lucas JN, Hill F, Burk C, Fester T, Straume T. 1995. Dose-response curve for chromosome translocations measured in human lymphocytes exposed to 60Co gamma rays. Health Phys. 68(6):761–765. doi:10.1097/00004032-199506000-00001
- Nakamura N, Sposto R, Kushiro J, Akiyama M. 1991. Is interindividual variation of cellular radiosensitivity real or artifactual? Radiat Res. 125(3):326–330.
- Nakamura N, Sposto R, Akiyama M. 1993. Dose survival of G0 lymphocytes irradiated in vitro: a test for a possible population bias in the cohort of atomic bomb survivors exposed to high doses. Radiat Res. 134(3):316–322. doi:10.2307/3578191
- Nakamura N, Nakano M, Kodama Y, Ohtaki K, Cologne J, Awa AA. 2004. Prediction of clonal chromosome aberration frequency in human blood lymphocytes. Radiat Res. 161(3):282–289. doi:10.1667/rr3134
- Nakamura N, Hirai Y, Kodama Y, Hamasaki K, Cullings HM, Cordova KA, Awa A. 2017. Cytogenetic reconstruction of gamma-ray doses delivered to atomic bomb survivors: Dealing with wide distributions of photon energies and contributions from hematopoietic stem/progenitor cells. Radiat Res. 188(4):412–418. doi:10.1667/RR14832.1
- Nakano M, Kodama Y, Ohtaki K, Itoh M, Delongchamp R, Awa AA, Nakamura N. 2001. Detection of stable chromosome aberrations by FISH in A-bomb survivors: comparison with previous solid Giemsa staining data on the same 230 individuals. Int J Radiat Biol. 77(9):971–977. doi:10.1080/09553000110050065
- Nakano M, Kodama Y, Ohtaki K, Itoh M, Awa AA, Cologne J, Kusunoki Y, Nakamura N. 2004. Estimating the number of hematopoietic or lymphoid stem cells giving rise to clonal chromosome aberrations in blood T lymphocytes. Radiat Res. 161(3):273–281. doi:10.1667/rr3133
- Okajima S, Fujita S, Harley H. 1987. Radiation doses from residual radioactivity. In US-Japan Joint Reassessment of Atomic Bomb Radiation Dosimetry in Hiroshima and Nagasaki, Final Report, Vol. 1, Radiation Effects Research Foundation, Hiroshima, p. 205–226.
- Pierce DA, Stram DO, Vaeth M. 1990. Allowing for random errors in radiation dose estimates for the atomic bomb survivor data. Radiat Res. 123(3):275–284. doi:10.2307/3577733
- Stram DO, Sposto R, Preston D, Abrahamson S, Honda T, Awa AA. 1993. Stable chromosome aberrations among A-bomb survivors: an update. Radiat Res. 136(1):29–36. doi:10.2307/3578636
- Sposto R, Stram DO, Awa AA. 1991. An estimate of the magnitude of random errors in the DS86 dosimetry from data on chromosome aberrations and severe epilation. Radiat Res. 128(2):157–169. doi:10.2307/3578133
- Sposto R, Cordova KA, Hamasaki K, Nakamura N, Noda A, Kodama Y. 2023. The association of radiation exposure with stable chromosome aberrations in atomic bomb survivors based on DS02R1 Dosimetry and FISH methods. Radiat Res. 199(2):170–181. doi:10.1667/RADE-22-00154.1
- Wojcik A, Obe G, Lisowska H, Czub J, Nievaart V, Moss R, Huiskamp R, Sauerwein W. 2012. Chromosomal aberrations in peripheral blood lymphocytes exposed to a mixed beam of low energy neutrons and gamma radiation. J Radiol Prot. 32(3):261–275. doi:10.1088/0952-4746/32/3/261
- Wolff S, Atwood KC, Randolph ML, Luippold HE. 1958. Factors limiting the number of radiation-induced chromosome exchanges. I. Distance: evidence from non-interaction of x-ray- and neutron-induced breaks. J Biophys Biochem Cytol. 4(4):365–372. doi:10.1083/jcb.4.4.365
- Young RW, Kerr GD, editors. 2005. Reassessment of the atomic bomb radiation dosimetry for Hiroshima and Nagasaki Dosimetry System 2002. Hiroshima: Radiation Effects Research Foundation.