
ABSTRACT
This paper discusses the development and testing of a new composite scale for measuring gender diversity, for use in survey research and statistical analysis: the Gender Variance Scale (GVS). The GVS measures gender diversity on a spectrum and can be used across both cisgender and trans populations to identify experiences of gender beyond a basic male/female sex binary. The GVS was piloted with a sample of 1,776 adolescents and young people ages 14–24 years, in the context of a broader study exploring the relationships between gender variance, young people’s experiences and wellbeing. Analysis of data indicated that the GVS contained both face and construct validity and reliability in the context of the pilot study. In addition, the data revealed some interesting associations between the GVS and other demographic features of the sample of youth surveyed; for example, higher levels of gender variance were associated with being lesbian, gay or bisexual and having a disability. The findings of this study may be of interest for building a stronger empirical understanding of gender diversity and its intersections with other aspects of identity.
Introduction
This paper explores the development and testing of a new composite scale for measuring gender variance, for use in survey research and statistical analysis. In the context of qualitative sociological research, ‘gender’ has been extensively conceptualized as complex, layered, subjective and multidimensional (Gabaccia & Maynes, Citation2013). However, in most quantitative sociological studies, gender has been operationalized as fixed, objective and binary. Amongst other limitations, this has led to the exclusion of many sex and gender diverse groups, including transgender, non-binary and intersex persons from evidence collection and analysis (Glick et al., Citation2018).
On the other hand, over the last decades, various scales for measuring gender differences quantitatively have been developed by psychologists. However, these are typically ‘standalone’ scales, composed of a large number of questions (e.g. 50+ items), making them cumbersome for survey respondents to fill out, and impractical for use in the context of a broader survey (Bem, Citation1974; Chesebro & Fuse, Citation2001; Mahalik et al., Citation2003, Citation2005; Snell et al., Citation1986). Furthermore, they typically focus on assessing whether participants’ personalities, preferences, behaviour, etc., conform to a set of predetermined (stereotyped) masculine or feminine norms or traits. For example, one popular and influential measure from the 1970s asks respondents to rate how ‘analytical’ and ‘competitive’ they are, in partial measure of masculinity, compared to ‘yielding’, ‘flatterable’ and ‘childlike’, to measure aspects of femininity (Bem, Citation1974). Yet, it has since been convincingly argued that a person’s adherence to traditional gender roles or stereotypes is not necessarily a reliable predictor of their identity (Hoffman & Borders, Citation2001).
Meanwhile, a third type of scale has sought to measure experiences of gender dysphoria or gender-related distress. These include: the Utrecht Gender Dysphoria Scale (UGDS), and it’s variant Gender Spectrum Scale (UGDS-GSS) (McGuire et al., Citation2020); the Gender Identity Gender Dysphoria questionnaire (GIDYQ) (Deogracias et al., Citation2007), and the Trans Youth CAN! Gender distress (TYC-GDS) and gender positivity (TYC-GPS) scales (Saewyc et al., Citation2022). These scales have been validated as accurately able to identify transsexual individuals from cisgender ‘controls’. They have been used to signal individuals who might require physical interventions and track changes in individuals’ dysphoric distress over time (McGuire et al., Citation2020). However, the primary aim of such scales is not to measure variant experiences of gender on a spectrum across a general population, but to identify individuals with specific gender identity ‘problems’, for targeting and measuring health interventions (Deogracias et al., Citation2007). These scales are routed a pathologizing framework for understanding gender difference, whereby experiences of gender are measured on a continuum with unproblematic (healthy) gender identity on one side, and experiences of gender-related distress and dysphoria on the other.
Such tools derive from a historic understanding of transness within the field of psychology as a specific, rare (and treatable) form of psychiatric disorder, whereby an individual feels a persistent and marked unease with their natal (‘natural’) sex. Although transgender identity is no longer itself defined as a mental illness (with the removal of ‘gender identity disorder’ from the American Psychological Association’s Diagnostic Statistical Manual, DSM-5, in 2013), its replacement with the diagnosis ‘gender dysphoria’ arguably perpetuates the general understanding of (trans)gender variance as exceptional, deviant and pathological (Johnson, Citation2015). Concomitantly, the dearth of tools for measuring gender diversity in the context of sociological research reflects a long history of exclusion of trans and other gender diverse groups from social, political and cultural processes, as well as from demographic and population data collection and analysis. Practices across both disciplines have historically privileged an understanding of gender difference routed in an assumption of two naturally occurring, oppositional and mutually exclusive sex categories.
Yet, the last decade has been a time of profound challenge to traditional (binary) ideas about gender and identity. There has been a heightened awareness and visibility of persons expressing variant sex and gender identities, including in mainstream media (McGuire et al., Citation2020). Young people have been developing increasingly diverse ways of thinking about and expressing gender (Bragg et al., Citation2018) and there has been a proliferation of individuals seeking out gender-related health services and support (Royal College of General Practitioners, 2019). There has been extensive media and policy debate concerning the appropriate boundaries of civil and political rights for transgender individuals, as well as intense scrutiny concerning the provision of gender-related medical interventions in specialist NHS clinics, particularly to adolescents and youth experiencing issues with gender, recently also becoming a matter of high-profile litigation (e.g. Tavistock vs Bell)
It is in these contexts that there is urgent need to develop new scientific measures that can account for the complexities of gender beyond a traditional sex binary. New tools for measuring gender have the potential to facilitate better understanding of the diverse and intersecting needs of different individuals and populations; they can result in better-differentiated and more inclusive data which can be used to address gendered inequities and improve policy decision making and care practices for gender diverse groups.
This paper explores findings from a research project aimed at contributing to such an end. The goal was to develop and integrate a new survey scale to identify and measure gender diversity on a spectrum, in the context of a broader sociological study exploring how gender variance affects young people’s experiences and wellbeing. The developed ‘Gender Variance Scale’ (GVS) measures individuals’ self-perceived adherence to masculinity/femininity norms across multiple aspects, including their interests, behaviour, appearance and identity. Results are then scored in relation to sex registered at birth to measure the extent to which a respondent’s gender identity aligns with, or deviates from, dominant expectations associated with their birth (registered) sex.Footnote1 The tool aims to capture diversity amongst both trans and non-trans persons.
The GVS is not intended to replace options for self-described gender identity in survey research (through, for example, the provision of more differentiated ‘drop-down’ gender categories), but rather to enable the measurement gender diversity on a scale across both cis and trans populations. While ‘trans’ and ‘cis’ may be a binary, the tool posits that gender variance may exist on a spectrum within and across both groups, such that, far from being separate spectra, ‘trans’ and ‘cis’ may be ‘the two end points of the same line’, whereby ‘there is a place along the way where trans and cis begin to blur’ (Hansbury, 2017: 400).
The GVS was distributed to a cohort of 1,776 adolescents and young people aged 14–24 years, as part of a broader survey about young people’s experiences and wellbeing. The data were then analysed to evaluate the face and construct validity, and reliability of the GVS. Face validity considers whether the tool subjectively appears to measure what is it aims to measure (e.g. gender diversity), and construct validity considers whether it can actually be demonstrated to do so through comparison to other observable or measurable indicators (e.g. whether a respondent self describes as cisgender, transgender, nonbinary etc.) Meanwhile, reliability refers to the internal consistency of a measure (e.g. does each component of the GVS accurately correlate with the total score?).
In addition to testing for validity, the results from the survey were analysed to empirically explore relationships between young people’s GVS scores and other key demographic features of the sample, including disability, sexuality, ethnicity, age and sex registered at birth. The analysis reveals some interesting results that complement qualitative and theoretical sociological literatures that have explored gender diversity and its intersections.
Methodology
Development of the GVS: adaptation from the ‘Sexual Identity Scale’ (SIS)
The project started with a focused literature review of current quantitative scales for measuring gender variance. On the basis of this review, a lesser-known tool developed by (Stern et al., Citation1987) called the ‘Sexual Identity Scale’ (SIS) was selected for adaption. The SIS asks respondents to self-assess themselves as typically ‘masculine’ or ‘feminine’ with regard to four functional areas or dimensions of the ‘self’, previously identified in both sex and age role literature (Stern et al., Citation1987):
Feel – Personality/Emotional
Look – Physical/Biological
Do – Societal/Occupational
Interest – Cognitive/Intellectual
The SIS was judged to have several advantages compared to more commonly used multi-trait gender difference measures, leading to its selection for adaptation in this study. Importantly, it relies on a respondent’s direct, subjective, self-rating of themselves as ‘typically’ ‘masculine’ or ‘feminine’ across each of the four dimensions, as opposed to asking individuals to self-report on their adherence to pre-selected personality traits, coded ‘masculine’ or ‘feminine’ by the researcher. This approach avoids any presumptions about what might constitute ‘typically’ ‘masculine’ or ‘feminine’ qualities, recognizing that that cultural definitions of maleness and femaleness are varied and complex, and that individuals are not just passive recipients of cultural meanings about gender, but active participants in the subjective constructions of those meanings. Further, it fits with how gender identity has been widely conceptualized in transgender and queer literatures: as a psychic investment in ‘self’ as a masculine, feminine or non-binary person (Elliot, Citation2016). Secondly, the scale is designed to be short and simple, easily interpreted by researcher and respondent alike, rendering it ideal for inclusion in a larger survey, and for use with adolescents and young people.
On the other hand, a central limitation of the SIS is its conceptualization of ‘sexual identity’ as bipolar; respondents are required to rate themselves on a continuum ranging from masculinity at one end to femininity at the other. Whilst a powerful masculine/feminine dichotomy underwrites hegemonic understandings of gender difference, the principle of bipolarity is not absolute. Masculinity and femininity have also been understood as two distinguishable and bendable traits which may coexist to variable degrees within different individuals (Marsh & Myers, Citation1986).
The GVS was developed through building upon and adapting the SIS in the following ways. Firstly, respondents were asked to self-assess their femininity and masculinity separately (with regard to each of the four dimensions, ‘feel’, ‘look’, ‘do’, ‘interests’), generating an independent ‘masculinity score’ and a ‘femininity score’ for each respondent. Secondly, more variability was introduced into the scale: whilst the SIS uses a 5 point Likert scale, the GVS uses a 9 point scale from 1 ‘not at all’ ‘feminine/masculine’ to 9 ‘completely’ ‘feminine/masculine’, to enable greater sensitivity to diversity. Third, each respondent was asked to answer a question about their sex registered at birth (sex as recorded on birth certificate).
Following these modifications the tool was piloted with two groups (each around 15 students) of A-level students accessed through a London-based further education college. Young people were asked to fill out the survey independently and then discuss in groups of 2–3 students their experiences of filling out the tool. They were asked to consider the interest, relevance, and accessibility of the tool, with a particular mind to identifying whether they found the questions easy or difficult to answer and whether they felt any questions were repetitive or were missing. On the basis of feedback from this pilot a final modification was made to the tool: the ‘feel’ dimension of the scale was divided into two questions, whereby respondents were first asked to assess the extent to which they ‘feel masculine/feel feminine’, and then separately the extent to which they ‘feel male/female’. This allowed respondents to express feelings of femininity/masculinity that did not necessarily directly relate to their sexed embodiment.
Responses to each item component were aggregated to create two separate scores for each respondent: a ‘masculinity score’ ranging from 5–45, and a ‘femininity score’ ranging from 5–45. These scores were obtained by summing the individual scores for each of the five questions. (The score for each question ranged from 1–9, so that the total score for each subscale ran from 5–45). These scores were then combined to create a final gender variance or ‘transness’ score for each respondent according to the following formula:
GVS = ((45-masculine score) + (feminine score-5) IF birth registered sex=male) OR
((45-feminine score) + (masculine score-5) IF birth registered sex=female)
The GVS measures an individual’s level of (transgendered) variance or deviance from a prevailing ‘cisgendered’ norm: on a scale from 0 (minimum possible variance) to 80 (maximum possible variance).
Implementing the GVS
Between 2019–20 1,776 young people ages 14–24 years filled out a structured survey (Appendix 1). The survey had several parts, comprising questions concerning: sex and gender identity (including the items in the GVS scale); other demographic factors; experiences in school and healthcare; and aspects of wellbeing. Young people were sampled through a mixed approach. 1,509 respondents were accessed through 10 schools and further education colleges. Schools/colleges were selected randomly from an online directory. Schools/colleges were grouped into counties across England, Wales and Scotland; a random number generator was used to select one school in each district to be contacted about the study. In return for filling out the survey, a researcher offered to deliver a talk in the school about gender diversity, and to share school-specific aggregate results from the survey concerning student diversity and wellbeing. Of all schools/colleges contacted, six responded positively and were then asked to distribute the survey to all students ages 14 and above, to be filled out independently on a voluntary basis. A total of 1,358 youth respondents responded from across these six schools. An additional four schools were accessed through convenience/personal contacts, and additional 151 respondents filled out the survey from these schools. Schools were given the option to distribute a paper version of the survey, or share an online link, via google forms. Finally, an additional 267 young people were recruited online, through social media groups and forums specifically for gender and sex diverse adolescents and youth. This was to ensure a larger sample of gender or sex diverse young people were included in the study. Young people needed to be aged between 14–24 years and living in the United Kingdom in order to be eligible to participate. No incentives were offered to young people for filling out the survey; recruitment therefore relied on the interest of young people to participate. More details of the sample are specififed in .
Table 1. Description of survey sample.
The survey was anonymous. Questions were designed to be sensitively phrased and age-appropriate, with procedures in place for managing any distress caused by the survey. An ethics protocol was developed to guide the research, and this protocol, along with the research methodology and survey tool, was subject to formal review and approval by the Humanities and Social Sciences Research Ethics Committee, University of Cambridge.
Data was entered into an Excel sheet and stored on a secure, password locked computer. Data was uploaded into Stata software for processing and analysis.
Analysis
To test GVS validity, the study considered its relationship to a number of comparison measures. T tests () were conducted to measure average GVS scores according to whether: 1) a respondent’s gender identity ‘matched’ their sex identified at birth; 2) whether a respondent identified as ‘binary’ or ‘non-binary’ (trans sample only); 3) whether a respondent said they were ‘questioning’ their gender identity (cisgender sample only); 4) whether a respondent said they were suffering from dysphoria. Pearson correlation was used to test the relationship between the GVS and another scalar variable which asked participants to rate the extent to which they identified with their birth sex from 0 ‘not at all’ to 9 ‘completely’.
Table 2. T-tests of GVS scores by gender population.
The analysis also considered validity of the subcomponent masculine/feminine scores, through Pearson correlations with self-reported gender identity: whether the respondent identified as male, female, non-binary and ‘other’ ( and ). The relationship between the subcomponent masculinity and femininity scores was also explored using Pearson correlation.
Table 3. Correlation matrix masculine and feminine scores and (binary) gender.
Table 4. Correlation matrix masculine and feminine scores and nonbinary or questioning gender.
Relationships between the four sub-dimensions of gender self-perception (‘feel’, ‘do’, ‘look’, ‘interests’) were tested for validity in (Stern et al., Citation1987) original paper. The GVS scale differs from the SIS in that respondents were asked separately whether they feel ‘male’ and/or ‘female’ and whether they feel ‘masculine’ and or ‘feminine’. T tests were used to explore whether the mean scores for these two questions were significantly different from one another to determine whether it was meaningful to ask two separate questions ().
Table 5. T-tests comparing boys’ and girls’ responses to ‘feel male/female’ and ‘feel masculine/feminine’.
Finally, reliability of the GVS was evaluated using Cronbach’s alpha.
Following tests for validity and reliability, the data was then explored to investigate relationships between the GVS and other demographic variables captured in the survey. T tests were performed to ascertain whether there were any differences in GVS scores according to whether a respondent: 1) was registered male or female at birth; 2) reported having a disability; 3) identified as LGBQ; 4) was from an ethnic minority background ().
Table 6. T-tests of GVS score by demographic sub-population.
Regression analysis was then used to further explore the relationship between these variables and the CVS within the cisgender population, additionally controlling for age and socio-economic factors (). Independent variables comprised four binary variables to measure whether: a respondent had a self-reported disability; was BME; identified as LGBQ, and was registered female sex at birth; two scalar variables describing a respondents age in years, and information about their socio-economic background were also included in the model. To measure socio-economic status, young people were asked three simple questions: ‘does you household receive income support’, ‘is your household eligible for free school meals’, and ‘did either of your parents complete a degree course or equivalent’. Young people received a point for answering ‘yes’ to either of the first two questions, and for answering ‘no’ to the final question. These responses were aggregated to form a simple scale (SEC) ranging from 0 (least deprived) to 3 (most deprived). The model was adjusted to account for the clustered sampling design using cluster robust standard errors, and the non-normal distribution of the GVS was accounted for using a bootstrap approach.
Table 7. Disability, sexuality and birth registered sex of cisgender and transgender subsamples.
Table 8. Regression model: demographic factors associated with GVS score in cisgender sample.
Results
describes the results of t- tests to measure average GVS scores against different gender populations. As would be expected, the mean score for respondents whose gender identity did not align with their sex registered at birth was significantly higher than for those whose gender identity matched their birth-registered sex. Binary trans respondents had the highest mean GVS score, followed by non-binary trans respondents. Cisgender youth who said they were ‘questioning’ their gender also had significantly higher mean GVS scores compared to those not questioning their gender. Furthermore, respondents who said that they were suffering from gender dysphoria had significantly higher GVS scores than those not affected by dysphoria.
Pearson correlation revealed a strong and significant inverse correlation between the scalar variable ‘on a scale of 1 “not at all”, to 9 “completely” to what extent do you identify with your birth sex?’ and the GVS (r = −0.79, p < .00001).
Pearson correlations between self-reported gender identity and the masculine and feminine scores revealed that respondents who identify as men/boys typically perceive themselves as masculine (r = 0.87, p < .00001), and those who identify as women/girls perceive themselves as feminine (r = 0.87, p < .00001). Correlations between these scores and respondents who identified as nonbinary or ‘questioning’ were weak and insignificant.
Pearson correlation also revealed a strong and significant inverse relationship between the masculinity and femininity scores (r = −0.94, p < .00001). This relationship was particularly strong for gender binary respondents (−0.95, p < 0.000) and much weaker, but still significant, for non-binary respondents (−0.47, p < .00001).
describes the results of t- tests to measure the difference in scores between feeling ‘masculine/feminine’ and feeling ‘male/female’. The mean scores between these questions were significantly different across gender populations, indicating that it was meaningful to ask two separate questions (). Feeling ‘male’ or feeling ‘female’ was found to be a stronger predictor of gender identity than feeling ‘masculine’ or feeling ‘feminine’.
Assessment of internal consistency of the subcomponents of GVS in terms of Cronbach’s alpha showed a coefficient of 0.965 for both the natal female and natal male populations, providing good evidence of the scale’s reliability in the present study.
Overall, these findings indicate that the GVS, and its subcomponent masculine and feminine scores, contain both face and construct validity, when compared to other variables measuring gender identity and diversity.
Application of the GVS: comparison with other demographic variables
describes the differences in GVS scores across different demographic variables measured in the survey, including disability, sexuality, sex registered at birth and ethnicity. Amongst the cisgender population: disabled, LGBQ and female-registered youth all had significantly higher GVS scores; there were no differences in scores observed between the white British and black and ethnic minority (BME) populations.
Whilst significantly higher proportions of trans youth, compared to cisgender youth, had a disability (x2 = 152.69 p < .00001), were LGBQ (x2 = 418.47, p < .00001) and were female-registered (x2 = 11.44, p = .001) (), within these trans subpopulations, significant differences between GVS mean scores were not observed, except for sexuality, where LGBQ trans respondents had a slightly lower mean GVS score than trans youth who identified as straight. This may be because LGBQ trans youth are more likely to identify as non-binary, thus scoring lower on the GVS.
describes the results of regression analysis further exploring the relationship between demographic variables and the CVS within the cisgender population. Factors associated with significantly higher GVS scores were disability, LGBQ attraction, female sex registration, and older age. Ethnicity and socio-economic factors were not significantly associated with respondents’ GVS scores.
Discussion
The development of the GVS constitutes an exploratory effort to develop and test a new tool for measuring gender variance/conformity on a spectrum. The GVS constitutes a measure of deviance from a cisgender norm, based on respondents’ self-assessment of their own adherence to masculinity/femininity norms across four key domains: looks, feelings, actions and interests. The results of this first study, indicating both validity and reliability, suggest that the tool may be usefully applied across both gender-typical and gender-a-typical populations, to identify experiences of gender beyond a traditional male/female sex binary.
An initial pilot of the tool identifies some interesting associations between demographic factors and gender variance as measured by the GVS. Firstly, there are significantly higher levels of gender variance observed in the (non-trans) LGBQ population compared to the straight cisgender population. Meanwhile, trans youth in the sample were less likely than non-trans youth to identity as ‘straight’. These findings complement a body of theoretical feminist and queer literature which has explored how heterosexuality regulates gender as a binary relation (Butler, Citation1990).
Secondly, there’s an association between the GVS and age, with lower levels of gender non-conformity reported in younger adolescents, compared to young adults. A body of ethnographic research has explored how adolescence can be an especially ‘gender-policed’ stage in human development, where strict conformity to rigid hetero-gendered norms is punitively enforced (Pascoe, Citation2007), providing one possible (at least partial) explanation for this relationship.
Third, the significantly higher levels of gender variance observed in the cisgender female population compared to the cisgender male population align with a body of literature which has explored the especially inflexible and restrictive nature of constructs of masculinity, especially amongst adolescents (Reigeluth & Addis, Citation2016).
Finally, the results reveal a significant association between disability and gender variance. Almost half, 47.53%, of trans respondents reported having a disability, compared to just 13.42% of cisgender respondents. Recent research conducted by the University and Colleges Admissions Service (UCAS), found a very similar rate of self-declared disability (47%) amongst trans students (UCAS, Citation2021). While trans and non-binary youth reported higher rates of all types of disability, the high empirical co-occurrence of forms of neurodivergence, particularly autism spectrum disorder, and gender dysphoria, frequently observed in clinical settings (Author 3 et al, Citation2023), is a topic of increasing academic interest and debate (Strang et al., Citation2014). The reasons for this overlap are not yet well understood. It is interesting that, in this survey, while gender variant youth were more likely to have a disability, disabled youth within the cisgender population also reported significantly higher mean GVS scores ().
The findings from this study may be of interest for building a stronger empirical understanding of gender diversity and its intersections with other aspects of identity.
Limitations
Despite some encouraging results, this research was limited in several respects. Firstly, the survey was distributed to a non-probabilistic sample of young people through a mixture of recruitment strategies. Secondly, the survey was filled out on a strictly voluntary basis. Both of these factors will have introduced significant bias into the sample. In particular, the results will be skewed to representing those young people who had a personal interest in filling out the survey who may be different from those who chose not to fill out the survey in important ways. This bias can be seen in the relative overrepresentation of young people who identified as LGBQ and were registered female at birth, including within the cisgender subsample.
A major limitation of the developed GVS scale is in its treatment of non-binary and genderqueer or gender fluid respondents. Since the scale is linear and bi-polar, it cannot capture the full spectrum of diversity amongst these groups; the way the scale is calculated means that nonbinary respondents who identify ‘between’ male/masculine and female/feminine, will be afforded similar GVS scores to those who identify as both male/masculine and female/feminine, or neither male/masculine and female/feminine. Further research might consider if and how the GVS might be developed and modified to better reflect diversity amongst nonbinary gender groups.
Conclusions
The 11-item GVS, along with its subscale masculine and feminine scores, offers a novel tool for measuring gender diversity on a spectrum, across both trans and cisgender populations. It is short, accessible to younger respondents and takes just a few minutes to complete. This scale may be incorporated within research surveys to facilitate empirical investigations connected to gender diversity. At this stage, further empirical testing of the GVS would be valuable to better ascertain its usefulness.
Disclosure statement
No potential conflict of interest was reported by the authors.
Additional information
Notes on contributors
Elizabeth Yarrow
Elizabeth Yarrow is a PhD candidate at the Centre for Gender Studies, University of Cambridge, and a senior researcher at Coram International. Her research focuses on exploring the intersections between childhood, gender, sexuality and violence, and adolescents and young people’s access to sexual and reproductive health services.
Robbie Duschinsky
Robbie Duschinsky is Associate Professor of Social Sciences in the Primary Care Unit, University of Cambridge, and a fellow and director of Studies at Sidney Sussex College, Cambridge. He is co-PI on the Living Assessments study (Wellcome) and the COACHES study (NIHR/What Works Centre for Children’s Social Care) which address challenges in the integration of health and social care services for children and families.
Catherine L Saunders
Catherine L Saunders is a statistician in the Primary Care Unit at the University of Cambridge. She is trained in medicine and statistics and she works on health services and policy research and evaluation projects using quantitative methods, and routine healthcare data, particularly the evaluation of service innovation in the NHS, and researching how to improve LGBTQ+ health and healthcare outcomes.
Notes
1. Throughout this paper the language of ‘sex registered at birth’ is used instead of ‘sex assigned at birth’. While the language of ‘sex assigned at birth’ is familiar and preferred within trans/gender diverse communities, it has been determined to be less well-understood within broader populations. ‘sex registered at birth’ has been found to be more accessible, as it doesn’t require any specific knowledge or understanding of gender diversity, but rather refers descriptively to an administrative event. The survey tool therefore asked respondents about their ‘sex registered at birth (the sex put on your birth certificate)’, and this is the language used throughout the paper to describe and report results for the sake of accuracy and consistency.
References
- Author 3 et al. (2023). Demographic characteristics, long-term health conditions and healthcare experiences of 6333 trans and non-binary adults in England: Nationally representative evidence from the 2021 GP Patient survey. Available at. British Medical Journal Open, 13(2), e068099. https://doi.org/10.1136/bmjopen-2022-068099.
- Bem, S. L. (1974). The measurement of psychological androgyny. Journal of Consulting and Clinical Psychology, 42(2), 155–162. https://doi.org/10.1037/h0036215
- Bragg, S., Renold, E. R., Ringrose, J., & Jackson, C. (2018). ‘More than boy, girl, male, female’: Exploring young people’s views on gender diversity within and beyond school contexts. Sex Education, 18(4), 420–434. https://doi.org/10.1080/14681811.2018.1439373
- Butler, J. (1990). Gender trouble: Feminism and the Subversion of Identity, self and subjectivity Available at. Routledge. https://doi.org/10.1002/9780470774847.ch19
- Chesebro, J. W., & Fuse, K. (2001). The development of a perceived masculinity scale. Communication Quarterly, 49(3), 203–278. ( Available at). https://doi.org/10.1080/01463370109385628
- Deogracias, J. J., Johnson, L. L., Meyer-Bahlburg, H. F. L., Kessler, S. J., Schober, J. M., & Zucker, K. J. (2007). The gender identity/gender dysphoria questionnaire for adolescents and adults. Journal of Sex Research, 44(4), 370–379. https://doi.org/10.1080/00224490701586730
- Elliot, P. (2016). Debates in transgender, queer, and feminist theory: Contested sites. Taylor and Francis. Available at. https://doi.org/10.4324/9781315576008
- Gabaccia, D. R., & Maynes, M. J. (2013). Gender history across epistemologies. In I. I. A. I. U. Donna (Ed.), Gabaccia and Mary Jo Maynes (pp. 1–19). Wiley-Blackwell.
- Glick, J. L., Theall, K., Andrinopoulos, K., & Kendall, C. (2018). For data’s sake: Dilemmas in the measurement of gender minorities. Culture, Health & Sexuality, 20(12), 1362–1377. https://doi.org/10.1080/13691058.2018.1437220
- Hoffman, R. M., & Borders, L. D. (2001). Twenty-five years after the Bem sex-Role Inventory: A reassessment and new issues regarding classification variability. Measurement and Evaluation in Counseling and Development, 34(1), 39. https://doi.org/10.1080/07481756.2001.12069021
- Mahalik, J. R., Locke, B. D., Ludlow, L. H., Diemer, M. A., Scott, R. P. J., Gottfried, M., & Freitas, G. (2003). Development of the conformity to masculine norms inventory. Psychology of Men & Masculinity, 4(1), 3–25. https://doi.org/10.1037/1524-9220.4.1.3
- Mahalik, J. R., Morray, E. B., Coonerty-Femiano, A., Ludlow, L. H., Slattery, S. M., & Smiler, A. (2005). Development of the conformity to feminine norms inventory. Sex Roles, 52(7–8), 417–435. https://doi.org/10.1007/s11199-005-3709-7
- Marsh, H. W., & Myers, M. (1986). Masculinity, femininity, and androgyny: A methodological and theoretical critique. Sex Roles, 14(7–8), 397–430. https://doi.org/10.1007/BF00288424
- McGuire, J. K., Berg, D., Catalpa, J. M., Morrow, Q. J., Fish, J. N., Rider, G. N., Steensma, T., Cohen-Kettenis, P. T., & Spencer, K. (2020). Utrecht gender dysphoria scale - gender spectrum (UGDS-GS): Construct validity among transgender, nonbinary, and LGBQ samples. International Journal of Transgender Health, 21(2), 194–208. https://doi.org/10.1080/26895269.2020.1723460
- Pascoe, C. J. (2007). Dude, you’re a fag: Masculinity and sexuality in high School. Available at. University of California Press. https://doi.org/10.1007/s13398-014-0173-7.2
- Reigeluth, C. S., & Addis, M. E. (2016). Adolescent boys’ experiences with policing of masculinity: Forms, functions, and consequences. Psychology of Men & Masculinity, 17(1), 74–83. https://doi.org/10.1037/a0039342
- Saewyc, E. M., Gotovac, S., Villalobos, M. C., Scheim, A., Vandermorris, A., & Bauer, G. (2022). Development and validation of new gender distress and gender positivity scales for transgender adolescents in Canada. Journal of Adolescent Health, 70(4), S10–S10. https://doi.org/10.1016/j.jadohealth.2022.01.130
- Snell, W. E., Belk, S. S., & Hawkins, R. C. (1986). The masculine and feminine self-disclosure scale: The Politics of masculine and feminine self-presentation. Sex Roles.
- Stern, B. B., Barak, B., & Gould, S. J. (1987). Sexual identity scale: A new self-assessment measure. Sex Roles, 17(9–10), 503–519. ( Available at). https://doi.org/10.1007/BF00287732
- Strang, J. F., Kenworthy, L., Dominska, A., Sokoloff, J., Kenealy, L. E., Berl, M., Walsh, K., Menvielle, E., Slesaransky-Poe, G., Kim, K-E., Luong-Tran, C., Meagher, H., & Wallace, G. L. (2014). Increased gender variance in autism spectrum disorders and attention deficit hyperactivity disorder. Archives of Sexual Behavior, 43(8), 1525–1533. https://doi.org/10.1007/s10508-014-0285-3
- UCAS. (2021) Next Steps: What is the Experiences of LGBT+ Students in Education? Cheltenham. Available at: https://www.ucas.com/file/535266/download?token=XF_6zKDw#:~:text=Individuals%20that%20identify%20as%20transgender,students%20when%20exploring%20their%20options (Retrieved April 10, 2023).
Appendix
The GVS Scale
Many people describe themselves and others as some combination of feminine (girlish) and masculine (boyish) because of how we feel, act, talk or dress. The next questions are about how you describe yourself.
1. On a scale of 1–9, where 1 means ‘not at all’, and 9 means ‘completely’, to what extent would you say that your interests are mostly those typical of a boy/young man/masculine person?
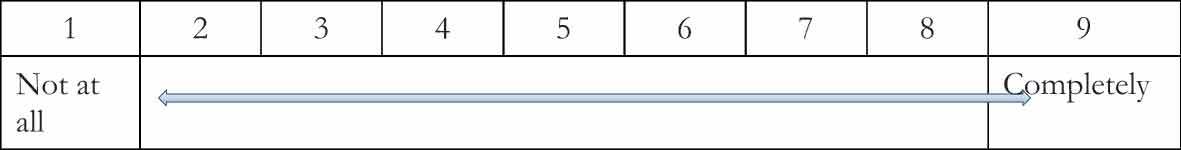
2. On a scale of 1–9, where 1 means ‘not at all’, and 9 means ‘completely’, to what extent would you say that your interests are mostly those typical of a girl/young woman/feminine person?
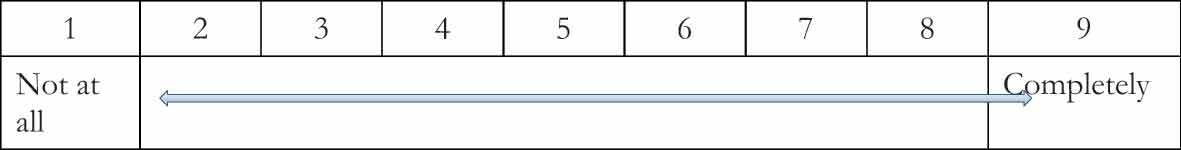
3. On a scale of 1–9, where 1 means ‘not at all’, and 9 means ‘completely’, to what extent would you say that you do most things in a manner of a boy/young man/masculine person? (Circle one number)
4. On a scale of 1–9, where 1 means ‘not at all’, and 9 means ‘completely’, to what extent would you say that you do most things in a manner of a boy/young man/masculine person? (Circle one number)
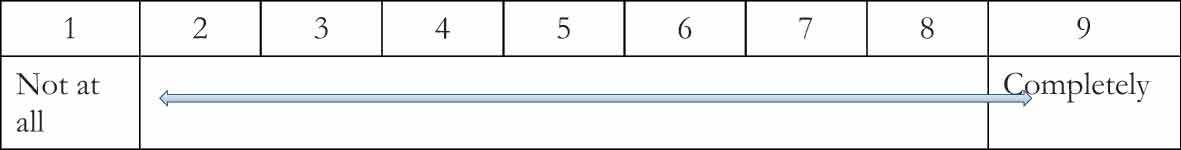
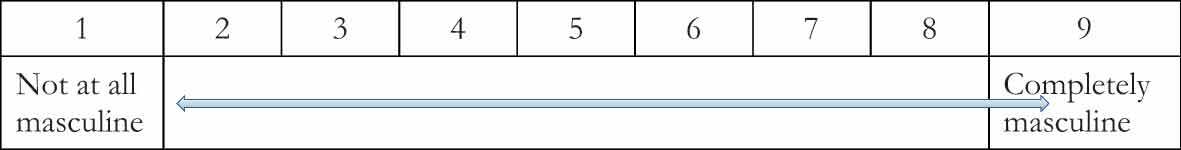
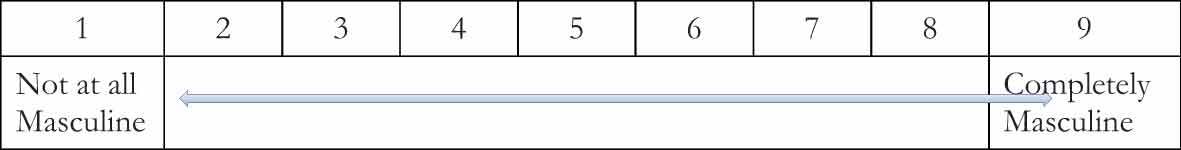
5. On a scale of 1–9, where 1 means ‘not at all’, and 9 means ‘completely’, how masculine do you think you look? (Circle one number)
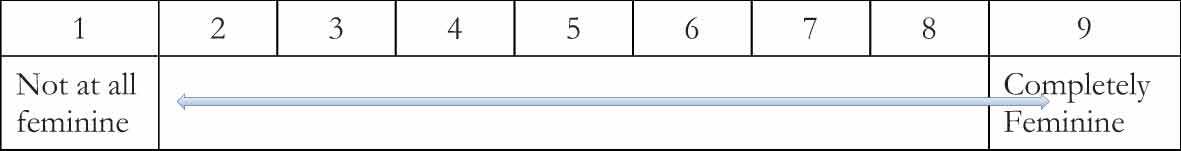
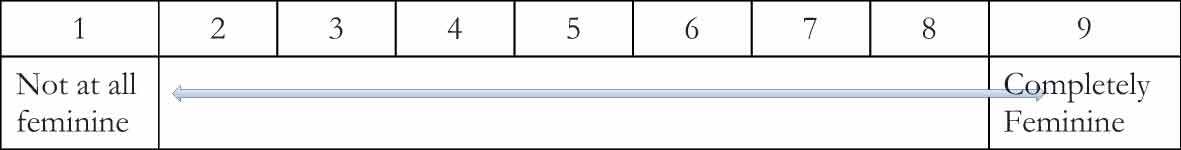
6. On a scale of 1–9, where 1 means ‘not at all’, and 9 means ‘completely’, how feminine do you think you look? (Circle one number)
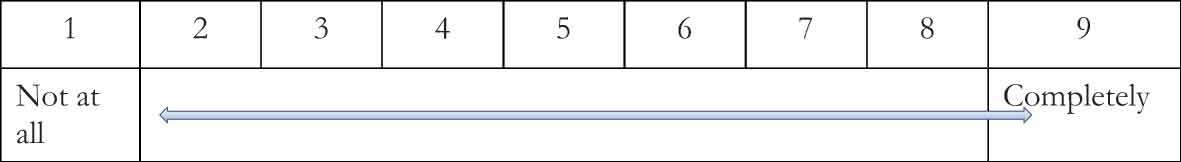
7. On a scale of 1–9, where 1 means ‘not at all’, and 9 means ‘completely’, how masculine do you feel? (Circle one number)
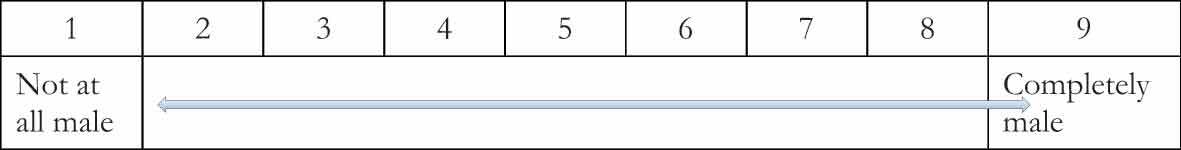
8. On a scale of 1–9, where 1 means ‘not at all’, and 9 means ‘completely’, how male do you feel? (Circle one number)
9. On a scale of 1–9, where 1 means ‘not at all’, and 9 means ‘completely’, how feminine do you feel? (Circle one number)
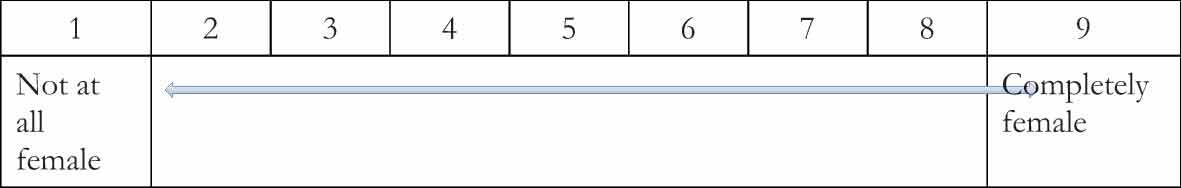
10. On a scale of 1–9, where 1 means ‘not at all’, and 9 means ‘completely’, how female do you feel? (Circle one number)
11. What was your sex registered at birth (The sex put on your birth certificate?)
❑ 1. Male❑ 2. Female