
 ?Mathematical formulae have been encoded as MathML and are displayed in this HTML version using MathJax in order to improve their display. Uncheck the box to turn MathJax off. This feature requires Javascript. Click on a formula to zoom.
ABSTRACT
Groundwater is the only source of high quality water for human consumption in most parts of the world; however, it can be easily contaminated by domestic, industrial, and agricultural wastes such as fertilisers and pesticides. The main objective of the present research was to study the photocatalytic removal of 2,4-Dichlorophenoxyacetic acid pesticide (2,4-D) from aqueous media. This was a laboratory scale study in which the zinc oxide nanoparticles were doped with 0.5, 1, and 2 molar percent of tungsten oxide. The nanoparticles synthesised were characterised using powder XRD, SEM, FTIR, and UV-Vis Spectroscopy analyses. During the photodegradation of 2,4-D, the operational parameters studied were pH, nanoparticles dosage, initial pesticide concentration, light intensity, contact time, and the mineralisation trend of organic matter. It was found that the doped nanoparticles had a smaller band gap energy, which confirms the effect of doping. The percentage of the dopant can affect the pesticide removal efficiency. The optimal pH value obtained was 7. In addition, the process efficiency, increased from 27% to 78% with increasing UV light intensity from 172 to 505 W/m2 respectively. Moreover, it was found that, with increasing light intensity, contact time and nanoparticle concentration all caused the pesticide removal efficiency to be increased too. In addition, the increase of the pesticide concentration would cause a reduction in the process removal efficiency. This study indicated that the photocatalytic process using tungsten doped zinc oxide nanoparticles can remove the 2,4-D pesticide by around 80% from the aquatic environment.
GRAPHICAL ABSTRACT
1. Introduction
In recent decades, the effect of non-point-source pollutants on the surface and underground waters has become a major concern. Although significant progress has been achieved in the control of the pollutants, a confident and high performance method has not been developed to date. The pollution of surface and underground waters has been considered as a major concern since 1940 [Citation1].
Pesticides are compounds used in pest control [Citation2]; 2,4-dechlorophenoxyacetic acid (2,4-D), which is a common and toxic pesticide, is categorised as a phenoxy acetic acid compound with weak aromatic characteristics [Citation3]. The derivatives of 2,4-D pesticide are widely used worldwide for eliminating broadleaf weeds in agriculture, parks, and meadows [Citation4]. Various studies showed that this compound can be a threat to human and animal health through exposure to contaminated air, soil, food, and drinking water. For example, it has been claimed that the risk of Parkinson's disease can be enhanced by 70% among people exposed to pesticides, even at very low levels [Citation5]. Despite the advantages of these pesticides, they have some drawbacks such as toxicity, carcinogenicity, and mutagenicity [Citation6]. The release of pesticides into drinking water resources has several adverse effects depending on the type of pesticide, usage time, duration of exposure, concentration of pesticide, and the toxicity [Citation7]. Therefore, a process capable of effectively removing pesticides is of great importance. The conventional water treatment methods are inadequate in degrading these materials. Naturally, the removal efficiency of pesticides depends on their chemical nature [Citation5].
Advanced oxidation processes (AOPs) as the most promising treatment methods are used based on the destruction of hazardous organic compounds [Citation8]. AOPs, as chemical treatment processes, are able to remove many pollutants that cannot be removed by conventional purification processes such as adsorption, coagulation, flocculation, and biological treatment processes [Citation9]. In recent years, AOPs and especially advanced photochemical oxidations have attracted the researchers interest in removing organic pollutants from aqueous solutions [Citation9]. In these processes, through a combined effect of an oxidising agent, catalyst, and radiation, organic materials are converted into inorganic compounds having lower risk. In these methods, hydroxyl radicals are generated which have high oxidative power and very low selectivity. As a result, a wide range of toxic organic compounds and hard-to-degrade organic compounds are converted into harmless degradable substances with higher degradability [Citation10,Citation11].
Several studies have been conducted on photocatalytic degradation processes [Citation12]. In photocatalytic processes, cost-effective, non-toxic and highly stable chemical catalysts are applied; besides, sunlight can be used as a cheap source of radiation [Citation13]. Among photocatalysts used for environmental application, ZnO and TiO2 are now the most frequently used photocatalytic nanomaterials [Citation3]. Zinc oxide has a band gap (3.2 eV) similar to titanium dioxide [Citation14] and its role has been demonstrated in a number of studies [Citation8, Citation14]. There are various problems in the use of bare zinc oxide nanoparticles such as wide energy gap, agglomeration, and poor dispersion [Citation15]. Therefore, researchers are focusing on changing the structure of the nanoparticles by using doping, as well as using surface inhibitors to solve these problems [Citation16]. Meanwhile, the application of surface modifiers, surfactants, chelating materials, or organic ligands can be useful [Citation17]. It should be noted that doping nanoparticles by means of a suitable dopant can cause a change in the band gap energy and can decrease the band gap energy through engineering and adding a stoichiometric amount of the dopant, which shifts the energy activation requirement from the UV radiation spectrum to the visible light spectrum [Citation18]. One of the most suitable candidates for doping is tungsten oxide (WO3), which has an energy gap of 2.8, and which activates the bed of zinc oxide. The ionic radii of W6+ and Zn2+ are 0.062 and 0.074 nm, respectively; consequently, it is theoretically feasible for the W6+ ion to substitute a Zn2+ ion into ZnO. In addition, the valence difference between W6+ and Zn2+ is +4, which is attractive since one dopant atom can therefore contribute more electrons [Citation16].
Since the photocatalysts are often used in suspension, separating these particles from an aqueous suspension has been considered as a serious drawback in the implementation of this process. Therefore, the immobilisation and fixation of nanoparticles on different materials without losing the photocatalytic properties is an effective strategy to solve this problem [Citation19]. The aim of this work was to synthesise and characterise the immobilised tungsten oxide doped ZnO under mild hydrothermal conditions and evaluate the photocatalytic efficiency of the fabricated immobilised nanoparticles in the removal of 2,4-D from aqueous media under different operational conditions. A limited number of studies [Citation20,Citation21] incorporating other metals, namely, Cu-In, In, Ce, Co oxides and salts have met with limited success but the use of WO3 reducing the band gap to such a low level in the present study and under the mild processing conditions has both technical and economic application potential.
2. Materials and methods
2.1. Materials
This study was a quasi-experimental research conducted on a laboratory-scale pilot unit. The chemicals used in the study, ZnO, n-butylamine, NaOH, and HCl were purchased from Merck (Germany). Moreover, WO3 and 2,4-D herbicide were obtained from Sigma Aldrich. shows the chemical and structural characteristics of the pesticide. In order to measure the pesticide concentration in each sample, gas chromatography (GC) (VARIAN Model CP-3800) with FID and a CP-Sil8-CB column were used. The analyte was extracted using a solvent process with ethyl acetate liquid–liquid extraction. The measurement of the organic residuals of 2,4-D after the photocatalytic process was conducted using chemical oxygen demand (COD) and total organic carbon (TOC) analyses. A TOC analyser (Model Skaler, Netherlands) was used. The removal efficiency was calculated according to Equation (1) [Citation22]:
(1)
(1) where, R is removal efficiency in percent, Cf and Ci are the final and initial concentrations of 2,4-D in mg/l, respectively.
Table 1. Chemical structure and characteristics of 2,4-D.
2.2. Batch reactor
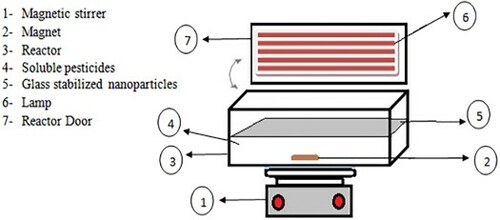
presents the batch reactor used in the current research.
Figure 1. Schematic representation of the photocatalytic reactor.
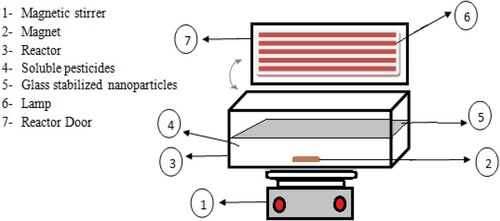
All the experiments were performed in a batch-type, 500-mL and Plexiglass reactor. Five UV lamps (42 V, 6W, 160 mA current, G5 base shape, 21.21 cm length, UVC beam: 1.7 W, 253.7 nm wavelength and 4.4 mg Hg; PHILIPS Poland) were used. The incident UV-visible light intensity was measured using a digital UV-A radiometer (model EC1, Sewden).
Moreover, a glass plate with immobilised the WO3 doped ZnO nanoparticles was in direct contact with the 2,4-D solution and irradiation.
2.3. Synthesis method of WO3 doped ZnO
The hydrothermal method was used for the synthesis of the nanoparticles. First, certain molar percentages of tungsten oxide (0.5, 1, and 2%) were added to the zinc oxide solution (2 N) in a Teflon liner. Next, both 10 ml of sodium hydroxide (1 N) and 0.5 mL of the surfactant were added dropwise under gentle mixing. Then, the liner was placed in an oven for 12 h at 120°C. Finally, the liner contents were extracted and washed with distilled water several times at ambient temperature [Citation23].
2.4. Immobilisation of nanoparticles on glass plates
For immobilisation of the fabricated nanoparticles, typical sand-blasted glasses with thickness of 4 mm were used [Citation19,Citation24]. Sand blasted glasses were placed in sodium hydroxide (50%) for 24 h. Next, the glasses were washed and dried. The WO3 doped ZnO nanoparticles were spread on the glass. The glasses were dried using an oven at 80°C, and then were placed on the grill at 500°C for 2 h. After that, the immobilised WO3 doped ZnO nanoparticles were used for systematic photodegradation experiments.
2.5. Materials characterization
The dried product was subjected to the characterisation analysis including powder X-ray diffraction (XRD) (Inel, EQUINOX 3000, France), scanning electron microscopy (SEM) (Tscan, MIRA3, Czech Republic), Fourier transform infrared spectra (FTIR) (Bruker-Tensor 27, Germany), atomic force microscopy (AFM) (Research Ara- Advance, Iran) and Zeta Potential Analysers (Brookhaven- Nanobrook, USA) in order to determine the crystal structure, morphology, and surface chemistry of the nanoparticles, respectively.
3. Results and discussion
3.1. Nanoparticle characterisation
shows the SEM images of the tungsten oxide doped ZnO nanoparticles and undoped ZnO.
Figure 2. SEM Images of nanocatalysts (a) %0.5 WO3 doped ZnO (b) %1 WO3 doped ZnO (c) %2 WO3 doped ZnO (d) ZnO.
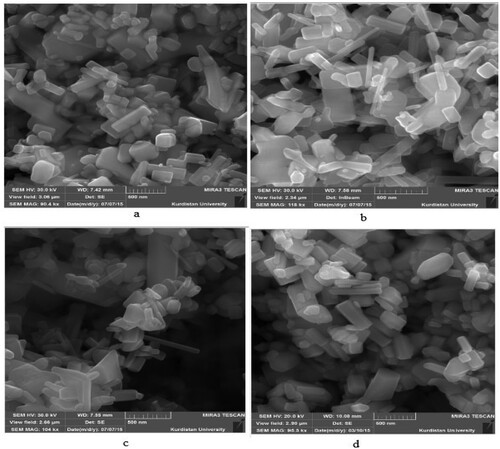
The morphology of the nanoparticles was heterogenous and there was no obvious difference in changing morphology, indicating the independency of the nanoparticles from the molar percentage. Moreover, both doped and undoped nanoparticles had some degree of agglomeration. However, the nanoparticles size distribution analysis using Digimizer software indicated that 1% mole WO3 doped ZnO nanoparticles had a smaller size compared with the other nanoparticles fabricated. presents the size distribution histogram along with its skewness and general information on the mean size of the nanoparticles.
Figure 3. Size distribution of the nanoparticles in terms of SEM (a) %0.5 WO3 doped ZnO (b) %1 WO3 doped ZnO (c) %2 WO3 doped ZnO (d) ZnO.
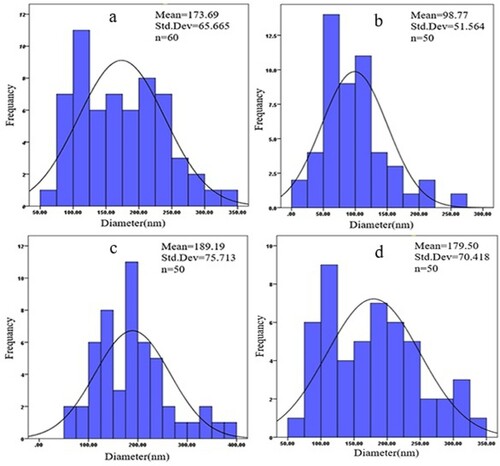
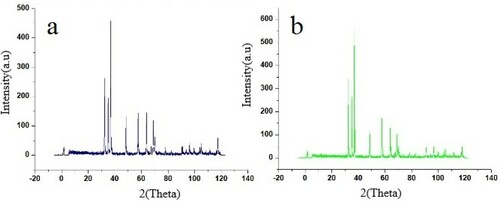
The narrower size distribution was observed in 1 mol% WO3 doped ZnO, with a mean size and standard deviation of 98.77 and 51.56 nm, respectively (). On the other hand, about 40% size reduction had occurred compared with undoped ZnO. The XRD spectrum presents more information about the phase determination and crystalline structure of the materials. shows the XRD spectra of the undoped and tungsten oxide doped ZnO nanoparticles. The three peaks of the spectra including 100, 002, and 101 are in accordance with the crystal structure of ZnO (JCPDS no.36-1451). According to the Miller index, the presence of hexagonal shaped nanoparticles is confirmed, which is supported by SEM images. Sharp peaks indicate a high degree of crystallinity of the doped zinc oxide nanoparticles. The maximum intensity of spectra appeared at the angle of 36.45° [Citation25].
Figure 4. XRD patterns of (a) undoped ZnO and (b) 1% WO3 doped ZnO.
shows the cell parameters and density of the nanoparticles. The cell parameters of the doped nanoparticles were smaller than those of the undoped zinc oxide. The reducing cell parameters could be attributed to the small size of tungsten ionic radius (0.6 angstrom). However, the density of the doped nanoparticles was higher than that of the undoped zinc oxide nanoparticles. New peaks were observed in the case of the doped ZnO nanoparticles, but a small displacement was observed in the peak location indicating the presence of tungsten [Citation26]. The results of a study by Mojdi et al. on zinc oxide doped with manganese illustrated that the lattice constant in doped samples was higher and the density of the nanoparticles had fallen [Citation27].
Table 2. Cell parameters of the nanoparticles.
The simplest and most widely used method for estimating the average crystallite size is from the full width at half maximum (FWHM) of a diffraction peak using the Scherrer’s equation (EquationEq. 2(2)
(2) ) [Citation28].
(2)
(2)
τ: average size of crystal (nm); K: crystal form factor; λ: wavelength X-ray tube manufacturer (0.154 nm); β: peak width at half maximum height
The size calculation of 1% WO3 doped ZnO using the Scherrer’s equation indicated that the mean size of the crystals was 44 nm.
In and , the EDX spectrum of the ZnO nanoparticles shows 1% WO3 doped ZnO. In this spectrum, the X-axis is the measured energy and the Y-axis represents the number of times that particular energy has been detected. Based on the appearance of the peaks, the ratio between the intensities (peak height of the elements) indicates the ratio between the concentrations; and, the peaks with higher height in the spectrum mean higher concentrations of the element in the sample. The results of show that Zn and O had 78.74 and 21.26 wt%, respectively, which is in accordance with the synthesised ZnO nanoparticles. and presents the EDX of the 1% WO3 doped ZnO nanoparticles. The findings indicated that Zn, O and W had 73.78, 21.53 and 4.69% w%, respectively, which accords with the synthesised WO3 doped ZnO nanoparticles.
Figure 5. EDX of the ZnO nanoparticles.
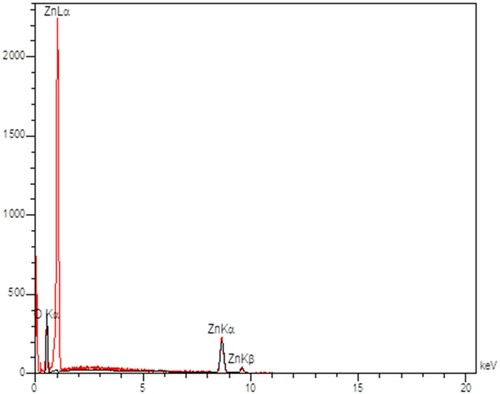
Figure 6. EDX of 1% WO3 doped ZnO nanoparticles.
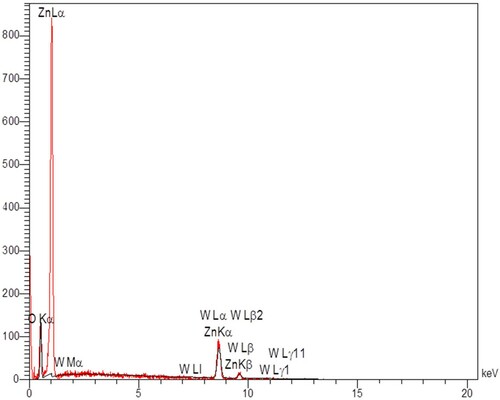
Table 3. EDX and ZnO constituents.
Table 4. EDX of 1% WO3 doped ZnO constituents.
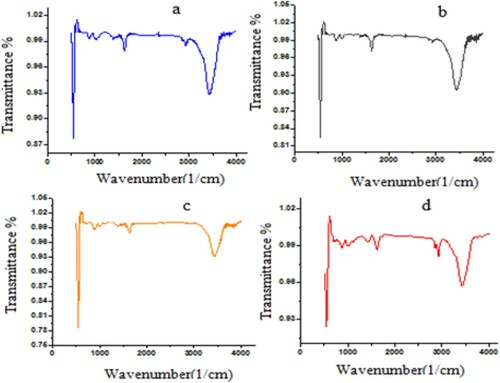
The FTIR spectra of the doped zinc oxide nanoparticles are shown in . The strong band around 469 cm−1 indicates the presence of the Zn-O stretching frequency [Citation29]. The stretching band at 1730 cm−1 shows the presence of organic matter, specifically the carboxyl group. Moreover, the stretching band around 2918 cm−1 is ascribed to the stretching symmetry of C-H. The N-H stretching vibration is apparent at 3448 cm−1, caused by the addition of n-butylamine as a surface modifier. Similar results were reported by Mote et al., who used zinc oxide doped with chromium oxide; the results of the study illustrated that a peak at 400–600 cm−1 confirmed the presence of the Zn-O stretching band and the stretching band in the range 3400–3600 cm−1 confirmed the presence of the N-H band [Citation30].
Figure 7. FTIR Diffractogram (a) 0.5% WO3 doped ZnO (b) 1% WO3 doped ZnO (c) 2% WO3 doped ZnO and (d) undoped ZnO.
shows the influence of doping on the energy gap of the nanoparticles. Zinc oxide nanoparticles doped with 0.5, 1, and 2 molar percent of tungsten and undoped zinc oxide were scanned under the ultraviolet and visible regions. In the ultraviolet region, the absorption peak of the pure zinc oxide nanoparticles occurred at a wavelength of 388 nm, this finding is consistent with data reported in a previous study [Citation31].
Figure 8. Spectra of nanoparticles (a) 0.5% WO3 doped ZnO (b) 1% WO3 doped ZnO, (c) 2% WO3 doped ZnO, and (d) undoped ZnO.
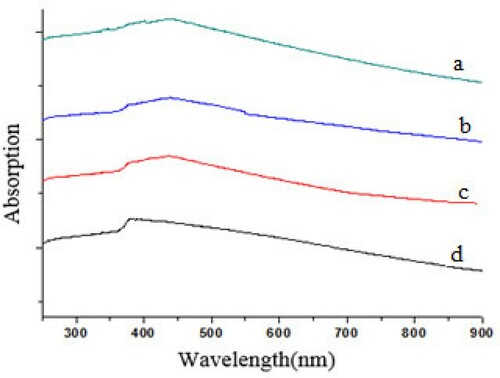
The doped zinc oxide nanoparticles had a peak at a wavelength of about 440 nm, which is higher than pure zinc oxide. Peak displacement from the ultraviolet to the visible region is evident. Consequently, zinc oxide doped with tungsten oxide can be used in the visible light region. In a study by Wang et al. [Citation32], on doping zinc oxide with nitrogen, spectrophotometric surveys showed that the absorption peak of zinc oxide increased from 384 nm for pure zinc oxide to 450 nm for doped zinc oxide. If the photons are transmitted to a semiconductor, whose energy is larger than the energy band, the electrons are transmitted to the conduction band, which causes the electron-cavity pair to form. The band gap energy of the samples was determined using the following equation:
(3)
(3) where, Eg is the band gap energy (eV), h is Planck's constant, c is the speed of light (m s−1), and λ is the wavelength (nm) [Citation15].
The Eg of undoped ZnO and 1% WO3 doped ZnO nanoparticles were 3.2 and 2.8, respectively. Wang et al. [Citation32] studied the doping of zinc oxide with nitrogen; the spectrophotometric surveys showed that the absorption peak of zinc oxide increased from 384 nm for pure zinc oxide to 450 nm for doped zinc oxide.
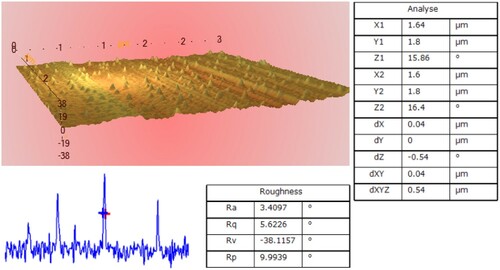
Measurable roughness parameters including average roughness (Ra), standard deviation (Rq) and average distance of peaks and valleys (Rp) were calculated by the Imager Ara software.
shows the 3D-image of atomic force microscopy in contact mode and scan distance (3 µm×3 µm). The nanoparticle diameter was 40 nm, which is consistent with the SEM and XRD results.
Figure 9. AFM of 1% WO3 doped ZnO nanoparticles.
Zeta potential is very important for understanding and controlling the properties of colloidal suspensions. In general, the characteristics of the suspension can be identified by understanding how colloids interact. To measure the zeta potential, the undoped and doped zinc oxide samples were prepared by dissolving 0.01 g of sample in 5 ml distilled water at an optimum pH value. Before the measurement, each sample was sonicated for 15 min. It should be pointed out that the zeta potential was calculated from the determined streaming current by means of the Helmholtz–Smoluchowski equation, which is applicable for any surface conductivity [Citation33]. The results are shown in .
Figure 10. Zeta potential (ELS method) of Nanoparticles (a) undoped ZnO (b) 1% WO3 doped ZnO.
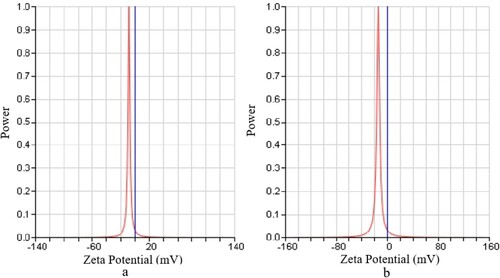
The zeta potential findings confirmed that the doping of zinc oxide nanoparticles with tungsten resulted in an increased zeta potential and movement so that the zeta potential of the undoped ZnO and 1% WO3 doped ZnO potentials were −7.34 and −14.88 mV, respectively. It is obvious that doping increased the surface charge of the zinc oxide nanoparticles; and, among different percentages of dopant, 1% WO3 doped ZnO was more stable. It is worth noting that the higher the negative charge, the greater the repulsion, the lower the negative charge becomes the chance of particle aggregation and sediment formation increases, and the more stable the particles will be.
3.2. Doping effect on photocatalytic removal efficiency of 2,4-D
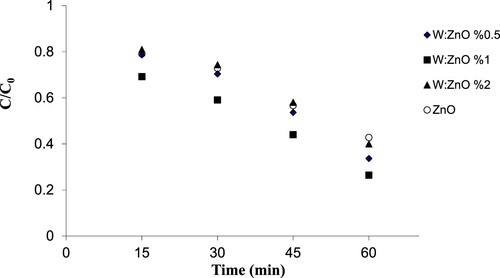
In order to determine the effect of tungsten oxide doping percentage on zinc oxide, and comparing it with undoped zinc oxide, various molar percentages of the doped ZnO samples were exposed to ultraviolet light. The sampling was carried out in intervals of 15, 30, 45, and 60 min. Next, all samples were centrifuged and extracted using ethyl acetate and liquid-liquid extraction. After injecting the samples into the gas choromatography (GC) device, the pesticide concentrations were measured.
The dopant percentage of nanoparticles affects the process in such a way that 1% of the dopant had a greater efficiency than 0.5 and 2% (). Therefore, 1% WO3 doped ZnO was selected as the optimum nanoparticle composite in the next stage. Initially, a comparison with undoped ZnO was performed; the obtained results showed that the doped zinc oxide had higher efficiency compared with the undoped ZnO. This phenomenon may be due to the reduced energy gap and its activation against the light. In a study by Abdollahi et al. [Citation34], who investigated the characteristics of zinc oxide nanoparticles doped with manganese, various manganese percentages: 0.5, 1, 1.5, and 2% were synthesised as the dopant; the results showed that 1% of manganese had a smaller particle size, and 77% of the particles were between 15 and 35 nm in size. This fraction of the particles was separated and no agglomeration was observed among the particles.
Figure 11. Effect of tungsten oxide percentage on removal efficiency (initial 2, 4-D concentration = 25 mg/L, pH = 7, cross-section=200 cm2, UV intensity=505 W/m2, dosage of nanoparticle suspension=3, 0.5, 1 and 2% WO3 doped ZnO).
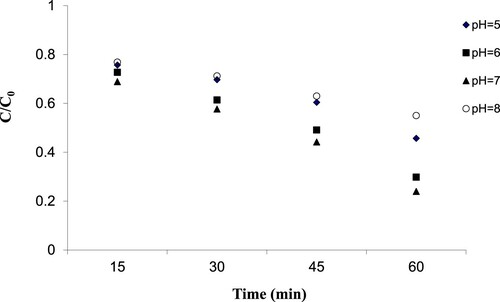
3.3. Effect of pH on photocatalytic removal efficiency of 2,4-D
Solution pH has a complex impact on the speed of photocatalytic oxidation; the type of pollutant, surface charge of the photocatalysts, ionisation conditions, and pKa value, which depends on the electrostatic interaction between catalysts and the pollutants which may influence the pH [Citation35,Citation36].
In this study, to investigate the influence of solution pH on the photocatalytic removal efficiency of 2,4-D, doped nanoparticles were used at the pH values of 5, 6, 7 and 8 under ultraviolet light (). The results showed that the optimum pH was 7, and the highest efficiency was obtained at this value. The charging point of zero of zinc oxide was about 7.5. At the pH value of 7.5, the catalyst surface had a positive charge. According to the pKa of 2,4-D, which is about 2.9, the charge of 2,4-D is negative and was higher than 2.9. Under such conditions, a strong attraction force is generated between the positively charged zinc oxide and the negatively charged 2,4-D. In addition, in alkaline conditions the zinc oxide is deposited, while, in acidic conditions, it has a tendency to dissolve and biochemical corrosion occurs [Citation37].
Figure 12. Effect of pH on removal efficiency (initial 2, 4-D concentration = 25 mg/L, pH = 5, 6, 7 and 8, cross-section=200 cm2, UV intensity=505 W/m2, nanoparticle suspension dosage=3% and 1% WO3 doped ZnO).
3.4. Effect of nanoparticle dosage on photocatalytic removal efficiency of 2,4-D
To investigate the effect of nanoparticle dosage, various suspensions of doped nanoparticles were prepared at different composite concentrations between 1 and 5 wt% in order to provide stabilisation on the glass plates. Next, the samples were exposed to ultraviolet light at the optimum pH value and doped with optimised tungsten oxide nanoparticles under the operational parameters shown in .
Figure 13. Effect of nanoparticle dosage on removal percentage (initial 2, 4-D concentration = 25 mg/L, pH = 5, 6, 7 and 8, cross-section=200 cm2, UV intensity=505 W/m2, nanoparticle suspension dosage 1, 3 and 5% and 1% WO3 doped ZnO).
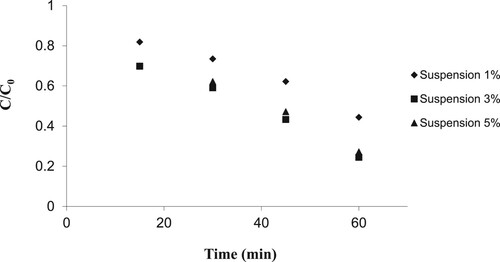
shows the effect of nanoparticle concentration on 2,4-D removal efficiency. These results demonstrate that the process efficiency increased from 0.444–0.244 C/C0 with increasing the nanoparticle concentration from 1 to 3 wt%, respectively. The removal efficiency started to decline with increasing the concentration of nanoparticles from 3 to 5 wt% (from 0.244 to 0.272 C/C0, respectively). This condition can be related to the reduction of UV light penetration into the fixed layer of nanoparticles on the glass plate [Citation38].
3.5. Effect of initial concentration of 2,4-D on the photocatalytic removal efficiency
In order to study the effect of the initial concentration of 2,4-D on the photocatalytic removal efficiency, various concentrations of the pesticide: 5, 10, 25, 50, 80, and 100 mg/L were tested at the optimal pH, dosage of 1% WO3 doped ZnO nanoparticle and ultraviolet light.
As shown in , the process efficiency for the removal of 2,4-D pesticide decreased with increasing initial pollutant concentration. Therefore, after 60 min the removal efficiency for the initial concentrations of 5 and 50 mg/L decreased from 89.7 to 54.2%. This is attributed to the fact that, with increasing initial pollutant concentration, a greater number of active sites of the catalyst surface are filled. This phenomenon reduces the formation of oxidants, and, in turn, eventually reduces the degradation rate.
Figure 14. Effect of initial pesticide concentration in removal percentage (initial 2, 4-D concentration=5, 10, 25, 50, 80 and 100 mg/L, pH=7, cross-section=200 cm2, UV intensity=505 W/m2, nanoparticle suspension concentration 3% and 1% WO3 doped ZnO).
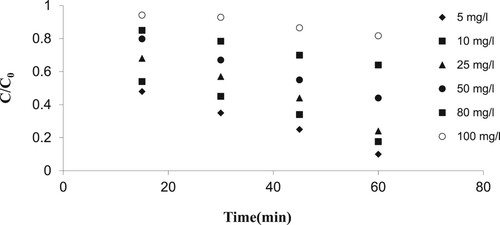
At high concentrations of the pesticide, higher photons of UV are absorbed, thus reducing the UV required to activate the catalyst and then reducing the number of active sites on the catalyst surface; this can reduce the formation of oxidants, and eventually will reduce the degradation rate. In most of previous studies on water treatment using the zinc oxide photocatalytic process and UV, with increasing the initial concentration of pollutants, the degradation efficiency declined [Citation22,Citation39–41].
In , the performance of the WO3 doped ZnO photocatalyst has been compared with other catalysts used in different studies.
Table 5. Comparison of photocatalytic degradation of 2,4-D.
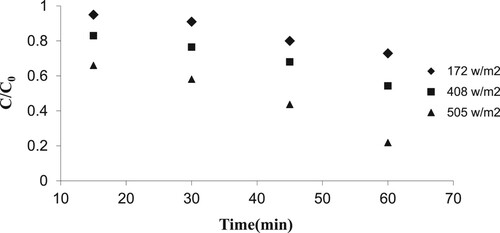
3.6. Effect of ultraviolet intensity on photocatalyst removal efficiency
The effect of UV intensity on the photocatalytic removal efficiency was studied under specified conditions (UV intensity 172, 408, and 505 W/m2, optimum pH, optimum concentration of nanoparticles, doped nanoparticles with optimal percentage of tungsten oxide with following operating parameters).
The results in showed that the process efficiency increased significantly with an increase in UV intensity. When only one lamp was used at UV intensity of 172 W/m2, the removal efficiency was 27%. But, with increasing the number of UV lamps with 505 W/m2, the process efficiency increased up to 78%. In fact, an increase in UV radiation intensity can enhance the production of hydroxyl radicals and therefore the photocatalytic decomposition rate will be intensified. Similar results have been reported by other researchers regarding the positive impact of increasing the UV radiation intensity on the removal efficiency [Citation48]. In the study by Tsu-Feng et al. [Citation49], the photocatalytic degradation of the parathion in aqueous TiO2 dispersion was investigated and the effect of hydrogen peroxide and light intensity showed that a rise in the light intensity of the lamp was due to the destruction of the parathion; so that the intensity of light reached a quantum efficiency from 100 W to 450 W. Furthermore, the destruction of the parathion was reduced from 0.053–0.006.
Figure 15. Effect of UV intensity on removal percentage (initial 2, 4-D concentration=25 mg/L, pH=7, cross-section=200 cm2, UV intensity=172, 408 and 505 W/m2, nanoparticle suspension concentration 3% and 1% WO3 doped ZnO).
3.7. Effect of contact time on photocatalyst removal efficiency
In order to investigate the influence of contact time on the process efficiency, a sample with optimal solution pH, optimal nanoparticle concentration, doped nanoparticle with optimal percentage of tungsten oxide, and optimal light intensity was exposed to ultraviolet light.
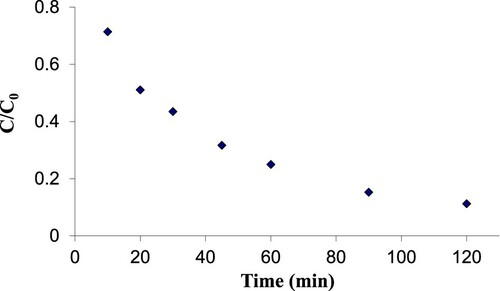
Contact time is one of the most important parameters in the removal of pollutants. shows the effect of contact time on the photocatalytic removal of 2,4-D. At pH=7, initial pollutant concentration was 25 mg/L, and the cross-section of the glass plate was 200 cm2, the process efficiency increased with increasing contact time at intervals of 10, 20, 30, 45, 60, and 90 min. It should be pointed that the removal efficiency remained unchanged after 120 min. This phenomenon can be due to the intermittently reduced pesticide concentration and an increase in the produced free radicals with rising contact time; as a result, pesticide metabolites are oxidised. Moreover, the time can be different depending on the chemical structure and the stability of the pesticides [Citation13]. Sikarwar and Jain [Citation50] reported that a rise in contact time caused the removal efficiency to increase and after 90 min the maximum efficiency obtained was 95.4%.
Figure 16. Effect of contact time on removal percentage (initial 2, 4-D concentration=25 mg/L, pH=7; cross-section=200 cm2, UV intensity=505W/m2, nanoparticle suspension concentration 3% and 1% WO3 doped ZnO).
3.8. Synergic effect of UV and WO3 doped ZnO on UV/ WO3 doped ZnO photocatalytic system
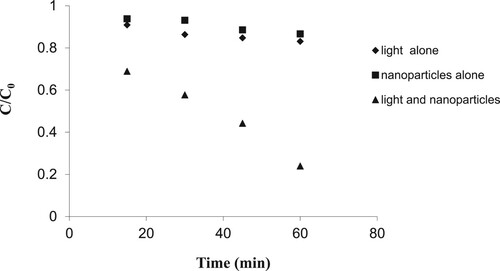
In order to make sure that the photocatalytic process has taken place and the 2,4-D removed is not absorbed, the experiments were performed under the following operating conditions: in the presence of ultraviolet alone, 1% WO3 doped ZnO nanoparticles alone, and both ultraviolet light and nanoparticles together.
depicts the results of 2,4-D degradation by the various systems. It was found that the system of UV alone and ZnO alone could not remove 2,4-D at any significant level. The UV/ WO3 doped ZnO system removed 2,4-D effectively with 0.239 C/C0 within 60 min. The reason for the enhanced removal of 2,4-D in the UV/ WO3 doped ZnO system may be due to the collision of light-emitting photons with UV, the electrons of the semiconductor power layer increasing the energy of these electrons. Therefore, a conductive tape transmission in terms of energy is higher than the film capacity, which may result in the emergence of positive cavities and negatively charge electrons that are spaced apart and therefore can initiate a reaction [Citation51].
Figure 17. Effect of UV and WO3 doped ZnO on UV/ WO3 doped ZnO on removal percentage (initial 2, 4-D concentration=25 mg/L, pH = 7, cross-section=200 cm2, UV intensity=505 W/m2, nanoparticle suspension concentration=3% and 1% WO3 doped ZnO).
3.9. Measurement of residual organic materials in the process
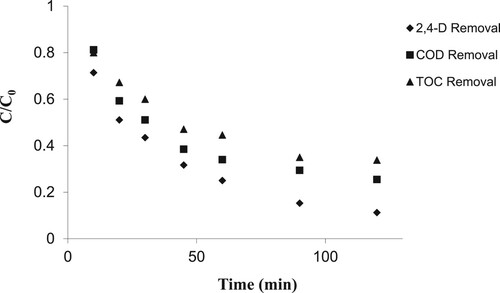
In order to investigate the mineralisation rate of organic materials during the photocatalytic removal of 2,4-D pesticide, a few sample were analysed under the optimal conditions. Sampling was performed at intervals of 10, 20, 30, 45, 60, 90, and 120 min, and then the removal percentage of the pesticide was determined. Moreover, in these samples, the removal percentages of COD and TOC were measured. shows 2,4-D removal from aqueous medium. It should be noted that, under constant conditions, the removal efficiency of COD and TOC was lower than that of the studied pesticide. TOC results indicated that residual organic matter in the pollutant decreased over time. In the beginning of the process, the reduction of organic materials was severe, and then decreased. The findings also indicated that organic matter was removed effectively illustrating that mineralisation of organic materials had occurred. Assuming that in oxidation reactions with OH radicals, no stable toxic intermediate products are formed. Commonly, pesticides are oxidised to CO2; however, carboxylate anions such as formates, acetates or oxalates are formed and these are intermediate, which are non-toxic products [Citation52]. In a study by Wang et al. [Citation53], similar results were reported on diazinon removal using the electro-Fenton process and also in another study on diazinon [Citation54] using the same catalyst as in the present study.
Figure 18. 2,4-D, COD and TOC removal in photocatalytic process of 2,4-D removal (initial 2, 4-D concentration=25 mg/L, pH=7, cross-section=200 cm2, UV intensity=505 W/m2, nanoparticle suspension concentration 3% and 1% WO3 doped ZnO).
4. Conclusion
In the present study, the photocatalytic destruction of 2,4-D by WO3 doped ZnO nanoparticles from water was studied. The characteristics of the nanoparticles were determined using XRD, FTIR and SEM analyses. The results showed that adding tungsten metal oxide to the zinc oxide nanoparticles could cause an increase in photocatalytic activity and a change in energy gap. Moreover, the results demonstrated that a pH value of 7 was optimal value, in which the maximum efficiency was observed. The efficiency decreased under acidic and alkaline conditions. In addition, a rise in other parameters such as nanoparticle dosage, light intensity, and contact time increased the removal process efficiency. However, the process efficiency declined with increasing initial pollutant concentration. Besides, the results of COD and TOC tests showed that the residual of organic matter was effectively removed indicating the successful mineralisation of organic materials. This finding is considered as one of the most important advantages of advanced oxidation processes. The results of this investigation showed that the application of integrated WO3 doped ZnO /UV as an advanced oxidation method has a suitable efficiency for removing 2,4-D from water resources.
Supplementary_Information.docx
Download MS Word (27.8 KB)Acknowledgements
This research was extracted from the research dissertation work of the first author. The authors acknowledge the support of this work by Environmental Health Research Center, Research Institute for Health Development, Kurdistan University of Medical Sciences, Sanandaj, Iran.
Disclosure statement
No potential conflict of interest was reported by the author(s).
Related Research Data
References
- Salman JM, Al-Saad K. Adsorption of 2, 4-Dichlorophenoxyacetic acid onto date seeds activated carbon: Equilibrium, kinetic and thermodynamic studies. Int J Chem Sci. 2012;10:677, 2012;690.
- Firestone JA, Smith-Weller T, Franklin G, et al. Pesticides and risk of Parkinson disease: a population-based case-control study. Arch Neurol. 2005;62:91–95.
- Abdennouri M, Elhalil A, Farnane M, et al. Photocatalytic degradation of 2, 4-D and 2, 4-DP herbicides on Pt/TiO2 nanoparticles. J Saudi Chem Soc. 2015;19:485–493.
- Bazrafshan E, Mostafapour FK, Faridi H, et al. Removal of 2, 4-dichlorophenoxyacetic acid (2, 4-D) from aqueous environments using single-walled carbon nanotubes. Health Scope. 2013;2:39–46.
- Samadi MT, Khodadadi M, Rahmani AR, et al. Comparison of the efficiency of simultaneous application of UV/O3 for the removal of organophosphorus and carbamat pesticides in aqueous solutions. Water Wastewater. 2010;73:69–75.
- Mansoury M, Godini H, Shams Khorramabadi G. Photocatalytic removal of natural organic matter from aqueous solutions using zinc oxide nanoparticles immobilized on glass. Iran J Health Environ. 2015;8:181–190.
- Magri A, Haith DA. Pesticide decay in turf: a review of processes and experimental data. J Environ Qual. 2009;38:4–12.
- Shahmoradi B, Maleki A, Byrappa K. Removal of disperse Orange 25 using in situ surface-modified iron-doped TiO2 nanoparticles. Desalin Water Treat. 2015;53:3615–3622.
- Kirupavasame E, Raj GAG. Photocatalytic degradation of amido black-10B catalyzed by carbon doped TiO2 Photocatalyst. 2011.
- Daneshvar N, Aber S, Hosseinzadeh F. Study of CI acid orange 7 removal in contaminated water by photo oxidation processes. Global Nest J. 2008;10:16–23.
- Stasinakis A. Use of selected advanced oxidation processes (AOPs) for wastewater treatment—a mini review. Global Nest J. 2008;10:376–385.
- Maleki A, Safari M, Shahmoradi B, et al. Photocatalytic degradation of humic substances in aqueous solution using Cu-doped ZnO nanoparticles under natural sunlight irradiation. Environ Sci Pollut Res. 2015;22:16875–16880.
- Abo-Farha S. Photocatalytic degradation of monoazo and diazo dyes in wastewater on nanometer-sized TiO2. J Am Sci. 2010;6:130–142.
- Jonidi Jafari A, Rezae Kalantari R, Gholami M, et al. Photocatalytic removal of aniline from synthetic wastewater using ZnO nanoparticle under ultraviolet irradiation. Iran J Health Environ. 2012;5:167–178.
- Shahmoradi B, Ibrahim I, Namratha K, et al. Surface modification of indium doped ZnO hybrid nanoparticles with n-butylamine. Int J Chem Eng Res. 2010;2:107–117.
- Ngom B, Mpahane T, Manyala N, et al. Structural and optical properties of nano-structured tungsten-doped ZnO thin films grown by pulsed laser deposition. Appl Surf Sci. 2009;255:4153–4158.
- Mousavand T, Ohara S, Umetsu M, et al. Hydrothermal synthesis and in situ surface modification of boehmite nanoparticles in supercritical water. J Supercrit Fluids. 2007;40:397–401.
- Dresselhaus MS, Dresselhaus G, Saito R, et al. Raman spectroscopy of carbon nanotubes. Phys Rep. 2005;409:47–99.
- Behnajady M, Modirshahla N, Daneshvar N, et al. Photocatalytic degradation of CI acid red 27 by immobilized ZnO on glass plates in continuous-mode. J Hazard Mater. 2007;140:257–263.
- Rodrigues BN, Almeida FS. Guia de herbicidas. Grafmarke. 5th ed. Londrina: PR; 2005.
- Galindo-Hernández F, Gómez R. Degradation of the herbicide 2, 4-dichlorophenoxyacetic acid over TiO2–CeO2 sol–gel photocatalysts: effect of the annealing temperature on the photoactivity. J Photochem Photobiol A. 2011;217:383–388.
- Qamar M, Muneer M. A comparative photocatalytic activity of titanium dioxide and zinc oxide by investigating the degradation of vanillin. Desalination. 2009;249:535–540.
- Shahmoradi B, Namratha K, Byrappa K, et al. Enhancement of the photocatalytic activity of modified ZnO nanoparticles with manganese additive. Res Chem Intermed. 2011;37:329–340.
- Behnajady MA, Modirshahla N, Mirzamohammady M, et al. Increasing photoactivity of titanium dioxide immobilized on glass plate with optimization of heat attachment method parameters. J Hazard Mater. 2008;160:508–513.
- Sowa H, Ahsbahs H. High-pressure X-ray investigation of zincite ZnO single crystals using diamond anvils with an improved shape. J Appl Crystallogr. 2006;39:169–175.
- Kathirvel P, Manoharan D, Mohan S, et al. Spectral investigations of chemical bath deposited zinc oxide thin films–ammonia gas sensor. J Optoelectron Biomed Mater. 2009;1:25–33.
- Mojdi M, Hosein Khani P. Synthesis and optical characterization of ZnO and ZnO: Mn nanoparticles. J Iran Appl Phys. 2012;1:53–67.
- Zimmer C, Wright S, Engelhardt R, et al. Tumor cell endocytosis imaging facilitates delineation of the glioma–brain interface. Exp Neurol. 1997;143:61–69.
- Kwon YJ, Kim KH, Lim CS, et al. Characterization of ZnO nanopowders by the polymerized complex method via an organochemical route. J Ceram Process Res. 2002;3:146–149.
- Mote VD, Huse VR, Dole BN. Synthesis and Characterization of Cr Doped ZnO Nanocrystals. 2012.
- Kumbhakar P, Singh D, Tiwary C, et al. Chemical synthesis and visible photoluminescence emission from monodispersed ZnO nanoparticles. Chalcogenide Lett. 2008;5:387–394.
- Wang Y, Lau S, Zhang X, et al. Observations of nitrogen-related photoluminescence bands from nitrogen-doped ZnO films. J Cryst Growth. 2003;252:265–269.
- Smoluchowski M. Handbuch der Elektrizität und des Magnetismus. Band II. Leipzig: Barth-Verlag; 1921.
- Abdollahi Y, Abdullah AH, Zainal Z, et al. Synthesis and characterization of manganese doped ZnO nanoparticles. Int J Basic Appl Sci. 2011;11:62–69.
- Mahmoodi NM, Arami M, Limaee NY, et al. Decolorization and aromatic ring degradation kinetics of direct Red 80 by UV oxidation in the presence of hydrogen peroxide utilizing TiO2 as a photocatalyst. Chem Eng J. 2005;112:191–196.
- Maleki A, Shahmoradi B. Solar degradation of direct blue 71 using surface modified iron doped ZnO hybrid nanomaterials. Water Sci Technol. 2012;65:1923–1928.
- Kidak R, Ince N. Catalysis of advanced oxidation reactions by ultrasound: a case study with phenol. J Hazard Mater. 2007;146:630–635.
- Ghaneian M, Salmani M, Ehrampoush M, et al. Application of the photocatalytic process of Ag-ZnO / UV-C for the degradation of 2,4-Dichlorophenoxyacetic acid In aqueous Aolutions. Tolooebehdasht. 2016;14:227–235.
- Pardeshi S, Patil A. Effect of morphology and crystallite size on solar photocatalytic activity of zinc oxide synthesized by solution free mechanochemical method. J Mol Catal A: Chem. 2009;308:32–40.
- Rahman AM, Qamar M, Muneer M, et al. Semiconductor mediated photocatalysed degradation of a pesticide derivative, acephate in aqueous suspensions of titanium dioxide. J Adv Oxid Technol. 2006;9:103–109.
- Parida K, Dash S, Das D. Physico-chemical characterization and photocatalytic activity of zinc oxide prepared by various methods. J Colloid Interface Sci. 2006;298:787–793.
- Phuong NM, Chu NC, Van Thuan D, et al. Novel removal of diazinon pesticide by adsorption and photocatalytic degradation of visible light-driven Fe-TiO2/bent-Fe photocatalyst. J Chem. 2019;2019:1–7.
- Ai M, Qin W, Xia T, et al. Photocatalytic degradation of 2, 4-Dichlorophenol by TiO2 intercalated Talc nanocomposite. Int J Photoenergy. 2019;2019; doi: https://doi.org/10.1155/2019/1540271
- Fan G, Zhan J, Luo J, et al. Photocatalytic degradation of naproxen by a H2O2-modified titanate nanomaterial under visible light irradiation. Catal Sci Technol. 2019;9:4614–4628.
- Bian X, Chen J, Ji R. Degradation of 2, 4-dichlorophenoxyacetic acid (2, 4-D) by novel photocatalytic material of tourmaline-coated TiO2 nanoparticles: kinetic study and model. Materials. 2013;6:1530–1542.
- Lee SC, Hasan N, Lintang HO, et al. Photocatalytic removal of 2, 4-dichlorophenoxyacetic acid herbicide on copper oxide/titanium dioxide prepared by co-precipitation method. Publisher; 2016.
- Terashima Y, Ozaki H, Giri R, et al. Photocatalytic oxidation of low concentration 2, 4-D solution with new TiO2 fiber catalyst in a continuous flow reactor. Water Sci Technol. 2006;54:55–63.
- Khan A, Husain Q. Potential of immobilized bitter gourd peroxidases in the decolorization and removal of textile dyes from polluted wastewater and dyeing effluent. Chemosphere. 2005;60:291–301.
- Tsu-feng C, Doong R-a, Wen-gang L. Photocatalytic degradation of parathion in aqueous TiO2 dispersion: the effect of hydrogen peroxide and light intensity. Water Sci Technol. 1998;37:187.
- Sikarwar S, Jain R. Nano photo catalytic degradation of the pharmaceutical agent balsalazide under UV slurry photo reactor. Water Air Soil Pollut. 2015;226:277.
- Mahyar A, Amani-Ghadim A. Influence of solvent type on the characteristics and photocatalytic activity of TiO2 nanoparticles prepared by the sol–gel method. Micro Nano Lett. 2011;6:244–248.
- Barbusiński K, Filipek K. Use of Fenton’s reagent for removal of pesticides from industrial wastewater. Pol J Environ Stud. 2001;10:207–212.
- Wang J, Tafen DN, Lewis JP, et al. Origin of photocatalytic activity of nitrogen-doped TiO2 nanobelts. J Am Chem Soc. 2009;131:12290–12297.
- Maleki A, Moradi F, Shahmoradi B, et al. The photocatalytic removal of diazinon from aqueous solutions using tungsten oxide doped zinc oxide nanoparticles immobilized on glass substrate. J Mol Liq. 2020;297:111918. doi: https://doi.org/10.1016/j.molliq.2019.111918