
ABSTRACT
Anaerobic ponds have the potential to contribute to low carbon wastewater treatment, however are currently restricted by long hydraulic residence time (HRT) which leads to large land requirements. A two-stage anaerobic pond (SAP) design was trialled against a single-stage control (CAP) over four HRTs down to 0.5 days, to determine the lowest HRT at which the ponds could operate effectively. No statistical differences were observed in particulate removal between the ponds over all four HRTs, suggesting solids loading is not a critical factor in AP design. Significantly higher biogas production rates were observed in the SAP than the CAP at 1.5 d and 1.0 d HRT, and microbial community profiling suggests the two-stage design may be facilitating spatial separation of the anaerobic digestion process along reactor length. Hydrogenotrophic methanogensis dominated over aceticlastic, with acetate oxidisation a likely degradation pathway. Experimental tracer studies were compared to CFD simulations, with the SAP showing greater hydraulic efficiency, and differences more pronounced at shorter HRTs. Greater flow recirculation between baffles was observed in CFD velocity profiles, demonstrating baffles can dissipate preferential flow patterns and increase effective pond volume, especially at high flow rates. The study demonstrates the potential of APs to be operated at shorter HRTs in psychrophilic conditions, presenting an opportunity for use as pre-treatments (in place of septic tanks) and primary treatment for full wastewater flows. Two-stage designs should be investigated to separate the stages of the anaerobic digestion process by creating preferential conditions along the pond length.
GRAPHICAL ABSTRACT
1. Introduction
The traditional approach to designing anaerobic ponds (APs) is currently being challenged, as the opportunities for shorter hydraulic retention times (HRTs) [Citation1], the use of baffling [Citation1–3], and the covering of APs for biogas collection [Citation4–7] are being realised. Temperature-dependent design organic loading rates were developed through empirical observation, ranging from 100 gBOD m−3 d−1 for ambient temperatures < 10°C, to 350 gBOD m−3 d−1 for temperatures >25°C. The design loading rates were deliberately conservative, with the lower limit specified to ensure anaerobic conditions and the upper limit capped to minimise odour nuisance and the need for desludging [Citation8]. In practice, even these conservative guidelines are rarely met, with odour nuisance cited as the most common reason for AP underloading [Citation9–12]. Covering of APs not only eliminates odour but reduces greenhouse gas emissions [Citation6], and the captured biogas can be used for energy generation thus providing an opportunity to reconsider appropriate loading rates based on the positive attributes of the technology rather than negating the negative ones [Citation13,Citation14]. For instance, as the potential of APs for energy-positive primary treatment has been recognised [Citation15], design focus is changing from primary sedimentation to more complete organic breakdown, with particular emphasis on identifying appropriate design geometry to maximise performance and reduce process scale [Citation2,Citation16].
Currently, the costs associated with the extensive land requirements are the largest single barrier to uptake of APs [Citation17–19], with hydraulic retention times (HRTs) ranging from 1 and 4 days but most commonly between 2 and 3 days [Citation8]. Reduction of land requirement, through shorter HRTs, improves the economic viability of APs whilst also offering process improvements. Higher organic loading rates provide more substrate for microbial growth, whilst the increased flow rates lead to greater mixing, reducing hydraulic dead space in the pond and facilitating biomass/substrate contact [Citation1]. However, shorter HRTs increase the potential for biomass washout, which must be avoided in order to allow sufficient solids retention time (SRT) within the process for degradation. For instance, Craggs et al. [Citation20] suggested that the methane yield (and hence solids degradation) in low-temperature APs could equal those of mesophilic ADs, provided solids retention time were doubled to compensate for the lower kinetic rate. Therefore, separation of SRT from HRT is vital, to ensure sufficient retention and degradation time for particulate carbon, whilst contact between the retained biomass and the liquid layer must also be facilitated to target soluble carbon fractions that are an essential step in methanogenesis [Citation21,Citation22].
The separation of HRT and SRT can be facilitated through the use of baffling. Incorporation of baffles into passive treatment systems has been found to improve hydrodynamic performance and increase mixing [Citation1,Citation23]. Horizontal baffles, which produce a lane system creating ‘side to side’ flow, reduce hydraulic short circuiting and therefore promote sedimentation and particulate retention [Citation24]. In contrast, vertical baffles create ‘up-and-under’ flow, which provides greater biomass contact and has been demonstrated to separate the stages of anaerobic digestion along the reactor length. Consequently, in anaerobic baffled reactors (ABRs), acidogenesis has been observed in the compartments closest to the inlet and methanogenesis further down the reactor [Citation25], increasing acidogenic and methanogenic activity by up to a factor of four [Citation26]. The incorporation of baffles into anaerobic reactors has led to the development of high-rate anaerobic ponds with 0.5 d HRTs [Citation1], and ABRs with typical HRT < 1 d, and as low as 1 h [Citation26].
Recently, further understanding of high-rate upflow anaerobic sludge blanket reactors (UASBs) has identified that benefit can be delivered through inclusion of an anaerobic pre-treatment stage, in order to decrease solids loading onto the UASB and provide a more acidified substrate [Citation27,Citation28]. This has led to the development of two-stage high-rate anaerobic reactors, where downstream UASBs have been preceded by septic tanks [Citation29], anaerobic filters [Citation30], and lower-rate UASBs [Citation31,Citation32]. Whilst it has been identified that, especially at low temperatures, two-stage anaerobic designs are essential for both maximising solids retention and degradation in the first stage, and providing preferential substrate to the second stage [Citation21,Citation28], two-stage designs have not been applied to low-rate technologies to date. The context relates to remote/rural; communities that are commonly served by septic tanks and where a short HRT anaerobic pond could offer real advantages in terms of treatment and desuldging frequency. To illustrate, Scottish Water currently operate over 1250 spetic tanks with 100 of these treating population equivalents of over 1000 PE. The septic tanks operate at HRTs of around 0.5–1.0 days and require desludging every 6 months to 2 years which incurs significant costs and disruption to the local community. Two-stage anaerobic ponds have been posited as a future alternative but must be able to operate at short HRTs to be considered economically viable [Citation33].
Accordingly, the current study reports on the operation of a pilot-scale two-stage anaerobic pond (SAP) over four HRTs, decreasing from 2.3 days to 0.5 days, to assess the potential for two-stage passive anaerobic treatment at higher loading rates than traditionally applied. The specific objectives of the study were:
Compare the performance of a staged AP to a single control AP over four HRT to determine differences in key indicators: hydrodynamic efficiency and flow characteristics; removal efficiency, specifically of carbon fractions; sludge accumulation and where it is retained; biogas production quantity and quality
Identify the effect of decreasing HRT on the APs for the above indicators, to determine optimal loading rates for APs at low temperature and its impact on AP operation for effluent quality, sludge management and energy generation
2. Materials and methods
2.1. Experimental reactor design
The anaerobic reactors, designed as pilot-scale ponds, were constructed of 12 mm uPVC sheeting and sealed with PVC hot welding. The internal dimensions were 1.5 m × 0.5 m × 0.25 m, giving hydraulic volumes of 188 L. A 3:1 Length:Width ratio was used in accordance with recommended AP design [Citation8]. The SAP was created by connecting two single-stage ponds in series, with a horizontally baffled anaerobic pond (HBAP) located upstream of a vertically baffled anaerobic pond (VBAP, designed with ABR principles but under AP loading conditions) with configurations previously reported [Citation34]. A control pond (CAP) was constructed with the same specifications as the HBAP. The reactors were initially seeded with 7% by volume anaerobic sludge (volatile solids, VS = 36 g L−1) from a previous study [Citation35], filled with crude wastewater from the Cranfield University sewage treatment works and left in batch for one day. The reactors were operated for three months at each of four HRTs, with a 2.3 d HRT applied at startup, then subsequent HRTs of 1.5, 1.0, and 0.5 d.
2.2. Analytical methods
Influent and effluent were analysed three times a week in duplicate, whilst liquid samples were also collected and analysed once a month from side ports in each of the chambers created by the baffles (). Ambient and liquid temperatures were recorded at the time of sampling using a digital probe thermometer, with a sensitivity of ±0.05°C. Samples were analysed for BOD5, COD, TSS and VSS according to standard methods [Citation36]. Samples for sCOD were filtered through a 1.2 μm glass fibre filter (Whatman, Maidstone, UK). Particulate COD fraction (pCOD) was calculated by subtracting sCOD from tCOD. Volatile fatty acids (VFA) and biogas volumes and compositions were measured with previously described methods [Citation34]. Sludge depth was measured at the end of each loading rate on a grid of 0.1 m × 0.1 m using a perspex tube graduated at 1 mm intervals. ANOVA tests were performed on all data sets to determine statistical significance to 95% confidence. Tracer studies and specific methanogenic activity (SMA) tests were carried out according to previously described methods [Citation34].
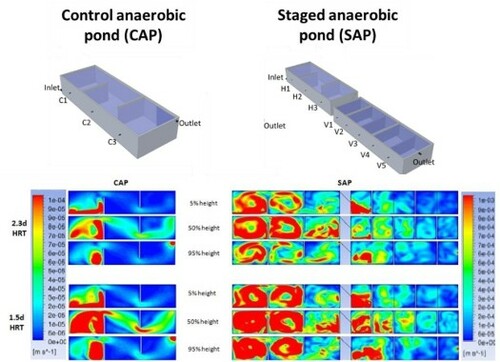
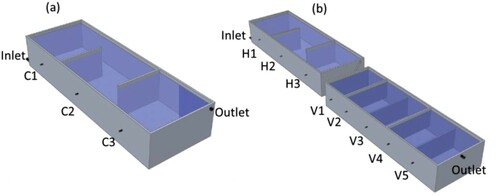
Figure 1. Layouts of the ponds used in the study, indicating sampling points at the inlets and outlets, and in each baffle chamber in the (a) control anaerobic pond and (b) staged anaerobic pond, with horizontally (H) baffled stage followed by vertically (V) baffled stage.
2.3. Microbial community analysis
Sludge samples from different chambers of the reactors were taken at the end of the trial. Biomass (10 g) was collected in sterile tubes and stored at −20°C for their processing. A fully automated nucleic acid extractor employing magnetic bead technology (Maxwell 16 DNA Purification Kits; Promega) was used to extract and purify genomic DNA from the samples following the manufactureŕs instructions. The DNA was stored at −20°C.
Quantitative real-time polymerase chain reaction (qPCR) was used to quantify 16S rRNA gene of three methanogenic orders, Methanomicrobiales, Methanobacteriales and Methanosarcinales, and two families of the Methanosarcinales order, Methanosaetaceae and Methanosarcinaceae. All qPCR reactions were performed using 20 µL reaction capillary tubes with the LightCycler 480 Probe Master (Roche Diagnostics). The Archaeal 16S rRNA gene from each sample was amplified using the primers Arch109F (5′-ACKGCTCAGTAACACGT-3′) (6-FAM fluorescent labelled) [Citation37] and Arch958R (5′-AGGAATTGGCGGGGGAGCAC-3′) [Citation38]. Full details of the experimental procedure are described in Supporting Information S1.
2.4. CFD modelling
Three-dimensional single-phase CFD simulations were performed using the commercial software FLUENT v14.0.0 (ANSYS) using geometries and methods previously reported [Citation34].
3. Results
3.1. Hydrodynamic comparison using experimental tracer studies and computational fluid dynamics
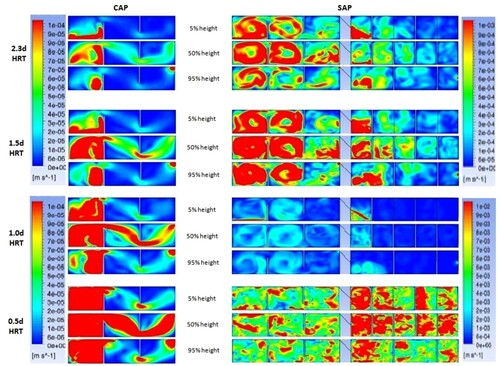
In both the experimental tracer studies and CFD simulations, lower dead space volumes were found in the SAP compared to the CAP at all HRTs. The differences between AP configurations became more pronounced with each step decrease in HRT (), indicating greater utilisation of reactor volume in the SAP, especially at shorter HRT. Overall, the CFD trends suggest the general flow characteristics of the SAP tending towards plug flow to a greater extent than the CAP. This is evidenced by lower dispersion numbers and higher N (tanks in series) values, with the differences between the reactors increasing with decreasing HRT. Comparison between experimental and CFD profiles revealed differences with respect to lower dead space volumes and lower S (short-circuiting) quotients for the CAP at short HRTs. The differences are attributed to the interaction between the tracer and the retained sludge in the experimental measurements.
Table 1. Hydrodynamic data calculated for a control anaerobic pond (CAP) and staged anaerobic pond (SAP), over four hydraulic loading rates. Data are shown for experimental data collected from tracer studies and for computational fluid dynamics (CFD) simulations.
The enhanced hydrodynamic profiles observed in the SAP are attributed to the baffles generating a greater degree of recirculation. As such, flow is forced back into the chamber by the small aperture created by the baffles, consequently utilising more of the chamber and thus reducing short circuiting (). Recirculation is most pronounced in the front chamber of the reactors, where velocities are highest due to the inlet jetting effect. Velocities decrease through subsequent chambers, reducing recirculation and creating preferential flow patterns, most evident in the CAP. In the first stage of the SAP, velocities in the second chamber are high enough to cause noticeable recirculation (), improving the mixing profile and reducing dead space whilst also creating an overall plug flow effect through the reactor.
Figure 2. CFD generated velocity profiles for the control anaerobic pond (CAP), and the staged anaerobic pond (SAP).
3.2. Removal efficiencies over four HRTs from the staged and control anaerobic ponds
No significant difference between reactors was observed in relation to TSS or pCOD removal over all HRTs to a 95% confidence level. In comparison, TSS removal rates were found to increase in both ponds with decreasing HRT from 2.3 to 1.0 days. However, at a HRT of 0.5 days, the TSS removal increased in the SAP but reduced in the CAP. This suggests both reactors were operating beneath their maximum solids loading limits until 1.0 d HRT, and the SAP could prevent solids washout even at the highest loading applied. In contrast, mean sCOD removals were statistically different, and were lowest at 1.5 d HRT in both reactors at −40% and −44% for the CAP and SAP, respectively, with the highest removal observed at 0.5 d HRT, CAP −5% and SAP 2% ().
Figure 3. Removal efficiencies from the pilot scale trials on a horizontally baffled anaerobic pond as a control (CAP) and a staged anaerobic pond (SAP). Efficiencies shown for Total and Volatile Suspended Solids, total, particulate (>1.2 µm) and soluble (<1.2 µm) COD, volatile fatty acids, and acetic acid individually from the compound VFA measurement.
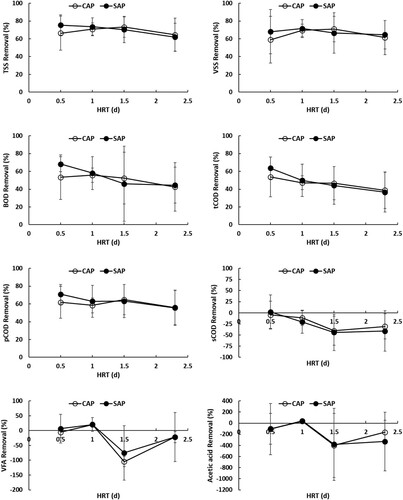
However, these removal efficiencies correlate with the temperature profile in the reactors, with the highest mean effluent temperatures recorded at 1.5 d HRT (CAP 17.1°C; SAP 17.0°C) and the coldest temperatures observed during the 0.5 d HRT period (CAP 9.3°C; SAP 9.1°C). Removal efficiencies of VFA were similar to the sCOD trend, with the largest addition of VFA to the effluent occurring at 1.5 d HRT whilst removal efficiency increased in the shortest HRT period (). The negative removal, or generation of sCOD and VFA, suggests particulate COD breakdown to soluble components which are then not degraded further before leaving the reactors.
3.3. Sludge accumulation
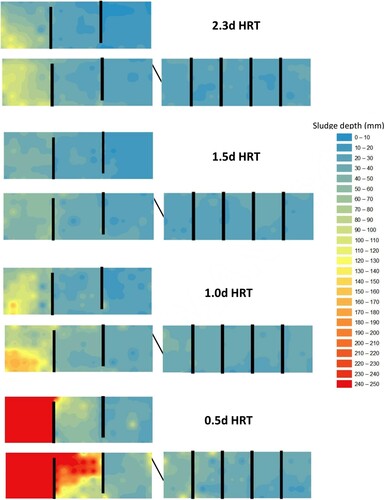
Solids accumulation rate within the reactors was found to be more dependent on temperature than loading. In both reactors, per capita normalised sludge accumulation rates were comparable at three of the HRTs studied. In the CAP, accumulation rates over the 2.3, 1.0 and 0.5 d HRT periods were 0.04 m3 PE−1 y−1 (mean effluent temperature, Teff = 10.5°C), 0.04 m3 PE−1 y−1 (Teff = 13.9°C) and 0.06 m3 PE−1 y−1 (Teff = 9.3°C), respectively. In comparison, accumulation rates in the SAP were 0.06 m3 PE−1 y−1 (Teff = 10.5°C), 0.04 m3 PE−1 y−1 (Teff = 13.7°C) and 0.06 m3 PE−1 y−1 (Teff = 9.1°C) calculated for the same periods, respectively. However, during the warmest HRT period, 1.5 d, a reduction in total sludge volume was recorded in both reactors, with an accumulation rate of −0.02 m3 PE−1 y−1 for both reactors (CAP Teff = 17.1°C, SAP Teff = 17.0°C). Whilst the normalised accumulation rates were comparable across the decreasing HRT periods at low temperature, the higher loadings applied are related to higher absolute sludge volumes within the reactors. To illustrate, in the SAP the accumulation rate of 0.06 m3 PE−1 y−1 during the 2.3 d HRT period related to an accumulated sludge volume of 16.11 L, or 3% of total pond volume, whilst the 0.04 m3 PE−1 y−1 accumulation rate over the 0.5 d HRT period related to an accumulated sludge volume of 73.11 L, or 14% of total reactor volume. Solids were mostly deposited in the front chamber of each reactor (), with 63%, 49%, 30% and 73% of total CAP sludge volume found in this chamber after the 2.3, 1.5, 1.0 and 0.5 d HRT periods, respectively, whilst this chamber comprised only 33% of total reactor volume. In the SAP, sludge accumulation in the front chamber contained 39%, 28%, 37%, and 43% of total sludge volume, despite this chamber comprising only 17% of total reactor volume.
Figure 4. Sludge accumulation maps in the control anaerobic pond (CAP) and staged anaerobic pond (SAP) at the end of each of the four hydraulic retention times applied
3.4. Biogas methane production and specific methanogenic activity of sludge
Rapid start-up of methane biogas production was observed in both reactors, with mean flow normalised production of 3.86 LCH4 m−3 wastewater treated (WWT) in the CAP and 5.40 LCH4 m−3WWT in the SAP during the first operational period, at 2.3 d HRT. The highest mean biogas production occurred during the second period, 1.5 d HRT, with 5.40 LCH4 m−3WWT in the CAP and 8.82 LCH4 m−3WWT in the SAP, which coincided with the highest mean effluent temperatures (). The volumetric biogas production rates at this HRT were 3.6 LCH4 m−3 d−1 for the CAP and 5.9 LCH4 m−3 d−1 for the SAP.
Figure 5. Mean flow-normalised biogas methane production in the control (CAP) and staged (SAP) anaerobic ponds.
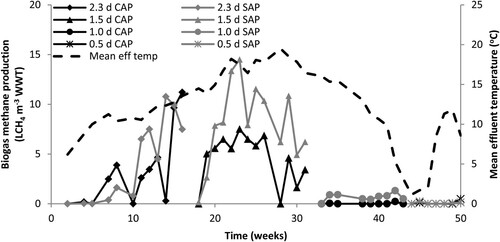
With decreases in both temperature and HRT, large reductions in biogas production were observed for the final two operational periods, with mean production rates of 0.05 LCH4 m−3WWT and 0.11 LCH4 m−3WWT in the CAP and 0.74 LCH4 m−3WWT and 0.08 LCH4 m−3WWT in the SAP for the 1.0 and 0.5 d HRT periods, respectively. No statistical difference was observed in biogas production between the two reactors at 2.3 d HRT, nor at 0.5 HRT due to low production rates in both reactors. However, at 1.5 and 1.0 d HRT, biogas production in the SAP was significantly higher than the CAP to a 95% confidence level.
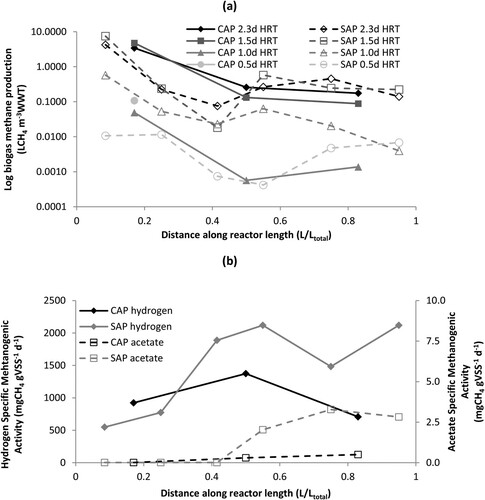
The highest measured production rate was in the chamber closest to the inlet for both reactors at all four loading rates (), with 95 and 84% of total biogas CH4 recorded in this chamber for the CAP and SAP, respectively. In the CAP, production rates decreased in subsequent chambers at 2.5 and 1.5 d HRT, although at 1.0 d an increase was evident in the final chamber, suggesting production at the outlet may have been increasing respectively to the centre of the reactor. Due to the low temperature during the 0.5 d HRT, no biogas was recorded in either chamber 2 or 3 for this final loading rate. In the SAP, biogas production decreased throughout the first stage reactor, but increased in the first chamber of the second phase at 2.3, 1.5 and 1.0 d HRTs. To illustrate, mean biogas methane production rates at the outlet of the first stage were 0.08, 0.03 and 0.06 LCH4 m−3 WWT cf. 0.26, 1.05 and 0.17 LCH4 m−3WWT at the inlet of the second stage at 2.3, 1.5, and 1.0 d HRT, respectively. This may be induced by both the jetting effect of the connection pipe between the two stages creating high mixing at the inlet of the second stage, and through a change in microbial community found in the reactors. Specific methanogenic activity tests conducted on sludge at the end of the study period show activity rates were lower at the inlet of both reactors than the subsequent chambers (). Hydrogenotrophic methanogenic activity was found to be over two orders of magnitude greater than aceticlastic activity, with mean hydrogen specific SMA of 1001 mgCH4 gVSS−1 d−1 and 1489 mgCH4 gVSS−1 d−1 recorded in the CAP and SAP, respectively, cf. 0.27 mgCH4 gVSS−1 d−1 and 1.36 mgCH4 gVSS−1 d−1 for acetate specific SMA. Interestingly, acetate specific SMA was over two orders of magnitude higher in the second phase of the SAP than the first, with mean acetate specific SMA of 0.01 mgCH4 gVSS−1 d−1 in the first stage cf. 2.71 mgCH4 gVSS−1 d−1 in the second stage.
Figure 6. Mean flow-normalised biogas methane production (a), and specific methanogenic activity (b), from sludge samples along the length of the control anaerobic pond (CAP) and staged anaerobic pond (SAP) at the end of the study.
3.5. Microbial community profiling of methanogenic orders and families in the sludge
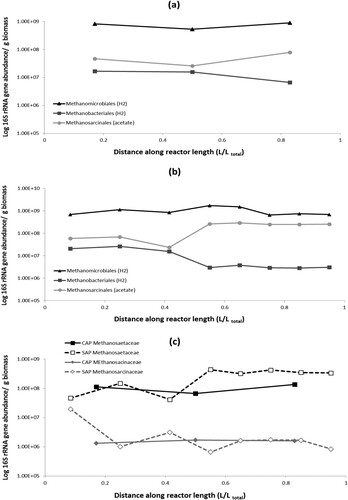
Microbial community profiling of methanogenic archaea in sludge taken at the end of the study found the hydrogenotrophic order Methanomicrobiales dominant, producing a mean of 1.87 × 10⁷ copies from the qPCR process cf. 1.26 × 10⁶ copies of the aceticlastic Methanosarcinales order in the CAP, and 2.51 × 10⁷ copies cf. 4.53 × 10⁶ copies in the SAP (). In addition, another hydrogenotrophic order, Methanobacteriales, was also present with mean 3.25 × 10⁵ copies in the CAP and 2.44 × 10⁵ copies in the SAP, increasing the dominance of hydrogen utilisers. The relative presence of these orders supports the SMA findings of hydrogen pathways dominating the anaerobic digestion process in both reactors. In the SAP, an increase in the Methanosarcinales order from mean 1.27 × 10⁶ copies in the first stage to 6.48 × 10⁶ copies in the second stage, also reflects the increase in acetate-specific SMA found in the second stage at the end of the study. Within the Methanosarcinales order, the Methanosaetaceae family was found to dominate the Methanosarcinaceae family in both reactors, with mean copy numbers 2.61 × 10⁶ Methanosaetaceae cf. 3.86 × 10⁴ Methanosarcinaceae in the CAP and 6.53 × 10⁶ Methanosaetaceae cf. 9.37 × 10⁴ Methanosarcinaceae in SAP (). Interestingly, in the SAP the Methanosarcinales families were found in closest relative abundance in the first chamber, with 1.15 × 10⁶ copies of Methanosaetaceae cf. 4.85 × 10⁵ Methanosarcinaceae, with Methanosaetaceae dominating further along the reactor, particularly in the second stage, with mean 9.28 × 10⁶ copies of Methanosaetaceae cf. 3.26 × 10⁴ Methanosarcinaceae. The dominance of Methanosarcinaceae within the Methansarcinales order has been found to be consistent with low acetate concentrations and indicative of increased acetate oxidation, leading to hydrogenotrophic methanogenesis, rather than aceticlastic pathways [Citation39].
Figure 7. Microbial community qPCR data for three orders of methanogenic archaea, two hydrogenotrophic and one acetoclastic, in the (a) control anaerobic pond (CAP) and (b) staged anaerobic pond (SAP), and (c) two families of the Methanosarcinales order in the CAP and SAP.
4. Discussion
Comparison of the proposed staged AP (SAP) to a conventional design (CAP) revealed the potential of SAPs to enhance both biogas production and overall hydrodynamic efficiency. The latter was seen in terms of less short circuiting with associated less dead space. The enhancements were observed across all HRTs with velocity profiles demonstrating the increased recirculation between baffles [Citation1] leading to greater utilisation of the reactor volume. Solids accumulation reduced the clarity of the impacts congruent with previous studies on unbaffled ponds [Citation40,Citation41]. Further, vertically baffled systems similar to the VBAP, such as ABRs, can be particularly susceptible to channelling [Citation42], as the flow is forced through the sludge layer at every ‘hanging’ baffle, thus optimisation of the baffling arrangement will be critical and as such is one of the key areas for further investigation. The differences in hydrodynamics did not manifest in terms of bulk removal which remained statistically similar for both reactors. This extended to soluble COD removal where improvements in removal were not observed to a statistically significant level. Improvements in gas production, however, were observed in the SAP, with increased SMA and an aceticlastic methanogenic community measured in the second stage suggesting the spatial distribution of anaerobic digestion was starting to occur [Citation26,Citation43]. Furthermore, many of the advantages seen in the SAP over the CAP were more pronounced at the shorter HRTs indicating that the proposed design can provide a route to using APs with smaller footprints more attractive to potential adopters.
Results from the reductions in HRT suggest APs can tolerate higher loadings than currently applied. Decreasing HRT in unbaffled ponds is known to increase short circuiting, however, the results of the CFD simulations suggest that these impacts can be lessened in a baffled system, and advantages can also be gained in reducing hydraulic dead space through the recirculation effect between baffles. As temperature profiles changed over the course of the study, the influence of temperature must be considered when comparing the HRTs applied. The removal of solids has been reported to be independent of operating temperature [Citation44,Citation45], and in this study, a clearer relationship was found with loading rate. Consistent effluent TSS profiles down to 1.0 d HRT in both reactors reinforced the ability of the APs to handle shock loadings, whilst also confirming that solids loading rates are unlikely to be a restricting factor in AP design [Citation35]. However, biological activity was clearly strongly associated with temperature [Citation5,Citation44,Citation46]. Soluble carbon removal efficiency was observed to be more strongly linked with temperature than loading rate during the study, and may be attributed to a reduction in soluble carbon generated in the digestion process [Citation35] rather than improvement of soluble degradation due to biological establishment [Citation43,Citation44]. Sludge accumulation rates were also temperature-dependent, with volume reduction occurring above 17°C as suggested by Papadopoulos et al. [Citation45]. The sludge reduction at warmer temperatures was linked to the highest biogas production rates, and supports previous evidence that APs can store particulate carbon in winter periods to be subsequently degraded in summer [Citation44,Citation45,Citation47]. Therefore, in order to accurately estimate the effect of HRT on sludge accumulation and biogas production, studies must be conducted over an annual cycle. Furthermore, sludge accumulation rates have been found to lower, and biogas production rates increase, with extended AP operation [Citation43,Citation48], and the minimum temperature at which methanogenesis occurs has been found to decrease with AP age as biomass acclimatises [Citation49]. Therefore, it can be posited that these characteristics would improve from the current study over time.
Shorter HRTs can mitigate the largest single problem with AP uptake in reducing the land requirement, and therefore the cost [Citation12,Citation18], and the results from this study suggest that shorter HRTs than currently recommended are feasible. The severe reduction in gas production at 0.5 d HRT is likely to be a cause of the temperature but also the loading, and whilst the sludge accumulation rate per capita was comparable to longer HRTs, the volume of sludge produced at this HRT would likely reduce the advantages APs can bring in reduced sludge handling [Citation35]. To illustrate, whilst sludge accumulation rates in the SAP were 0.06 m3 PE−1 y−1 at both 2.3 and 0.5 d HRT, desludging at 50% volume would lead to a desludge frequency of 3.8 years at 2.3 d HRT, but 0.4 years at 0.5 d HRT. Therefore, extended trials of APs at 1.0 and 1.5 d HRTs are recommended, which would reduce AP volume by two to three times the current recommendations.
5. Conclusions
The work presented has demonstrated the efficacy of anaerobic ponds, even at low temperatures, to operate at shorter HRTs than commonly considered. Further, an HRT of 1 d is seen as a conservative estimate to base future development around. The advantages in hydraulic performance of using a two-stage design were observed predominately at these shorter HRTs and indicates that appropriate baffling arrangement will be critical in future designs. Importantly, management of the degradation of both solids and soluble organics appears to be a temperature issue rather than a hydraulic one. Accordingly, future development needs to consider the use of heat sources, including the utilisation of any produced gas in maintaining higher temperatures. Whilst heating of full wastewater flows would not be practical, targeted heating of the sludge layer could be considered, to extend periods where the temperatures can be around 17°C, where a net overall reduction in solids was observed. The presented results show promise but were based on relatively short-term experiments which will underestimate performance compared to a fully acclimatised system. As such the findings support the idea of development of an alternative to septic tanks that can offer improved treatment and reduced desludging frequencies without requiring excessive land use.
Supplementary_Information_S1.docx
Download MS Word (43.4 KB)Acknowledgements
This work was supported by the Engineering & Physical Sciences Research Council through an industrial CASE studentship. Gavin Collins and Estefania Porca were supported by a European Research Council Starting Grant (3C-BIOTECH 261330).The research in this study formed part of the lead author's PhD thesis on development of anaerobic ponds for domestic wastewater treatment in temperate climates [Citation50].
Disclosure statement
No potential conflict of interest was reported by the author(s).
Additional information
Funding
References
- Peña MR, Mara DD, Piguet JM. Improvement of mixing patterns in pilot-scale anaerobic ponds treating domestic sewage. Water Sci Technol. 2003;48(2):235–242.
- Vega GP, Peña MR, Ramírez C, et al. Application of CFD modelling to study the hydrodynamics of various anaerobic pond configurations. Water Sci Technol. 2003;48(2):163–171. DOI: 10.2166/wst.2003.0111.
- Shilton AN, Harrison J. Development of guidelines for improved hydraulic design of waste stabilisation ponds. Water Sci Technol. 2003;48(2):173–180.
- DeGarie CJ, Crapper T, Howe BM, et al. Floating geomembrane covers for odour control and biogas collection and utilization in municipal lagoons. Water Sci Technol. 2000;42(10–11):291–298. DOI:10.2166/wst.2000.0664.
- Parissopoulos G, Papadopoulos A, Papadopoulos F, et al. Comparative design and performance analysis of three different in configuration waste stabilization ponds pilot units in a Mediterranean-temperate climate. Water Sci Technol. 2003;3(4):193–200.
- Noyola A, Morgan-Sagastume JM, López-Hernández JE. Treatment of biogas produced in anaerobic reactors for domestic wastewater: odor control and energy/resource recovery. Rev Environ Sci Biotechnol. 2006;5(1):93–114. DOI:10.1007/s11157-005-2754-6.
- Shilton AN, Mara DD, Craggs RJ, et al. Solar-powered aeration and disinfection, anaerobic co-digestion, biological CO2 scrubbing and biofuel production: The energy and carbon management opportunities of waste stabilisation ponds. Water Sci Technol. 2008;58(1):253–258. DOI:10.2166/wst.2008.666.
- Mara DD, Pearson HW. Design manual for waste stabilization ponds in Mediterranean countries. 1st ed. Leeds: Lagoon Technology International; 1998.
- Pearson HW, Avery ST, Mills SW, et al. Performance of the phase II Dandora waste stabilisation ponds the largest in Africa: the case for anaerobic ponds. Water Sci Technol. 1996;33(7):91–98. DOI:10.1016/0273-1223(96)89141-4.
- Picot B, Andrianarison T, Gosselin JP, et al. Twenty years’ monitoring of Mèze stabilisation ponds: Part I – removal of organic matter and nutrients. Water Sci Technol. 2005a;51(12):23–31. DOI:10.2166/wst.2005.0419.
- Archer HE, Mara DD. Waste stabilisation ponds developments in New Zealand. Water Sci Technol. 2003;48(2):9–15.
- Alexiou GE, Mara DD. Anaerobic waste stabilization ponds: a low-cost contribution to a sustainable wastewater reuse cycle. Appl Biochem Micro+. 2003;109(1–3):241–252. DOI:10.1385/ABAB:109:1-3:241.
- Hodgson B, Paspaliaris P. Melbourne water’s wastewater treatment lagoons: design modifications to reduce odours and enhance nutrient removal. Water Sci Technol. 1996;33(7):157–164. DOI:10.1016/0273-1223(96)00351-4.
- Park J, Craggs RJ. Biogas production from anaerobic waste stabilisation ponds treating dairy and piggery wastewater in New Zealand. Water Sci Technol. 2007;55(11):257–264. DOI:10.2166/wst.2007.357.
- McAdam EJ, Lüffler D, Martin-Garcia N, et al. Integrating anaerobic processes into wastewater treatment. Water Sci Technol. 2011;63(7):1459–1466. DOI:10.2166/wst.2011.378.
- Agunwamba JC. Effect of the location of the inlet and outlet structures on short-circuiting: experimental investigation. Water Environ Res. 2006;78(6):580–589. DOI:10.2175/106143006X109603.
- Xian-Wen L. Technical economic analysis of stabilization ponds. Water Sci Technol. 1995;31(12):103–110. DOI:10.1016/0273-1223(95)00497-B.
- Agunwamba JC. Effect of tapering on the performance of waste stabilization ponds. Water Res. 2001;35(5):1191–1200. DOI:10.1016/S0043-1354(00)00391-2.
- Dias DFC, Passos RG, Rodrigues VAJ, et al. Performance evaluation of a natural treatment system for small communities, composed of a UASB reactor, maturation ponds (baffled and unbaffled) and a granular rock filter in series. Environ Technol. 2018;39(4):490–502. DOI:10.1080/09593330.2017.1304456.
- Craggs R, Park J, Heubeck S. Methane emissions from anaerobic ponds on a piggery and a dairy farm in New Zealand. Aust J Exp Agric. 2008;48(1–2):142–146. DOI:10.1071/EA07255.
- Lettinga G, Rebac S, Zeeman G. Challenge of psychrophilic anaerobic wastewater treatment. Trends Biotechnol. 2001;19(9):363–370. DOI:10.1016/S0167-7799(01)01701-2.
- Lew B, Tarre S, Beliavski M, et al. Anaerobic degradation pathway and kinetics of domestic wastewater at low temperatures. Bioresource Technol. 2009;100(24):6155–6162. DOI:10.1016/j.biortech.2009.06.073.
- Langenhoff AAM, Stuckey DC. Treatment of dilute wastewater using an anaerobic baffled reactor: effect of low temperature. Water Res. 2000;34(15):3867–3875. DOI:10.1016/S0043-1354(00)00136-6.
- Muttamara S, Puetpaiboon U. Roles of baffles in waste stabilization ponds. Water Sci Technol. 1997;35(8):275–284. DOI:10.1016/S0273-1223(97)00177-7.
- Wang T, Lv N, Pan X, et al. Process performance and microbial community functional structure in a thermophilic anaerobic baffled reactor coupled with biocatalysed electrolysis. Environ Technol. 2020;41(12):1535–1545. DOI:10.1080/09593330.2018.1540664.
- Barber WP, Stuckey DC. The use of the anaerobic baffled reactor (ABR) for wastewater treatment: a review. Water Res. 1999;33(7):1559–1578. DOI:10.1016/S0043-1354(98)00371-6.
- Elmitwalli TA, Zandvoort MH, Zeeman G, et al. Low temperature treatment of domestic sewage in upflow anaerobic sludge blanket and anaerobic hybrid reactors. Water Sci Technol. 1999;39(5):177–185. DOI:10.1016/S0273-1223(99)00100-6.
- Van Haandel A, Kato MT, Cavalcanti PFF, et al. Anaerobic reactor design concepts for the treatment of domestic wastewater. Rev Environ Sci Biotechnol. 2006;5(1):21–38. DOI:10.1007/s11157-005-4888-y.
- Luostarinen SA, Rintala JA. Anaerobic on-site treatment of black water and dairy parlour wastewater in UASB-septic tanks at low temperatures. Water Res. 2005;39(2–3):436–448. DOI:10.1016/j.watres.2004.10.006.
- Sawajneh Z, Al-Omari A, Halalsheh M. Anaerobic treatment of strong sewage by a two stage system of AF and UASB reactors. Water Sci Technol. 2010;61(9):2399–2406. DOI:10.2166/wst.2010.051.
- Sayed SKI, Fergala MAA. Two-stage UASB concept for treatment of domestic sewage including sludge stabilization process. Water Sci Technol. 1995;32(11):55–63. DOI:10.1016/0273-1223(96)00118-7.
- Halalsheh M, Sawajneh Z, Zu’bi M, et al. Treatment of strong domestic sewage in a 96 m 3 UASB reactor operated at ambient temperatures: two-stage versus single-stage reactor. Bioresour Technol. 2005;96(5):577–585. DOI:10.1016/j.biortech.2004.06.014.
- Mason, A. Septic tanks of the future. In: Constructed Wetland Association Annual Conference 2018; 12th–13th September 2018; Portsmouth, UK; 2018.
- Cruddas PH, McAdam EJ, Asproulis N, et al. Development of a staged anaerobic pond for methane recovery from domestic wastewater. Ecol Eng. 2018;122(15):169–176. DOI:10.1016/j.ecoleng.2018.08.001.
- Cruddas PH, Wang K, Best D, et al. Diagnosis of an anaerobic pond treating temperate domestic wastewater: an alternative sludge strategy for small works. Ecol Eng. 2014;63:64–71. DOI:10.1016/j.ecoleng.2013.12.011.
- APHA. Standard methods for the examination of water and wastewater. 20th ed. Washington (DC): American Public Health Association; 1998.
- Luna GM, Stumm K, Pusceddu A, et al. Archaeal diversity in deep-sea sediments estimated by means of different terminal-restriction fragment length polymorphisms (T-RFLP) protocols. Curr Microbiol. 2009;59(3):356–361. DOI:10.1007/s00284-009-9445-4.
- Ferris MJ, Muyzer G, Ward DM. Denaturing gradient gel electrophoresis profiles of 16S rRNA-defined populations inhabiting a hot spring microbial mat community. Appl Environ Microbiol. 1996;62(2):340–346. DOI:10.1128/aem.62.2.340-346.1996.
- Karakashev D, Batstone DJ, Trably E, et al. Acetate oxidation is the dominant methanogenic pathway from acetate in the absence of Methanosaetaceae. Appl Environ Microbiol. 2006;72(7):5138–5141. DOI:10.1128/AEM.00489-06.
- Peña MR, Mara DD, Sanchez A. Dispersion studies in anaerobic ponds: implications for design and operation. Water Sci Technol. 2000;42(10–11):273–282. DOI: 10.2166/wst.2000.0660.
- Alvarado A, Sanchez E, Durazno G, et al. CFD analysis of sludge accumulation and hydraulic performance of a waste stabilization pond. Water Sci Technol. 2012;66(11):2370–2377. DOI:10.2166/wst.2012.450.
- Grobicki A, Stuckey DC. Hydrodynamic characteristics of the anaerobic baffled reactor. Water Res. 1992;26(3):371–378. DOI:10.1016/0043-1354(92)90034-2.
- Paing J, Picot B, Sambuco JP, et al. Sludge accumulation and methanogenic activity in an anaerobic lagoon. Water Sci Technol. 2000;42(10-11):247–255. DOI:10.2166/wst.2000.0654.
- Picot B, Paing J, Sambuco JP, et al. Biogas production, sludge accumulation and mass balance of carbon in anaerobic ponds. Water Sci Technol. 2003;48(2):243–250. DOI:10.2166/wst.2003.0127.
- Papadopoulos A, Parissopoulos G, Papadopoulos F, et al. Sludge accumulation pattern in an anaerobic pond under Mediterranean climatic conditions. Water Res. 2003;37(3):634–644. DOI:10.1016/S0043-1354(02)00307-X.
- Toprak H. Temperature and organic loading dependency of methane and carbon dioxide emission rates of a full-scale anaerobic waste stabilization pond. Water Res. 1995;29(4):1111–1119. DOI:10.1016/0043-1354(94)00251-2.
- Safley Jr. LM, Westerman PW. Anaerobic lagoon biogas recovery systems. Biol Waste. 1989;27(1):43–62. DOI:10.1016/0269-7483(89)90029-3.
- Picot B, Sambuco JP, Brouillet JL, et al. Wastewater stabilisation ponds: sludge accumulation, technical and financial study on desludging and sludge disposal case studies in France. Water Sci Technol. 2005b;51(12):227–234. DOI:10.2166/wst.2005.0469.
- Heubeck S, Craggs RJ. Biogas recovery from a temperate climate covered anaerobic pond. Water Sci Technol. 2010;61(4):1019–1026. DOI:10.2166/wst.2010.965.
- Cruddas PH. 2014. Anaerobic ponds for domestic wastewater treatment in temperate climates. PhD thesis, Cranfield University, Cranfield: UK.