
ABSTRACT
This study aimed to analyse the efficacy of a new cold plasma device adapted for treatment with a low power consumption . We tested the reduction of bacterial cells in biofilms of E. coli, S. aureus and P. aeruginosa. . The results show significant differences between bacterial cells, suggesting that Gramme-positive S. aureus is less susceptible to plasma treatment than Gramme-negative E. coli and P. aeruginosa. Increasing the exposure time and decreasing the distance decreases the number of cells in the biofilm. However, the combination of close distance and long exposure time resulted in synergistic effects. We demonstrated a reduction of up to 6.6 log CFU cm2 for E. coli at 1 mm and an exposure time of 60 seconds. All these indicate that the new cold plasma jet device can be an important key to ensuring hygiene and numerous applications in medicine and engineering are possible.
Introduction
Biofilms pose a significant risk in medicine, engineering, and any field where we try to keep surface hygiene as high as possible. Bacterial cells within the biofilms are protected with exopolysaccharide substances against harsh environmental conditions that allows them to grow and multiply better than individual planktonic cells. Moreover, quorum sensing in biofilms enables bacterial communication that results in gene expression and response to environmental conditions (Simões et al. Citation2010). Therefore, higher concentrations of chemicals must be used to eradicate the biofilm compared to the planktonic form of the same bacterial strain (Giaouris and Simões Citation2018). Furthermore, also bacterial characteristic e.g. cell wall plays important role in disinfection efficiency. Gram-negative bacteria are surrounded with thin layer of peptidoglycan cell wall in comparison to Gram-positive bacteria that possess thick layers of peptidoglycan and are therefore more protected to chemical and physical stress (Kampf Citation2018). This will pose a significant environmental burden in the future as more and more strains of bacteria become resistant. A recent report on the global burden of bacterial resistance shows that more than 4.95 million deaths worldwide are associated with bacterial resistance and that E. coli, P. aeruginosa, and S. aureus are among the most important resistant pathogens (Murray et al. Citation2022). As a result of the 2020 pandemic, sales of disinfectants have doubled worldwide without evidence of their short- and long-term side effects, posing a potential threat to human, animal, and environmental health (Dewey et al. Citation2022). Increased exposure to antimicrobial ingredients may be released into the environment, which has some worrisome implications. These ingredients will increase the number of bacterial strains that become resistant. Therefore, there is an urgent need for science to control the microbial population without increasing the burden of bacterial resistance. One answer to the impending bacterial resistance crisis may be the use of cold plasma, as it is safe, effective, nontoxic, and resistance-free technology (Zimmermann et al. Citation2012; Gilmore et al. Citation2018; Nicol et al. Citation2020). The various components in plasma such as free radicals, free electrons, reactive oxygen species (ROS – O, O2●-, O3, OH) and reactive nitrogen species (RNS – N, N2*, NO, NO2), often collectively referred to as reactive oxygen and nitrogen species (RONS), UV photons and high electric field strengths. These are thought to play a synergistic role in the antimicrobial mode of action (Gupta and Ayan Citation2019). The most common form of cold atmospheric plasma (CAP) used in medical and healthcare applications is dielectric barrier discharge (DBD) plasma because it is safe to operate and easy to set up (Helmke et al. Citation2013; Domonkos et al. Citation2021). However, DBD plasmas are usually generated against conductive surfaces and tend to emit high ozone concentrations (Kogelschatz et al. Citation2003). In contrast, a form of CAP, more commonly used in industrial applications, is the gliding arc jets (GAJ), which emits less ozone (Gangoli et al. Citation2005) and is usually independent of the substrate material (Czernichowski Citation1994). Applications of GAJ plasmas include the inactivation of bacteria, e.g. in the aqueous phase on a microfluidic device (Patinglag et al. Citation2021) or decontamination of plant seeds (Liu et al. Citation2021) or foods such as almonds (Khalili et al. Citation2018). The reactive species have strong oxidative effects on bacterial surfaces causing lipid oxidation, protein modulation, DNA damage, and consequently cell death (Liao et al. Citation2017). Although some of the studies focus on the application of cold plasma against biofilms (Gilmore et al. Citation2018; Zhu et al. Citation2020; Niveditha et al. Citation2021), several significant gaps in the understanding of the mechanism of action and factors influencing the control of biofilms by plasma have not been fully elucidated. Therefore, this study aimed to analyse the tailored plasma jet device for the inactivation of biofilms on polystyrene surfaces. The first objective of the study was to analyse how the interaction between exposure time and removal affects the hygienically relevant biofilms. Secondly, the possibility of biofilm eradication using a cold plasma jet device was to be evaluated.
Methods
Model organisms
Hygienically relevant bacterial strains were used for the antibacterial and anti-biofilm test. The standard strain of Escherichia coli ATCC 35,218 was obtained from the Czech Collection of Microorganisms (CCM, Czech Republic) and Pseudomonas aeruginosa ATCC 27,853 and Staphylococcus aureus ATCC 25,923 from Sigma Aldrich (Virginia, USA). The bacteria from the collection were transferred to nutrient agar and incubated at 37°C for 24 hours. Then, a single colony of one strain was transferred from nutrient agar to nutrient broth (Biolife, Italy) and incubated under the same conditions.
Plasma jet device
A gliding arc plasma jet device that has been described in detail previously (Dahle et al. Citation2020; Kariž et al. Citation2021), was used to treat the surfaces as shown in . For the current study, the device was equipped with a novel nozzle as follows. A cap made of polypropylene HT (ALPRO HTEM 40 mm) serves as a support for the nozzle assembly, which consists of an 8 mm aluminium tube (Gust. Alberts GmbH & Co. KG, Herscheid, Germany) coated with epoxy (UHU plus schnellfest, UHU GmbH & Co. KG, Bühl, Germany), into which two copper electrodes (ROLOT 605, 1.5 mm diameter, Rothenberger Werkzeuge GmbH, Kelkheim, Germany) are mounted at a distance of approximately 2 mm using two wire connectors (WAGO 221–413, WAGO GmbH & Co. KG, Neuried, Germany), which are also used to connect the high-voltage supply. The nozzle assembly is shown in (top left) and is built into the bottom of a tube PP HT (ALPRO HTEM 40 mm), on which a compressed air connection is mounted. The commercial module high voltage module (ZVS_Driver_20A_kit_AC, Voltagezone Electronics e.U., Graz, Austria) was operated at an input voltage of 20 V and typical output power of 35 W during plasma treatment. Atmospheric air is supplied with a flow rate of approximately 35 L min−1. All design details can be found in the data set of this publication at Zenodo (Dahle et al. Citation2022).
Figure 1. Picture of the nozzle setup (top left), the cross-section of the simulated nozzle with electric potential (top right) and capacity calculation for varying electrode distances (bottom).
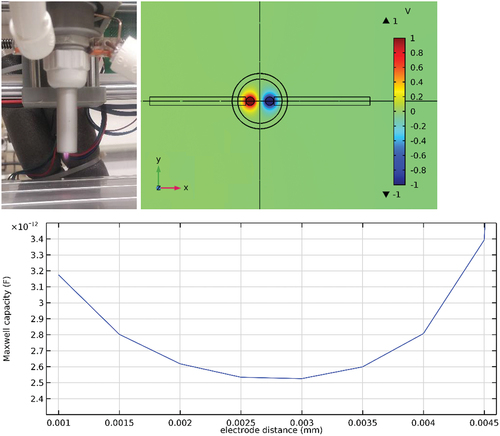
The nozzle design was optimized using the electrostatic module in COMSOL Multiphysics 5.3. The capacitance (, bottom panel) shows a minimum between 2.5 mm and 3 mm electrode spacing. To avoid arcing onto the nozzle, an optimum electrode spacing of 2 mm was chosen. The device has 2.6 pF electrical capacitance, as opposed to the 1.1 pF of the original nozzle design. All simulation files and results are included in the dataset of the publication at Zenodo (Dahle et al. Citation2022).
Optical emission spectroscopy
Optical emission spectroscopy (OES) has been used to evaluate the reduced electric field and electron energies in the plasma discharge. Spectra were recorded at different integration times (7 ms, 500 ms, and autoconfigure for each data point) using a 16-bit Avantes AvaSpec 3648 fiber optic spectrometer (Avantes Inc., Louisville, CO, USA). Overall intensities of the spectra, integrated over a range from 200 nm to 759.6 nm after subtraction of the dark spectrum, were used as a relative measure for the plasma intensity. Reduced electric fields have been evaluated from the nitrogen emission lines N2+ (B2Σu+ → X2Σg+, (0, 0)) at 391.4 nm and N2 (C3Πu → B3Πg, (2, 5)) at 394.3 nm using the methodology after Paris and colleagues (Paris et al. Citation2005, Citation2006; Pancheshnyi Citation2006; Kuchenbecker et al. Citation2009). Electron energies were calculated based on the reduced electric fields using the Bolsig+ software version 03/2016 (Hagelaar and Pitchford Citation2005) with cross-sections from the LXcat database (Pitchford Citation2013). The discharges in this study likely do not fulfil the steady-state conditions for the equations as formulated by Paris et al. (Citation2005). However, Bonaventura et al. (Citation2011) proved that the equations are suited for determining accurate peak electric fields, and hence accurate peak values for average electron energies, as long as a sufficient spatial and time-integrated optical emission spectrum is used.
Plasma jet device exposure regimes
During the treatment process, a microtiter plate with grown biofilms was placed on the stage with a distance between the nozzle exit and the microtiter plate surface ranging from 1 mm to 10 mm. Flow simulations were conducted using the laminar flow module in COMSOL Multiphysics 5.3 for distances from 10 mm to 1 mm between the tip of the plasma nozzle and the bottom of the microtiter well (see figure S1 in the supplemental materials). A good contact of the airflow both at the bottom and side of the well was found, with flow velocities at the bottom of the well below the nozzle edge amounting to 8.2 m/s at 10 mm distance, a minimum of 7.4 m/s at 5 mm and rising to 16.1 m/s at 1 mm distance (supplements, figure S2). The pressures underneath the nozzle’s centre amount to 59 Pa at 10 mm, with a minimum of 39 Pa at 4 mm, and up to 150 Pa at 1 mm (supplements, figure S2). The contact area between laminar flow and side wall decreases between 10 mm and 3 mm distance, while flow velocities and pressures vary only minimally. From 3 mm to 1 mm, however, velocities strongly increase, as does the pressure below the centre of the nozzle, whereas the pressure below the nozzle’s edge notably drops below the pressure inside the nozzle. This indicates reduced time and area of interaction between plasma gas and the sample surface. Moreover, the corresponding flow restriction will decrease the volume flow, thus yielding higher gas temperatures and thermal impact on the sample. Temperature evaluations were carried out using a thermal imaging camera (supplements, figure S3 with description) and together with physical considerations show that substrate temperatures should have remained well below 40°C. Furthermore, optical emission spectra were determined for the plasma. depicts an exemplary optical emission spectrum (top image) and the detailed evaluation of spectra at various distances from the nozzle (bottom images), where position 0 mm refers to the edge of the plasma nozzle. The single spectrum (top image) contains typical features of gliding arc air plasmas (Lommatzsch et al. Citation2007), particularly the neutral nitrogen molecule’s second positive system (SPS) and the nitrogen molecular cation’s first negative system with the most intense lines visible in the spectral range from 290 nm to 400 nm. Another typical component in atmospheric plasma jets is the OH radical with an emission line at 309 nm (Zaplotnik et al. Citation2021). This partially overlaps with one of the nitrogen’s SPS emission lines but appears to be significantly lower than in other gliding arc jets (Lommatzsch et al. Citation2007; Zaplotnik et al. Citation2021). In contrast to high-power industrial systems, the NOγ system in the range 200–300 nm is visible with a significantly lower proportion than the N2 SPS emission, indicating lower gas temperatures within the nozzle, which play an important role in converting the oxygen radicals and ozone into nitrogen oxides (Lommatzsch et al. Citation2007). Consequently, the NO2+ continuum emission does not appear in significant intensities, although an overlap with the thermal emission background at higher wavelengths obstructs a more detailed determination. Indeed, the high-wavelength side of the spectrum mainly shows thermal emission from the copper electrodes heating up in the plasma process, which is reflected at the aluminum nozzle. This thermal emission continuum has its maximum well above the range of the used spectrometer, i.e. well above 750 nm so that the temperature of the electrodes cannot be reliably determined using a black-body radiation approach via Wien‘s displacement law and the Planck radiation law. Moreover, the dominance of the nitrogen SPS emission in the UV range and most of the visible region would indicate a significant production of other ROS. Although the more intense emission lines of oxygen radicals at 777 nm and 844 nm (Krstulović et al. Citation2006) are outside of the spectrometer ‘s range, the slight shoulder at 395 nm might indeed indicate the presence of oxygen radicals (Costa et al. Citation2020) well down within the effluent afterglow. Nevertheless, the absence of notable ozone emissions indicates that most radicals are indeed converted in the discharge region within the nozzle (Lommatzsch et al. Citation2007).
Figure 2. Example optical emission spectrum (top image) as well as analysis of reduced electric fields (black line and squares), electron energies (red lines and circles) and integrated optical emission intensity (blue line and triangles) at various distances from the nozzle (top left image) and dependence of selected NO, (blue line and diamonds), OH (orange line and squares) and Hγ (grey line and triangles) species over distance from nozzle (bottom right image).
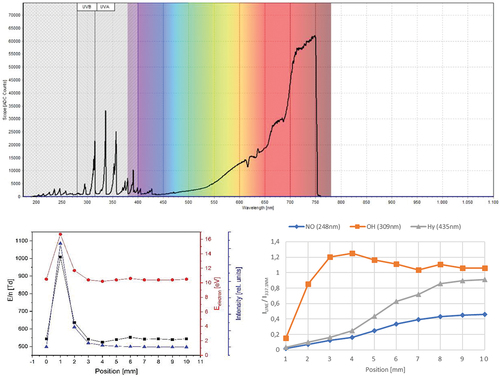
The bottom left image of shows an analysis of the reduced electric fields corresponding to the electric gas breakdown upon each plasma ignition to be highest directly at the exit of the nozzle with 16.7 eV electron energy, corresponding to an electron temperature of approx. 194000 K, at a distance of 1 mm from the nozzle, which quickly declines and stays almost constant at 10.4 eV or 120,000 K, respectively, for distances larger than 3 mm. Similarly, the overall intensity of the emitted light, integrated over the entire spectral range, drops below 1% of its peak value within just a 5 mm distance to the nozzle face. A minor increase in electron energy at ca. 6 mm corresponds to the deexcitation of electrically excited nitrogen species and the formation of various reactive oxygen and nitrogen species (RONS). This is accompanied by a minute shoulder in the overall light emission intensity, best visible in the autoconfigured spectra (see supplements, Figure S4). This change in the composition of reactive species is exemplified in the bottom right image of , where a fast increase of OH species (orange line and squares) is visible within the first 3 mm due to intermixing with the surrounding air, whereas nitrous oxide (blue line and diamonds) and hydrogen radicals (grey line and triangles) appear to plateau only after approx. 1 cm. At that point, the visible emission of the afterglow has effectively seized, indicating a complete deexcitation of metastables and other longer-lived, highly excited gas species from the plasma.
CNC scripts (G-codes) for treatments were created to treat 24-well microplates at distances from the nozzle to the well bottom between 1 mm and 10 mm for a duration of 10 s to 60 s. All G-code files are provided with the raw and analytical data in this publication (Dahle et al. Citation2022).
Cold plasma antibacterial assay
The antibacterial potential of cold plasma jet was determined by (Klančnik et al. Citation2010) with some modifications. Briefly, for each bacterial strain, 0.1 ml of a bacterial suspension with a concentration of 0.5 McFarland was evenly distributed on tryptic soy agar (Biolife, Italy) in a Petri dish. Then, the bacterial cells on tryptic soy agar were exposed to cold plasma treatment, varying the time (10s, 60s) of exposure and the distance (1 mm, 3 mm, 10 mm) from the nozzle to the surface of the agar. In the next step, the plates were incubated under aerobic conditions at 37°C for 24 hours. After that, the zone of inhibition was measured. For the inhibition zone, the ImageJ tool was used according to (Alonso et al. Citation2017). The colour image was transformed to grayscale and the measurement scale was set. The image was transformed to binary image, and the area was calculated. All experiments were performed with three parallel trials and three replicates.
Cold plasma anti-biofilm assay
The anti-biofilm test was performed as follows (Fink et al. Citation2020) with some modifications as follows. Bacterial cultures of E. coli, P. aeruginosa, and S. aureus were transferred from the nutrient agar to a 0.9% NaCl solution to achieve a concentration of 0.5 McFarland (1.5 × 10⁸ CFU mL−1). The bacterial culture was added to nutrient broth (Biolife, Italy) to reach the final cell concentration of 5 × 10⁵ CFU mL−1. Then, sterile flat-bottomed 24-well microplates (Nunc, Denmark) were filled with 300 μL of the bacterial suspension and incubated for 24 hours at 37°C under static conditions. In the next step, the bacterial suspension was removed and washed three times with 300 μL of phosphate buffer saline (PBS) to remove all loosely attached cells. The biofilms were then exposed to cold plasma, varying both the exposure time (10 s to 60 s) and the distance (1 mm to 10 mm) from the nozzle to the bottom of the microplate. 300 μL 0.9% NaCl was added to each well and sonicated at 37 kHz, 200 W, for 3 min (Elma Hans Schmildbauer GmbH & Co., Germany) to remove biofilm from the well surface. After serial dilution, Petri dishes were inoculated with selective media. Endo agar (Sigma Aldrich) was used for E. coli, Manitol salt agar (Carl Roth) for S. aureus, and Cetrimide agar (Sigma Aldrich) for P. aeruginosa. The plates were incubated at 37°C for 24 hours. Colonies were then counted and CFU reduction per cm2 was calculated.
Scanning electron and confocal laser scanning microscopy of plasma-treated biofilms
The microplates containing the control bacterial cultures and the plasma-treated bacterial cultures were examined using the environmental Quanta 250 scanning electron microscope (SEM, Thermo Fisher Scientific, Hillsboro, Oregon, USA) to determine the effects of plasma treatment on the shape of the bacteria. Bacterial cultures were plasma treated at a distance between the nozzle and the bottom of the well of 1 mm in 60 seconds. Before observations, a conductive gold layer was sputtered onto the samples to minimise the effects of electron charging. Images were acquired using the Everhart-Thornley detector in a high vacuum (0.0194 Pa) with an electron source voltage of 10.0 kV, at magnifications of 1,000× and 10,000×, a spot size of 3.0 nm, and a time of electron beam passage through the sample of 30 μs.
Samples for confocal laser scanning microscopy (CLSM) were prepared and treated as above. The samples in 24 well plates were subjected to an epifluorescence staining method employing the bacterial viability kit Live/Dead BacLight (Invitrogen). The dye was prepared according to the manufacturer’s specification and samples with dye were incubated in dark for 15 minutes. Cells with a compromised membrane that are considered to be dead or dying will stain red, whereas cells with an intact membrane will stain green. CLSM Leica TCS SP5 (Leica Microsystem, Germany) was used with excitation levels for Syto9 at 488 nm and propidium iodide at 453. Images were acquired at 1.5 μm intervals and 40× objective lenses.
Statistically analysis
Statistical analysis was provided using R software version 4.1.1. (Bell Laboratories, New Jersey, U.S.). Normality was checked using the Shapiro-Wilk test (p > 0.05). One-way analysis of variance (ANOVA) and the Duncan test were used to determine the significant differences at a significance level of p < 0.05.
Results
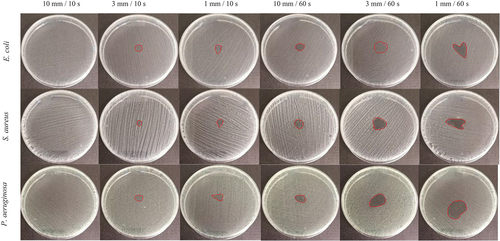
The results of the antibacterial test show the significant influence of the exposure time and distance of the cold plasma jet. The experiment shows that at 10 mm/10s there is no visible inhibition, while when the distance is reduced to 3 mm/10s, the zone of inhibition is evident and even clear at 1 mm/10s (). Furthermore, at 10 mm/60s, an inhibition zone is apparent and becomes more obvious and larger as the distance decreases. The largest zone of inhibition for all bacteria tested was observed for the treatment at 1 mm/60s.
Figure 3. Cold plasma jet inhibition zone for E. coli, S. aureus and P. aeruginosa varying exposure distance and time.
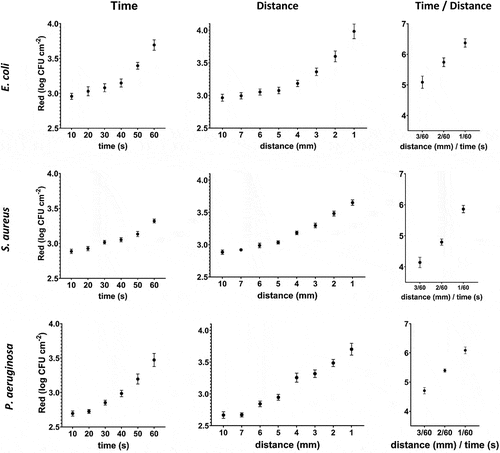
The reduction of all three bacterial biofilms (log CFU cm−2) is significantly related to the increase in exposure time and the decrease in treatment distance. Moreover, the results show an exponential increase in the reduction for both E. coli and P. aeruginosa, while this observation is not so evident for S. aureus. Furthermore, the results show that a simultaneous increase in exposure time and a decrease in the distance of cold plasma results in an increased reduction of bacterial cells (). For example, in the case of E. coli, plasma treatment of 10 mm/60s results in a reduction of 3.7 log CFU cm−2 and 1 mm/10s results in a reduction of 3.9 CFU cm−2, while the combination of 1 mm/60s results in a reduction of 6.5 log CFU cm−2.
Figure 4. Cold plasma jet E. coli, S. aureus and P. aeruginosa biofilm reduction varying exposure distance and time.
The results of the statistical analysis show that a decrease in plasma exposure distance leads to an increased reduction (log CFU cm−2) for all strains tested (p < 0.000). More detailed post hoc analyses for E. coli and P. aeruginosa showed that distances of 7 mm and 10 mm do not have a statistically significantly different effect on reduction. Moreover, increasing the exposure time increases the reduction for all bacterial strains studied (p < 0.000). And the combination of distance and exposure time has a significant (p < 0.000) influence on the reduction of all tested bacteria ().
Table 1. Results of ANOVA and post hoc Duncan test.
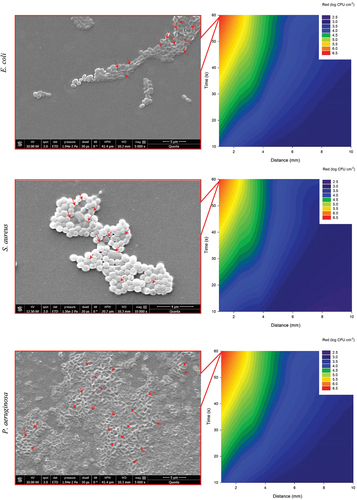
The reduction in log CFU cm−2 of biofilm is the interaction of cold plasma exposure time and distance. The results show that simultaneous increase of exposure time and decrease of distance between surface and plasma nozzle increases the reduction. The results show that the synergistic effects are more pronounced for E. coli and P. aeruginosa than for S. aureus (). In addition, the morphological effects of plasma treatment at 1 mm/60s show cell wall collapse and ruptured and deformed cells. The effect is strongest in Gram-negative E. coli and P. aeruginosa, while Gram-positive S. aureus is less affected ().
Figure 5. Synergistic effect of cold plasma exposure time and removal on the reduction of bacterial biofilms of E. coli, S. aureus and P. aeruginosa (right). SEM images of E. coli, S. aureus and P. aeruginosa after treatment with cold plasma at 1 mm/60s. .
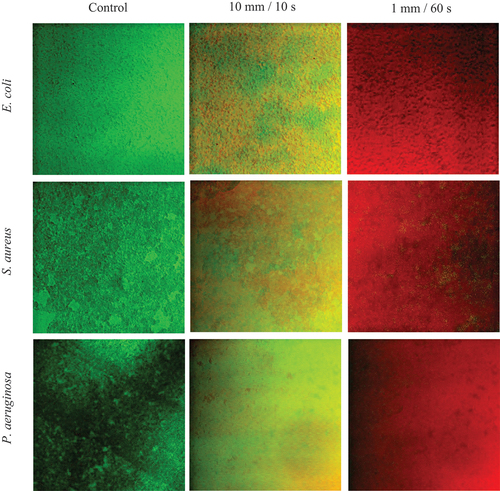
The unexposed biofilms are predominantly green (viable), and the faction of red (non-viable) increased upon decreasing the distance and increasing the exposure time. Results indicate the vast majority of cells were non-viable at 1 mm/60 s of the cold plasma treating regime ().
Figure 6. Confocal laser scanning microscopy analyses of bacterial biofilms of E. coli, S. aureus and P. aeruginosa before and after exposure to 10 mm/10 s and 1 mm/60 s cold plasma jet.
Discussion
Bacterial biofilms represent one of the greatest burdens of modern public health. As the consumption of cleaning products and disinfectants increases, these problems will become even more prominent. Therefore, we investigated the potential of a cold plasma device for the sustainable management of hygienically relevant biofilms. The results show that a cold plasma jet device can cause significant zones of inhibition on solid media containing inoculated E. coli, P. aeruginosa, and S. aureus. Furthermore, we show that the zone of inhibition is strongly dependent on the time and distance of exposure. Similarly, Svarnas et al. (Citation2019) tested the zone of inhibition of atmospheric pressure cold plasma on A. baumannii and found that 10 mm/60s caused a zone of inhibition of 6 mm, which is comparable to our study that showed a zone of inhibition of 8 mm after treatment with 10 mm/60s. Also, Nicol et al. (Citation2020) tested a low-temperature plasma jet for inhibition potential for S. aureus and found that increased oxygen content in the gas mixture and increased distance between the jet nozzle and the sample decreased treatment efficacy. They also found that extending the exposure time beyond 60 seconds did not affect the zone of inhibition. Cells in a biofilm are generally more resistant to chemical treatments in comparison to planktonic cells due to exopolysaccharide substances that reduce the exposure of plasma to bacterial cells within the biofilm (Simões et al. Citation2010; Gilmore et al. Citation2018). Therefore, it is important to evaluate the ability to apply a cold plasma jet to the biofilm form and not only to the planktonic cells. The major advantage of our cold plasma jet device is that it requires only electricity and ambient air to generate reactive oxygen and nitrogen species for disinfection. Misra and Roopesh (Citation2019) analysed the energy efficiency of cold plasma devices and concluded that an average plasma application with an output power of 100 W consumes electricity on the order of the consumption of a light bulb. Therefore, it is obvious that our new application with an output power of 35 W is therefore even more sustainable. In addition, this approach can significantly reduce disinfectant consumption and has environmental and bacterial resistance prevention benefits. Brun et al. (Citation2018) tested the effects of plasma on bacterial cells and found no evidence of resistance development. Moreover, Liao et al. (Citation2018) even demonstrated that treatment of multidrug-resistant S. aureus with plasma results in leaking and degradation of the methicillin resistance gene (mecA). The results of our study show that the efficacy of cold plasma is dose-dependent, as the capacity of bacterial reduction within the biofilm depends on the exposure time and distance. Similarly, Anzai et al. (Citation2019) showed that decreasing the distance between the plasma source and the sample decreases the survival rate of S. aureus. One of the reasons could be that at a constant plasma flow rate, where more reactive species reach the biofilm at smaller distances Gupta and Ayan (Citation2019). And increasing the plasma exposure time will increase the production of more reactive species. A study showed that increasing the exposure time from 5 to 60 seconds at a power of 20 W exponentially increases the zone of inhibition of Pseudomonas aureofaciens (Todorova et al. Citation2022). Niveditha et al. (Citation2021) reported that reactive plasma species eradicate bacteria within the biofilm and promote the collapse of the biofilm matrix. Results of optical emission spectra in our study show the presence of typical components e.g. OH radicals and electrically excited N2 species such as N2* metastables, while NO and NO2 did not appear in significant intensities. Therefore, we assume OH radicals and electrically excited N2 species play important roles in bacterial reduction. However, not only the properties of the cold plasma device but also the properties of the bacteria can significantly affect the results. For example, Ziuzina et al. (Citation2015) reported significant differences in the efficacy of Gram-positive and Gram-negative bacteria. Similarly, our study shows that cold plasma jet treatment is less effective for Gram-positive S. aureus than for Gram-negative E. coli or P. aeruginosa for both varying time and varying exposure distance (). One of the reasons for this could be differences in cell walls. As Gram-positive bacteria have thicker walls made of peptidoglycan, the spread and penetration of RONS species may be impaired. Huang et al. (Citation2012) showed Gram-negative bacteria are more susceptible to OH radicals than Gram-positive bacteria, which would explain the effects on bacterial cells obtained by SEM in our case. More in detail (Mai-Prochnow et al. Citation2016) reported plasma disrupts the cell wall and consequently the leakage of cellular components e.g. potassium, nucleic acid, and proteins. Once the cell wall is broken, ROS and RNS can penetrate the interior of the cell and further damage DNA and intracellular proteins. This is also consistent with our results of optical emission spectra, bacterial reduction, SEM and fluorescence microscopy. In addition, Han et al. (Citation2016) reported that rod-shaped bacteria are more sensitive to cold plasma treatment than spherical bacteria. This is consistent with our study, which showed that rod-shaped E. coli and P. aeruginosa are much more sensitive to cold plasma treatments than spherical S. aureus. Furthermore, Niemira et al. (Citation2018) investigated the effects of a cold plasma jet on a 24, 48, and 72-hour-old E. coli biofilm and found that the maturity of the biofilm did not affect bacterial reduction. The results of our study show that the interaction of exposure distance and time has a significant effect on bacterial reduction. At a constant distance of 10 mm, increasing the exposure time to 60 s leads to only 3.3 to 3.7 log CFU cm2, while the simultaneous combination of the smallest distance (1 mm) and the longest exposure time (60 s) leads to 5.8 to 6.6 log CFU cm2, depending on the bacterial strain. The Live/Dead staining and confocal microscopy examination support these findings (). The novel cold plasma jet device with an adapted nozzle has been specifically optimised for low-energy application at 35 W. By reducing the energy input, shortening the distance between electrodes, and optimising the distance and exposure time, we can achieve great biofilm reduction. All this shows that the new cold plasma jet device has the potential for biofilm management and can be the answer to the upcoming antimicrobial crisis.
Conclusions
In recent years, the cold plasma approach has attracted much attention in both basic and applied science. Our new cold plasma device has proven to be an effective design for treating hygienically relevant biofilms. Optical emission spectra show that especially OH radicals and electrically excited N2 species plays significant role in bacterial reduction. We demonstrate the antibacterial potential of cold plasma jet against E. coli, P. aeruginosa and S. aureus. In addition, our research has shown that the inactivation of biofilms can be achieved by increasing the exposure time and decreasing the distance between the plasma jet and the biofilm. The limitation of our new cold plasma device is related to the low distance between the plasma nozzle and surface (1 mm) to achieve sufficient biofilm reduction. Howsoever prolonging exposure time at longer distances and/or increasing the output power will make the plasma device suitable for a larger range of applications. A reduction of up to 6.6 log CFU cm−2 can be achieved at a distance of 1 mm and exposure time of 60 s, but the efficacy is bacterial strain specific. All this indicates that the new low-power cold plasma device has many potential applications in medicine, engineering, and hygiene.
Author contribution statement
S.D.: Conceptualization, Investigation, Resources, Data Curation, Writing – Original Draft, Visualization. J. Ž.: Investigation, Writing – Review & Editing. R. F.: Conceptualization, Validation, Formal analysis, Investigation, Resources, Writing – Original Draft, Visualization, Project administration, Funding acquisition.
Supplemental Material
Download PDF (594.4 KB)Acknowledgements
The authors thankfully acknowledge the provision of the optical emission spectrometer by Prof Dr. Wolfgang Maus-Friedrichs, Clausthal University of Technology.
Disclosure statement
No potential conflict of interest was reported by the author(s).
Data availability statement
All raw and analysed data have been made available online via Zenodo at https://doi.org/10.5281/zenodo.6063278.
Supplementary material
Supplemental data for this article can be accessed online at https://doi.org/10.1080/09603123.2022.2149710.
Additional information
Funding
References
- Alonso C, Domínguez C, Heras J, Mata E, Pascual V, Torres C, Zarazaga M. 2017. Antibiogramj: a tool for analysing images from disk diffusion tests. Comput Methods Programs Biomed. 143:159–169. doi:10.1016/j.cmpb.2017.03.010.
- Angoli S, Gutsol A, Fridman A Applications of Gliding Arc as a Source of Atmospheric Pressure Transitional Plasma. In Proceedings of the IEEE Conference Record-Abstracts. 2005 IEEE International Conference on Plasma Science, 2005; pp. 359–359.
- Anzai K, Aoki T, Koshimizu S, Takaya R, Tsuchida K, Takajo T. 2019. Formation of reactive oxygen species by irradiation of cold atmospheric pressure plasma jet to water depends on the irradiation distance. J Clin Biochem Nutr. 64(3):187–193. doi:10.3164/jcbn.18-102.
- Bonaventura Z, Bourdon A, Celestin S, Pasko VP. 2011. Electric field determination in streamer discharges in air at atmospheric pressure. Plasma Sources Sci Technol. 20(3):035012. doi:10.1088/0963-0252/20/3/035012.
- Brun P, Bernabè G, Marchiori C, Scarpa M, Zuin M, Cavazzana R, Zaniol B, Martines E. 2018. Antibacterial efficacy and mechanisms of action of low power atmospheric pressure cold plasma: membrane permeability, biofilm penetration and antimicrobial sensitization. J Appl Microbiol. 125(2):398–408. doi:10.1111/jam.13780.
- Costa IKF, Vitoriano JO, Saraiva MVA, Negreiros AMP, Sales JR, Alves JR 2020. Inactivation of colletotrichum brevisporum spores by direct and indirect action of cold atmospheric plasma. 22nd International Conference on Gas Discharges and their Applications, Novi Sad, Serbia. p 1–4.
- Czernichowski A. 1994. Gliding arc: applications to engineering and environment control. Pure Appl Chem. 66(6):1301–1310. doi:10.1351/pac199466061301.
- Dahle S, Fink R, Žigon J. 2022. Raw and analyzed data for manuscript “Cold plasma for sustainable control of hygienically relevant biofilms. the interaction of plasma distance and exposure time” (1.0.0) [Data set]. Geneva: Zenodo. editor.
- Dahle S, Žigon J, Gospodarič B, Zaplotnik R, Merhar M, Petrič M. 2020. Open-source integrated plasma treatment and CNC machining system (0.1.0). Geneva: Zenodo.
- Dewey HM, Jones JM, Keating MR, Budhathoki-Uprety J. 2022. Increased use of disinfectants during the COVID-19 pandemic and its potential impacts on health and safety. 29(1): 27–38. American Chemical Society: Chemical Health & Safety.
- Domonkos M, Tichá P, Trejbal J, Demo P. 2021. Applications of cold atmospheric pressure plasma technology in medicine, agriculture and food industry. Appl Sci. 11(11):4809. doi:10.3390/app11114809.
- Fink R, Potočnik A, Oder M. 2020. Plant-based natural saponins for Escherichia coli surface hygiene management. LWT. 122:109018. doi:10.1016/j.lwt.2020.109018.
- Giaouris EE, Simões MV. 2018. Pathogenic biofilm formation in the food industry and alternative control strategies. Foodborne Diseases. Handbook of Food Bioengineering. United Kingdom: Academic Press. 309–377.
- Gilmore BF, Flynn PB, O’Brien S, Hickok N, Freeman T, Bourke P. 2018. Cold plasmas for biofilm control: opportunities and challenges. Trends Biotechnol. 36(6):627–638. doi:10.1016/j.tibtech.2018.03.007.
- Gupta TT, Ayan H. 2019. Application of non-thermal plasma on biofilm: a review. Appl Sci. 9(17):3548. doi:10.3390/app9173548.
- Hagelaar GJM, Pitchford LC. 2005. Solving the Boltzmann equation to obtain electron transport coefficients and rate coefficients for fluid models. Plasma Sources Sci Technol. 14(4):722–733. doi:10.1088/0963-0252/14/4/011.
- Han L, Ziuzina D, Heslin C, Boehm D, Patange A, Sango DM, Valdramidis VP, Cullen PJ, Bourke P. 2016. Controlling microbial safety challenges of meat using high voltage atmospheric cold plasma. Front Microbiol. 7:977. doi:10.3389/fmicb.2016.00977.
- Helmke A, Wandke D, Mahmoodzada M, Weltmann KD, Viöl W. 2013. Impact of electrode design, supply voltage and interelectrode distance on safety aspects and characteristics of a medical DBD plasma source. Contrib Plasma Phys. 53(9):623–638. doi:10.1002/ctpp.201200133.
- Huang L, Xuan Y, Koide Y, Zhiyentayev T, Tanaka M, Hamblin MR. 2012. Type I and Type II mechanisms of antimicrobial photodynamic therapy: an in vitro study on gram‐negative and gram‐positive bacteria. Lasers Surg Med. 44(6):490–499. doi:10.1002/lsm.22045.
- Kampf G. 2018. Biocidal agents used for disinfection can enhance antibiotic resistance in gram-negative species. Antibiotics. 7(4):110. doi:10.3390/antibiotics7040110.
- Kariž M, Tomec DK, Dahle S, Kuzman MK, Šernek M, Žigon J. 2021. Effect of sanding and plasma treatment of 3D-printed parts on bonding to wood with PVAc adhesive. Polymers. 13(8):1211. doi:10.3390/polym13081211.
- Khalili F, Shokri B, Khani M-R, Hasani M, Zandi F, Aliahmadi A. 2018. A study of the effect of gliding arc non-thermal plasma on almonds decontamination. AIP Adv. 8(10):105024. doi:10.1063/1.5044476.
- Klančnik A, Piskernik S, Jeršek B, Možina SS. 2010. Evaluation of diffusion and dilution methods to determine the antibacterial activity of plant extracts. J Microbiol Methods. 81(2):121–126. doi:10.1016/j.mimet.2010.02.004.
- Kogelschatz U, Eliasson B, Egli W. 2003. Dielectric-barrier discharges: their history discharge physics, and industrial applications. Plasma Chem Plasma Process. 23(1):1–46. doi:10.1023/A:1022470901385.
- Krstulović N, Labazan I, Milošević S, Cvelbar U, Vesel A, Mozetič M. 2006. Optical emission spectroscopy characterization of oxygen plasma during treatment of a PET foil. J Phys D: Appl Phys. 39(17):3799. doi:10.1088/0022-3727/39/17/014.
- Kuchenbecker M, Bibinov N, Kaemlimg A, Wandke D, Awakowicz P, Viöl W. 2009. Characterization of DBD plasma source for biomedical applications. J Phys D: Appl Phys. 42(4):045212. doi:10.1088/0022-3727/42/4/045212.
- Liao X, Cullen PJ, Liu D, Muhammad AI, Chen S, Ye X, Wang J, Ding T. 2018. Combating Staphylococcus aureus and its methicillin resistance gene (mecA) with cold plasma. Sci Total Environ. 645:1287–1295. doi:10.1016/j.scitotenv.2018.07.190.
- Liao X, Liu D, Xiang Q, Ahn J, Chen S, Ye X, Ding T. 2017. Inactivation mechanisms of non-thermal plasma on microbes: a review. Food Control. 75:83–91. doi:10.1016/j.foodcont.2016.12.021.
- Liu T, Zeng Y, Xue X, Sui Y, Liang Y, Wang F, Feng F. 2021. He-plasma jet generation and its application for E. coli sterilization. J Spectrosc. 2021:1–10. doi:10.1155/2021/6671531.
- Lommatzsch U, Pasedag D, Baalmann A, Ellinghorst G, Wagner HE. 2007. Atmospheric pressure plasma jet treatment of polyethylene surfaces for adhesion improvement. Plasma Process Polym. 4(S1):1041–1045. doi:10.1002/ppap.200732402.
- Mai-Prochnow A, Clauson M, Hong J, Murphy AB. 2016. Gram positive and Gram negative bacteria differ in their sensitivity to cold plasma. Sci Rep. 6(1):1–11. doi:10.1038/srep38610.
- Misra N, Roopesh M. 2019. Cold plasma for sustainable food production and processing. Green food processing techniques. UK: Academic Press; pp. 431–453.
- Murray CJ, Ikuta KS, Sharara F, Swetschinski L, Aguilar GR, Gray A, Han C, Bisignano C, Rao P, Wool E. 2022. Global burden of bacterial antimicrobial resistance in 2019: a systematic analysis. The Lancet. 399(10325):629–655. doi:10.1016/S0140-6736(21)02724-0.
- Nicol MJ, Brubaker TR, Honish BJ, Simmons AN, Kazemi A, Geissel MA, Whalen CT, Siedlecki CA, Bilen SG, Knecht SD. 2020. Antibacterial effects of low-temperature plasma generated by atmospheric-pressure plasma jet are mediated by reactive oxygen species. Sci Rep. 10(1):1–11. doi:10.1038/s41598-020-59652-6.
- Niemira BA, Boyd G, Sites J. 2018. Cold plasma inactivation of Escherichia coli O157: h7 biofilms. Front Sustain Food Syst. 47. doi:10.3389/fsufs.2018.00047.
- Niveditha A, Pandiselvam R, Prasath VA, Singh SK, Gul K, Kothakota A. 2021. Application of cold plasma and ozone technology for decontamination of Escherichia coli in foods-A review. Food Control. 130:108338. doi:10.1016/j.foodcont.2021.108338.
- Pancheshnyi S. 2006. Comments on ‘Intensity ratio of spectral bands of nitrogen as a measure of electric field strength in plasmas’. J Phys D: Appl Phys. 39(8):1708. doi:10.1088/0022-3727/39/8/N01.
- Paris P, Aints M, Valk F, Plank T, Haljaste A, Kozlov KV, Wagner HE. 2005. Intensity ratio of spectral bands of nitrogen as a measure of electric field strength in plasmas. J Phys D: Appl Phys. 38(21):3894. doi:10.1088/0022-3727/38/21/010.
- Paris P, Aints M, Valk F, Plank T, Haljaste A, Kozlov KV, Wagner HE. 2006. Reply to comments on ‘Intensity ratio of spectral bands of nitrogen as a measure of electric field strength in plasmas’. J Phys D: Appl Phys. 38(21):3894. doi:10.1088/0022-3727/38/21/010.
- Patinglag L, Melling LM, Whitehead KA, Sawtell D, Iles A, Shaw KJ. 2021. Non-thermal plasma-based inactivation of bacteria in water using a microfluidic reactor. Water Res. 201:117321. doi:10.1016/j.watres.2021.117321.
- Pitchford CL. 2013. GEC plasma data exchange project. J Phys D: Appl Phys. 46(33):330301. doi:10.1088/0022-3727/46/33/330301.
- Simões M, Simões LC, Vieira MJ. 2010. A review of current and emergent biofilm control strategies. Food Sci Technol. 43(4):573–583. doi:10.1016/j.lwt.2009.12.008.
- Svarnas P, Spiliopoulou A, Koutsoukos PG, Gazeli K, Anastassiou ED. 2019. Acinetobacter baumannii deactivation by means of DBD-based helium plasma jet. Plasma. 2(2):77–90. doi:10.3390/plasma2020008.
- Todorova Y, Benova E, Marinova P, Yotinov I, Bogdanov T, Topalova Y. 2022. Non-thermal atmospheric plasma for microbial decontamination and removal of hazardous chemicals: an overview in the circular economy context with data for test applications of microwave plasma torch. Processes. 10(3):554. doi:10.3390/pr10030554.
- Zaplotnik R, Primc G, Vesel A. 2021. Optical emission spectroscopy as a diagnostic tool for characterization of atmospheric plasma jets. Appl Sci. 11(5):2275. doi:10.3390/app11052275.
- Zhu Y, Li C, Cui H, Lin L. 2020. Feasibility of cold plasma for the control of biofilms in food industry. Trends Food Sci Technol. 99:142–151. doi:10.1016/j.tifs.2020.03.001.
- Zimmermann J, Shimizu T, Schmidt H, Li Y, Morfill G, Isbary G. 2012. Test for bacterial resistance build-up against plasma treatment. New J Phys. 14(7):073037. doi:10.1088/1367-2630/14/7/073037.
- Ziuzina D, Boehm D, Patil S, Cullen P, Bourke P. 2015. Cold plasma inactivation of bacterial biofilms and reduction of quorum sensing regulated virulence factors. PLoS One. 10(9):e0138209. doi:10.1371/journal.pone.0138209.