
 ?Mathematical formulae have been encoded as MathML and are displayed in this HTML version using MathJax in order to improve their display. Uncheck the box to turn MathJax off. This feature requires Javascript. Click on a formula to zoom.
ABSTRACT
The combined inherent residual stress (RS) from manufacturing and in-service loading acted on a bent pipe which could be exerted from the fluid flow and/or thermal loading, a common situation faced by main steam pipes in high temperature plants, needs to be considered to understand their overall impact on the integrity of the pipe. The geometrical influence on a bent pipe’s stress distribution was investigated using a combined RS – Fluid-Structure Interaction (FSI) finite element analysis approach. The reduced stresses along the pipe derived from the room temperature RS-FSI simulation and analysis demonstrated the impact of the fluid and structure interaction, particularly at the locations where geometry varied. A substantial reduction in the stress level observed, especially at the extrados where wall thinning was detected. The combined RS-FSI analysis therefore offers a more realistic approach in predicting a safe allowable stress, thus the integrity or life of bent pipes.
Introduction
Bent pipes in a boiler piping system are often preferred than welded pipes in order to maintain the uniform flow of steam (fluid). Cold, warm and induction bending are the three widely used processes to manufacture pipe bends. The bending process which will be dependent on the applications and needs should be carefully controlled in conjunction to its degree of bending such as bent angles/directions, thinning [Citation1], ovality [Citation2,Citation3], plastic deformation [Citation4], as well as thermal effects [Citation5,Citation6]. Bending process inevitably will introduce residual stress (RS) in the deformed pipes [Citation7,Citation8]. An inherent RS from the manufacturing [bending) process has been considered as a very important contributing factor in the bent pipe’s integrity therefore life. Citation7,have reported that cracks were detected in feeder bends, at the locations of high RS as at the outside surface of the bend extrados and inside surface of the bend flanks which at an approximately 60º angle from the intrados symmetry plane [Citation7]. Many reported studies on bent pipes and RS generation both experimentally and numerically (using finite element analysis, FEA] considered a static loading condition [Citation3]. There are also reported studies that considered both structural and temperature loading [Citation2,Citation5], and those that considered the dynamic flows of a fluid in a piping system [Citation9,Citation10, Citation11] .
The later studies employed a FE Fluid-Structure Interaction (FSI) analysis. The fundamental rationale of applying this approach is that fluid flows at a certain velocity inside a pipe could exert pressure and/or thermal loads on the structure, such as conditions that are experienced by main steam piping systems in high temperature applications e.g. in power plants. In FSI simulation and analysis, a transfer of momentum and forces between a pipeline and fluid are taken into consideration [Citation12,Citation13].
[Citation14] Demonstrated that an FSI analysis could be used to study the integrity of a welded pipe that experienced a flow-accelerated corrosion wall thinning. The FEA considered the temperature effect on RS from the welding process, the flow and mass transfer on a pipe and wall thinning [Citation14]. Whilst [Citation15], have studied the influence of entrapped fluid and RS from a fused filament fabrication (FFF) process on impact behaviours of cylindrical nylon specimens [Citation15]. They implemented the coupled effects of RS and FSI in their FEA to derive the dynamic load bearing characteristics of the specimens [Citation11].
With the understanding of its potential for a structural integrity assessment, the combined manufacturing RS, in-service loading from the static and fluid motion, and the ovality of a bent pipe using the FEA approach was investigated and reported in this paper. With bent pipes, it is expected that variation in geometry (e.g. wall thinning at the extrados location) along the pipes would influence the fluid motion. Data from published literatures were used as the reference for the 3D bent pipe’s model i.e. the geometry and material behaviour as well as to verify each of the model (RS-only model and FSI-only model) before performing the combined RS-FSI FE simulation and analysis.
FE modelling and simulation
ASME BPVC.II.D.M [Citation16] was referred for A106-Gr.C steel pipe properties. At room temperature, an elastic-plastic isotropic hardening model is shown in , where the material properties shown in were derived.
Figure 1. Room temperature true stress – strain curve for A 106 – Gr. C steel pipe [Citation16]
![Figure 1. Room temperature true stress – strain curve for A 106 – Gr. C steel pipe [Citation16]](/cms/asset/485f10ee-005f-478c-925d-e3658b559d70/ymht_a_1971358_f0001_c.jpg)
Table 1. Material properties and dimension of A106 – Gr.C steel pipe
Residual stress analysis
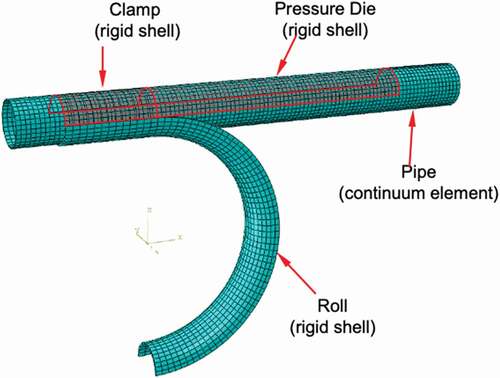
A cold bending process of a pipe was modelled using ABAQUS/Explicit version 6.14–1 [Citation17] [Citation18]which is represented in . The analysis was carried out in two steps.
Figure 2. 3D FE model for a pipe bending simulation
Step 1:
Contacts between pipe and clamp, pressure die and roll were modelled with a friction coefficient of 0.1 and 0.4, respectively.
The pipe and the clamping beam were modelled using C3D8 continuum elements and R3D4 rigid elements of ABAQUS, respectively. Whilst R3D4 elements were used in modelling the clamp, die and pressure die. One element was set through the thickness of the pipe and the element size along the pipe was 0.06 m. A mesh convergence analysis was conducted for the three element sizes of 0.03, 0.06 and 0.1 m along the pipe to find an optimal mesh size for the pipe bending simulation. The stress versus strain curve showed a good convergence when the element size of 0.06 m was selected along the pipe.
To allow movement with the roll around the same centre, the clamp was connected to the roll by ABAQUS beam connector.
Step 2:
A Contact pair between the pressure die and pipe was progressively removed for RS analysis. A viscous pressure of {pcd} was applied on the pipe to reach a quasi-static equilibrium quickly, where a dilatational wave speed, cd is expressed in Equation 1 [Citation17] as follows:
ABAQUS/Explicit setting option [Citation17] was utilised to import the coefficient of viscous pressure, cν into a viscous pressure loading. To minimise ongoing dynamic effects, cν is kept to a small value of 0.4MPa.s/m.
The asymmetrical 3D FE model and simulation which was performed for room temperature conditions was verified by comparing stresses as a function of a circumferential angle obtained from the FEA against the published measured stresses from Citation3, at the Apex location (as indicated in ). The geometric non-linearity was considered in the simulation but the heat effect generated during the deformation simulation was not. () then show that the stress profiles for both the FEA and the experiment were in a good agreement. The stress measurement was done at 1 mm from the external and internal surfaces of the pipe by Citation3. Whilst the FE results were taken from nodes at the external and internal surfaces of the pipe. For the purpose of comparative study, the specified Young’s modulus, E of the material from [Citation3] was inputted instead of the E from the material database in . The E value was 207.5GPa.
Figure 3. (a) A representation of the measured bent pipe [Citation3], (b) axial stress plot, and (c) hoop stress plot as a function of a circumferential angle at the Apex location from both the FEA and the measurement data
![Figure 3. (a) A representation of the measured bent pipe [Citation3], (b) axial stress plot, and (c) hoop stress plot as a function of a circumferential angle at the Apex location from both the FEA and the measurement data](/cms/asset/330ccbd2-327d-4bb3-8581-ec238fece4d3/ymht_a_1971358_f0003_c.jpg)
Furthermore, the wall thickness of the pipe following the bending process simulation from the FEA was compared in with the published thickness measurements at sections A and B that were referred in (). In (), a 3D representation of the cross-section with wall thickness variation at the bend from the FE simulation was presented. A maximum von-Mises stress of 650MPa from the RS-only FE simulation was determined )
Figure 4. (a) A 3D representation of the simulated cross-section of the bend pipe from location section A (shown in ), (b) a von-mises-stress contour of the bent pipe from the RS-only FE simulation
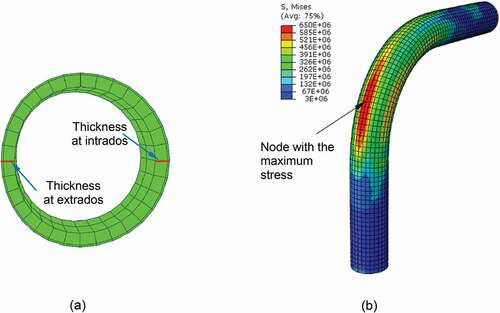
Table 2. FEA simulation and experimental wall thinning data comparison
Fluid-Structure Interaction Analysis
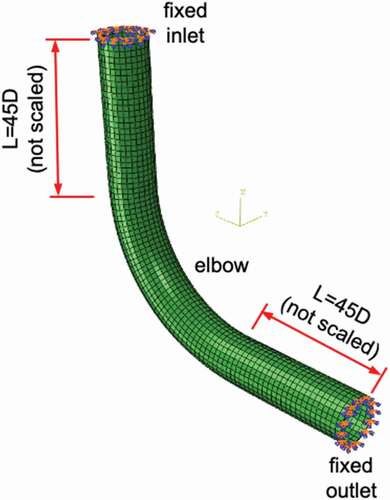
shows the fluid parameters incorporated in the fluid model for the FSI analysis. For model verification purposes, the parameters and assumptions were chosen in accordance to the published work and data of Citation9. A 45-pipe diameter, D at distance, L from the elbow was needed to eliminate the elbow effects on fluid velocity profiles. Therefore L = 45D, as shown in . The following assumptions were applied: (1). incompressible and Newtonian; (2). a no-slip/no-penetration condition on the wall [Citation9].
Table 3. Fluid parameters
Figure 5. FE model representation for the FSI analysis
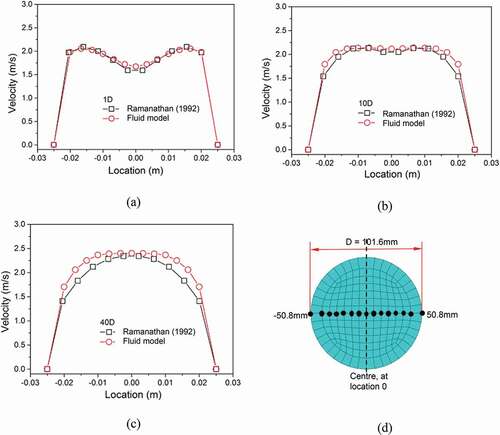
The 3D FSI analysis and the published experimental data [Citation9] were compared with respect to the velocity profiles obtained at different length/distance from the elbow (at L = 1D, 10D, and 40D) on the pipe section. These are represented in . The velocity profiles of the FSI analysis are in relatively good agreement with the published experimental results.
Figure 6. Velocity profile comparison at (a) L = 1D, (b) L = 10D, and (c) L = 40D from elbow. The reading was taken from black dot nodes shown in (d) pipe cross section
Discussion
For a combined RS-FSI finite element analysis, the RS outputs from the pipe bending FEA were inputted into the 3D FE model by utilising initial conditions setting option in ABAQUS. The detailed geometry and material properties of the bent pipe were kept in accordance to . The fluid parameters and assumption for the FSI analysis followed those used in the fluid model. The combined RS-FSI FE analysis was also conducted at the room temperature.
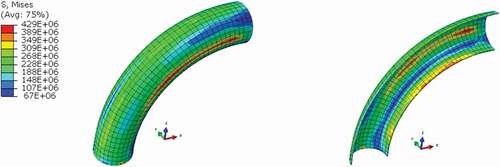
showed the stress distribution (von-Misses contour) along the bent pipe without the fluid flow consideration and without the initial RS, respectively. Meanwhile, shows the contour when initial RS was added to the model, hence the combined RS-FSI model.
Figure 7. Stress distributions (von Mises-contour) on the bent pipe (unit: Pa) from the RS-only FE analysis (without the fluid flow consideration)
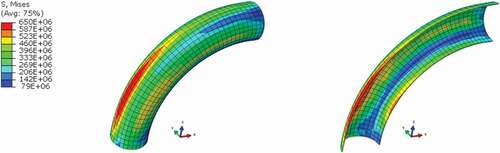
Figure 8. Stress distributions (von Mises-contour) on the bent pipe (unit: Pa) from the FSI-only FE analysis (without the initial RS)
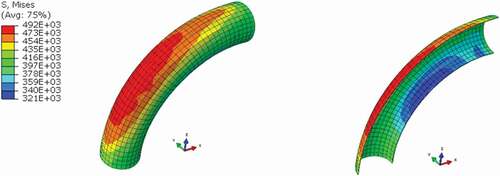
Figure 9. Stress distributions (von Mises-contour) on the bent pipe (unit: Pa) from the combined RS-FSI FE analysis
The RS-FSI analysis results in reduced stress level along the bent pipe when compared to the RS-only FE analysis. represents the stress comparison at the extrados, intrados and the flank which is the location at the centre of the bent pipe or elbow that were determined from the RS-only, FSI-only and RS-FSI finite element analysis.
Table 4. Comparison of stresses at the extrados and intrados locations of the bent pipe (all stresses are in MPa)
The FEA showed similar stress levels at the outside and inside of the pipe at the extrados, intrados, and flank. The RS-only FEA and FSI-only FEA determined relatively higher stresses at the extrados compared to those at the intrados and flank. Although, the maximum von-Mises stress obtained from the FSI-only FEA was several orders of magnitude lower than the maximum stress from the RS-only FEA. For example, from the outside of the extrados, the stress obtained from the RS-only FEA was approximately 650MPa whilst the stress of 0.492MPa was determined from the FSI-only FEA. When applying the combined RS-FSI FEA, the results indicated the opposite, i.e. a lower stress level at the extrados than at the intrados and flank.
The analysis results suggest that the pressure exerted by the fluid that flows inside the pipe alone would have only a small impact in the local stress generation and magnitude outside and inside the bent pipe without the presence of the RS generated from the cold bending process. The analysis also showed that there was a significant reduction in stress level as a result of the FSI analysis integration. The wall shear effect which is considered in this constitutive modelling approach is thought to contribute to this reduction in stress level. Further study is therefore required to confirm if this is the case.
Conclusion
Coupling the FSI analysis onto a structural loading analysis will allow for other than the structural loading/stress from the fluid pressure application to be accounted for. The other loadings/stresses are loadings/RSs generated from the manufacturing process, thermal loading, and the dynamic loading. As reported in this paper, introducing RSs into a 3D FE FSI model has allowed for more realistic prediction of the stress level along a bent pipe.
There was an agreement from both the RS-only FE and the experimental analysis that the high stress level at the outside surface of the bent extrados and at the inside surface of the bent flanks were observed as a result of wall thickness variation (wall thinning). The stress level determined from the RS-FSI FEA showed to be much lower than the stress level derived from the RS-only analysis. A wall shear effect could have been the reason why this occurred especially at the locations where the geometry changed the most, i.e. at the extrados. This shows that the fluid and structure interaction on the surface of component has an impact in the stress prediction. It is a challenge to determine the stress level along the bent pipe when fluid flows experimentally, which would be useful in order to verify the current FEA results.
From piping manufacturing point of view, the combined RS-FSI model can be used for example to control the degree of bending (angles and orientation), geometry (wall thickness), deformation, and heat treatment (temperature) to ensure that applied or in-service stresses will still be within the safe allowable/design requirements [depending on applications and needs). The analysis could provide the indication whether a stress relaxation could have taken place. When this happens, it could affect the integrity of the bent pipe one way or another. The pipe’s wall thickness and ovality as well as the fluid velocity which could be monitored can also be used as inputs for the model and utilised in the life assessment of the component for example when predicting the effect of flow-assisted corrosion.
Although currently, the reported work considers only static loading analysis, it is understood that the methodology can be adapted for fatigue of the piping system as demonstrated by 18, in their aircraft’s hydraulic pipe fatigue analysis. Nevertheless, through this study, the potential of the combined RS-FSI FE analysis approach for assessing the structural integrity of a piping system including a main steam piping system and for life prediction has been demonstrated.
Disclosure statement
No potential conflict of interest was reported by the author(s).
References
- Karthikeyan M, Jenarthanan MP. Experimental study of wall thinning behaviour in boiler pipes during bending process. Aust J Mech Eng. 2020;18(sup1):S88–S94. [Viewed on 16 January 2021].
- Li W, Yao YL. Laser bending of tubes: mechanism, analysis, and prediction. J Manuf Sci Eng. 2001;123(4):674–681. [Viewed on 16 January 2021].
- Khajehpour S, Yetisir M. Residual stress modelling of pipe bends. Transactions. editor. Toronto: SMIRT 19; 2007. August 2007. [Viewed on 12 January 2021]. https://repository.lib.ncsu.edu/bitstream/handle/1840.20/31023/B05_3.pdf?sequence=1&isAllowed=y
- Tang NC. Plastic-Deformation Analysis in Tube Bending. Int J Press Vessels Pip. 2000;77(12):751–759. [Viewed on 10 January 2021].
- Gwynn-Jones S, Hooman K, Daniel B. Thermal Bending of Air Cooled Tubes. International workshop on thermal forming and welding distortion. Bremen: 2014. 09–10 April 2014, MDPI [Viewed on 15 January 2021]. https://www.researchgate.net/publication/313438542_Thermal_Bending_of_Air_Cooled_Tubes
- Hwang S-Y, Kim M-S, Lee J-H. Thermal Stress Analysis of Process Piping System Installed on LNG Vessel Subject to Hull Design Loads. Journal of Marine Science and Engineering. 20208(11): 926, 1–16.
- Yetisir M, Rogge R, Donaberger R (2005). The Effect of Manufacturing Process on Residual Stresses of Pipe Bends. Proceedings of the ASME 2005 Pressure Vessels and Piping Conference; 6. USA: Materials and Fabrication. Denver, Colorado; 631–637.
- Ding Y, Yetisir M, Khajehpour S (2014). Predictions of Residual Stresses and Deformations in Pipe Bends Produced Using Cold, Warm and Induction Bending Processes. Proceedings of the ASME 2014 Pressure Vessels and Piping Conference; 2, Anaheim, California, USA: Computer Technology and Bolted Joints; https://doi.org/10.1115/PVP2014-28774
- Ramanathan K. Computational Simulation of Flow Through Elbows in the Approach Piping Systems to a Headbox. Kalamazoo, Michigan: MSc degree. Western Michigan University; 1992.https://scholarworks.wmich.edu/cgi/viewcontent.cgi?article=1903&context=masters_theses
- Sreejith B, Jayaraj K, Ganesan N, et al. Finite Element Analysis of Fluid-Structure Interaction in Pipeline Systems. Nucl Eng Des. 2004;227(3):313–322. [Viewed on 10 January 2021].
- Keramat A, Tijsseling AS, Hou Q, et al. Fluid-Structure Interaction With Pipe-Wall Viscoelasticity during Water Hammer. J Fluids Struct.2012;28:435–455
- Sandberg G, Wernberg PA, Davidsson P. Fundamentals of Fluid-Structure Interaction. Sandberg G, Ohayon R, editors. Computational Aspects of Structural Acoustics and Vibration. CISM International Centre for Mechanical Sciences. Vol. 505, Springer Vienna; 2008. https://doi.org/10.1007/978-3-211-89651-8_2
- Zienkiewicz OC, Taylor RL, Fox D. The finite Element Method for Solid and Structural Mechanics. 7th. Butterworth-Heinemann; 2014. ISBN 978–1-85617–634-7.
- Sun L, Ding Y. Fluid-Structure Interaction Analysis for Welded Pipes with Flow-Accelerated Corrosion Wall Thinning. CNL Nuclear Review, 2016;5(1),1–17.
- Sunny S, Chen H, Malik A, et al. Influence of Residual Stress and Fluid–Structure Interaction on the Impact Behavior of Fused Filament Fabrication Components. Addit Manuf.2021;37:101662.
- ASME (2017). ASME Boiler and Pressure Vessel Code, Section II Materials — Part D, ASME (n.d)
- ABAQUS 6.14 (2014]. ABAQUS/Explicit 6.14–1 user’s manual. Hibbitt, Karlsson & Sorensen, Inc.
- Lv H, Qiu YY, Sheng Y. Fatigue Analysis of the Aircraft’s Hydraulic Pipes Based on Fluid–Structure Interaction. Adv Mater Res. 2011;299–300:917–920.