
ABSTRACT
The energy sector will need to employ novel strategies to reduce greenhouse gas emissions, such as the increase of steam temperatures/pressures or the use of low carbon fuels (i.e. biomass). Both cause heat exchanger materials’ degradation issues, due to the formation of more/different corrosive deposits, which requires the use of expensive nickel-based materials or coatings. This paper focuses on the behaviour of three different coatings (HVOF NiCrFeSi, laser clad FeCrAl and Laser Clad NiCrFeSi) deposited on TP347HFG, at 700°C (up to 1000 h exposure). Tests were performed using the ‘deposit recoat’ method (KCl deposit) in simulated biomass combustion environments. Cross-sections were analysed using dimensional metrology, to determine distributions of metal loss and internal damage. Intergranular damage and pits were identified using SEM/EDX. A ‘diffusion cell’ behaviour was observed, which led to depletion of alloying elements from the coating and consequent increase in damage. The results suggested a severe degradation of all coatings.
Introduction
To address the challenge of climate change, future energy systems need to have reduced greenhouse gas emissions [Citation1–6], and as solid fuel fired power generation systems operate within the context of competing environmental, technical, regulatory and economic pressures, use of biomass in coal-fired plants has been the first step into greener energy production [Citation7–9]. However, legislative frameworks are placing ever stricter limits on SOx, NOx and CO2 emissions, and systems solely fired on biomass are being encouraged by regulatory actions in some countries to meet CO2 reduction targets [Citation10–15].
Combustion systems fired solely on biomass are typically much smaller (<50 MWe) than coal-fired plant (>500 MWe) [Citation16,Citation17], though larger systems have been developed [Citation18] or are under development [Citation19]. The use of biomass for combustion exposes the superheaters and reheaters to deposits with chemical compositions richer in chlorides than coal-fired systems (due to the higher Cl/S ratio of biomass fuels) [Citation20,Citation21]. These deposits could produce a more corrosive environment on the superheaters/reheaters [Citation22–27], and as a result, to maintain components' lives, most biomass plants use lower steam temperatures (and pressures), and hence achieve lower energy conversion efficiencies [Citation28].
There are several ways to overcome the decrease in steam temperature and pressure. One is to use more expensive Ni-based alloy [Citation29]. It has been shown that IN740H has the potential to withstand a biomass combustion environment at 700°C, showing damage similar to what is already seen for biomass co-firing [Citation29,Citation30]. Although very resistant to corrosion, Ni-based alloys are usually more expensive than steels. To decrease the costs, the use of corrosion protective coatings has been proposed for solid fuel firing environments at different temperatures [Citation31–33]. In these studies, different coating compositions, showing promising results for biomass exposure at 600°C for 72 h using Ni-Al-based coatings [Citation33] Other studies have pushed to higher temperature (800°C) but in co-firing simulated environments [Citation31].
This work focuses on assessing the viability of using different types of metallic coatings on a stainless steel (TP347HFG) in biomass simulated firing conditions. Three different types of coating chemistries were assessed (two different NiCrFeSi and one FeCrAl). One NiCrFeSi and the FeCrAl were deposited through laser clad. For the NiCrFeSi coating, a high-velocity oxy-fuel deposition method was also used, to assess the difference in terms of coating techniques.
Materials and methods
Heat exchanger materials
This study focusses on three different coatings, NiCrFeSi and FeCrAl, deposited through laser clad, and a NiCrFeSi deposited through HVOF (). The coatings were deposited on TP347HFG substrate, a steel that could be used in superheaters/reheaters (). The samples came from tube segments, which were subsequently cut into specimens (). The typical dimensions of specimens were ∼15 mm long and wide with a ∼4 mm wall thickness.
Figure 1. Examples of tube segments used for corrosion exposures, the samples are about 15 mm x 15 mm, with 4 mm thickness.
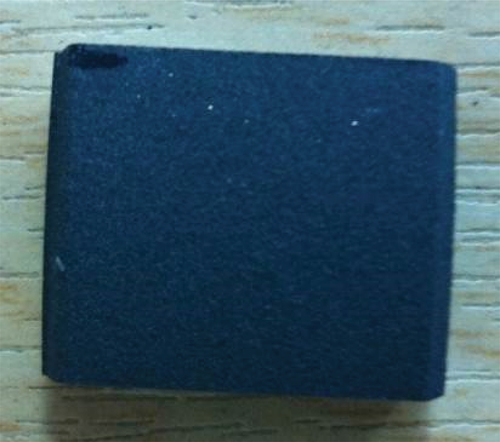
Table 1. Nominal composition of TP347HFG base alloy (wt%).
Table 2. Nominal composition of the three different coatings used for the study.
Environment simulation
Fireside corrosion tests were carried out in alumina-lined, controlled-atmosphere, vertical tube furnaces () for 1000 h exposure, in cycles of 200 h, using the deposit recoat technique [Citation19,Citation20]. Samples were accommodated in alumina crucibles. Samples were cleaned with acetone and then IPA in an ultrasonic bath for 10 minutes each prior to exposure. Dimensional metrology was carried out on the clean samples using a digital micrometre (resolution of 1 μm) before exposure. The deposit was applied with a brush paint to give coverage of ∼20 mg/cm2 of dried deposit (deposit composition 100% KCl). This was done to simulate the deposit formation following biomass firing, however the exact exposure conditions were chosen to accelerate the fireside corrosion processes. The acceleration of the fireside corrosion processes has been done using higher fluxes. The application of the deposit was repeated every cycle. Sample weight was measured before and after every cycle for samples and crucibles, this was done mainly for tracking the samples inside the furnace, since weight change data make it more difficult to quantify the extent of the internal damage or spallation effects. Deposit-free samples were exposed to provide a baseline reference that is needed for the analysis of the dimensional metrology data (details in the following section).
Figure 2. Rig layout for fireside corrosion tests [Citation20].
![Figure 2. Rig layout for fireside corrosion tests [Citation20].](/cms/asset/c63d03a5-dd65-452f-922c-684097d910e9/ymht_a_2188351_f0002_c.jpg)
Gases were supplied to the testing furnace through mass flow controllers (flow rate of 100 cm3/min), to achieve the desired gas compositions (). The addition of moisture was done by injecting water into the furnace using a peristaltic pump.
Table 3. Inlet gas composition used for fireside corrosion tests.
Analytical techniques
To analyse the samples after exposure, cross-sections were made. To avoid loss of deposit/scale, samples were cold mounted. The mounting was performed using glass ballotini mixed with a low shrinkage epoxy resin. Samples were cured for 24 hours and then they were cut, ground and polished down to a 3-µm diamond suspension in an oil-based medium. Scanning electron microscopy (SEM) has been used to analyse the sample microstructures and the scales. Energy dispersive X-ray spectroscopy (EDX) was used to assess scale growth processes and scale/deposit/gas interactions.
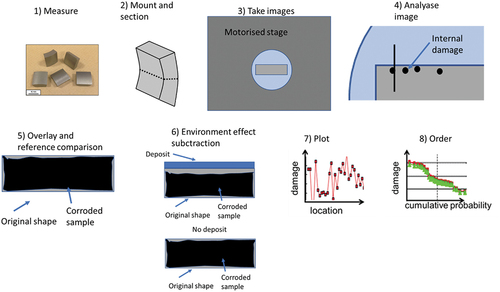
Dimensional metrology was used to generate the statistical distributions of coating corrosion damage data for each exposed sample [Citation29–31]. A microscope was used to collect images around the cross-sections. The images were then measured with an image analyser to collect x-y coordinates of the remaining coating. The data were compared to the pre-exposure metrology data collected to determine the coating performance. The cumulative probability curves were obtained by ordering the data before plotting. A schematic diagram of the process is given in .
Figure 3. Schematic representation of the dimensional metrology process. The process consists of several steps 1) measurement of samples prior to exposure, 2) mount the samples in resin, 3) image of samples’ perimeter, 4) select points at metal’s surface and for internal damage, 5) comparison with pre-exposure measurements and reference samples, 6) subtraction of the environment effect by comparison to a sample without deposit, 7) plot of the resulting change in metal against location and 8) re-order of the data based on cumulative probability.
Fireside induced corrosion damage of the coated samples is presented as ‘coating change’ (negative number showing the amount of coating lost) as a function of cumulative probability. The cumulative probability distribution datasets were produced in line with the current standards for high-temperature corrosion assessment [Citation34]. The use of these statistical methods for analysing corrosion data is becoming more widespread and provides a good basis for corrosion model development and validation [Citation35–37].
Results
Dimensional metrology
The results of this work are presented in this section. The first part will present results for the dimensional changes of the samples. Typical dimensional changes are presented in , which shows different types of behaviour. On the right hand side of the graph (above 80% probability), there is a ‘steep’ section of slope indicating areas with the lowest coating loss; areas that have undergone slower corrosion than the average. In these regions, there are small portions of the coating that have damage of as low as about −700 μm.
Figure 4. Cumulative distribution of coating change for NiCrFeSi deposited through laser clad after 1000 h exposure.
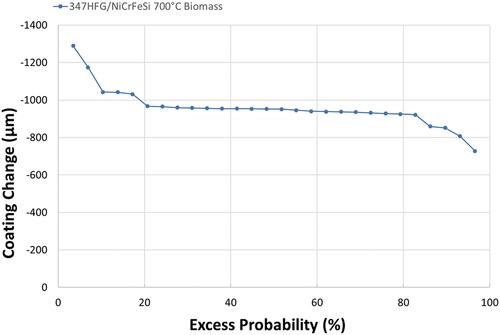
The majority of the chart (from about 80% to about 20%) shows a second section that is almost parallel to the X-axis of the graph, with a coating change of approximately −950 μm. This type of behaviour is typical of ‘uniform’ damage around the sample; approximately 60% of the surface has this extent of coating loss.
The last (left hand) section of the graph, from about 20% down, shows another steep variation towards higher damage. This type of behaviour is typical of localised damage. Analysing these data points more closely, and comparing the results with the median thickness of the coating before exposure (), it can be seen that a small part of the sample (about 3%; extreme left datapoint) shows a remaining thickness less than half of the original thickness (about 1500 μm, about 37% of the original thickness).
In summary, there is a probability of about 97% that the coating will lose −700 μm or more under these conditions over 1000 hours exposure. The median change observed for this coating (NiCrFeSi deposited via laser clad) corresponds to −950 μm, which is more than half of the original coating thickness. The graph also shows that almost 60% of the sample shows this amount of change. Looking at the highest damage, observed for a small part of the sample’s surface (about 2–3%), virtually no coating is left on the surface (a loss of about −1300 μm).
Microscopy
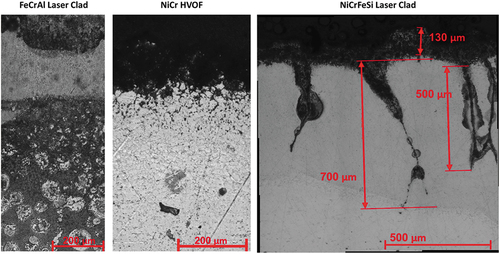
The cumulative probability plot shown in shows only the data for one of the coatings (NiCrFeSi deposited with laser clad). This is because, using optical microscopy, it was not possible to distinguish between substrate and coating for the samples NiCrFeSi HVOF and FeCrAl. The samples were prepared from tube sections, with only one, the top side, coated. This makes it difficult to extract dimensional data from the samples. The complete loss of coating is highlighted by the images in . From left to right, the figure shows three different alloys/coating combinations, FeCrAl laser clad, NiCrFeSi HVOF and NiCrFeSi laser clad, respectively. As can be seen from the optical micrographs, three different microstructures were observed. In the first two images from the left (FeCrAl Laser Clad and NiCrFeSi HVOF, respectively) it is not possible to clearly differentiate the coating microstructure, or an interface between coating and base alloy. In the image on the right hand side (NiCrFeSi laser clad), on the contrary, an interface can be seen, highlighting the presence of the coating on the base alloy. From this figure, it can also be seen that the NiCrFeSi laser clad shows signs of pitting type of corrosion; this is in line with observations from dimensional metrology (). Furthermore, a porous area can be seen on the top surface of the coating, this should correspond to a scale/deposit layer.
Figure 5. Optical micrographs of the three different coatings after 1000h exposures.
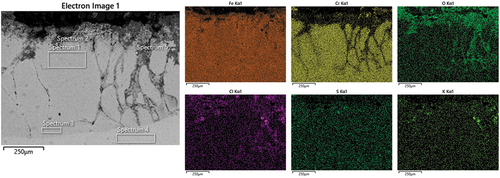
Further microstructural analysis was performed through SEM/EDS on all three coatings. The first sample reported is the NiCrFeSi HVOF. shows a SEM micrograph with EDS maps for the NiCrFeSi HVOF sample. As can be seen, a thick scale/deposit layer was observed on the surface of the sample. From the maps, it can be noted that the outer layer of the scale was composed of a mixed Ni-Fe rich oxide (presence of Cr has also been found). This was followed by a Ni-rich oxide, then a Fe-rich oxide, while the innermost layer was composed of a Cr-rich oxide. It could also be noted that the K is spread in the entire outer layer and then concentrates above the Cr-rich oxide, where it appears to be coupled with S, probably as potassium sulphates (O presence has been found in the entire cross-section). Cl presence appears to be dissociated from K. The K could have reacted with the S present in the gas environment to form K2SO4 and released the Cl- able to react and form HCl, which could have evaporated [Citation38].
Figure 6. SEM micrograph with EDS maps of the scale on the NiCrFeSi HVOF coating after 1000h exposure.
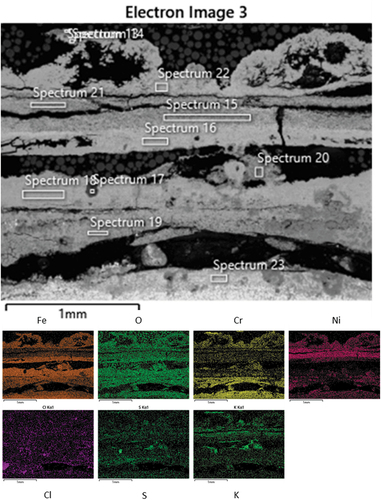
() shows the chemical composition (wt%) obtained from the spectra in . The table confirms what has already been highlighted by the EDS maps. The major highlights are the presence of S and K rich particles inside the scale (about 14.7 wt% and 13 wt%, Spectrum 17, ), which shows also the contemporary presence of O (55.5 wt%) and Ni (11.5 wt%). K is also present in other parts of the scale (Spectra 13, 15, 20 and 21). These regions are mostly in the outer part of the scale, indicating that the K was not able to diffuse through the scale, but the simultaneous absence of Cl, also shows that is not present anymore as KCl. This could have freed the Cl to react and form HCl, which could evaporate from the scale/deposit. Another behaviour observed in the literature [Citation39] is also the formation of Fe-Cl complex, which could have helped the diffusion of Fe from the alloy to form Fe-rich oxide at the gas–scale interface. This is usually coupled with the formation, for example, of K-Cr-O (Spectra 13 and 19) compounds, and the presence of pits (pits not observed in this case). The absence of pits in this case, could be due to the fact that the corrosion attack is fully developed. The presence of K- and Ni-rich areas has been observed as well (Spectrum 17, ), this could be due to the formation of K-Ni trisulphates, which has been documented in the literature [Citation40].
Table 4. Elemental composition (wt%) from EDS spectra collected from .
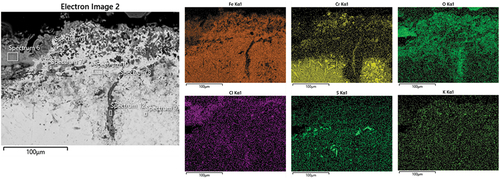
The metal surface has also been analysed (). As it can be seen from the EDS maps, there is the presence of Cl-rich particles at the interface, suggesting the migration of some of the Cl from the deposit to the metal surface. This is not coupled with the diffusion of K, confirming the dissociation of the KCl deposit observed in the scale/deposit layer ( and ). At the same time, it can note an enrichment in Cr at the interface where O is also present, suggesting the formation of a Cr-rich oxide. The same region seems to show a low concentration of Fe.
Figure 7. SEM micrograph with EDS maps of NiCrFeSi HVOF coating after 1000h exposure.
The features observed in the elemental maps are confirmed by the spectra collected (). It seems that the presence of K is negligible at the metal surface. It also highlights some depletion of Cr below the surface (Spectrum 25, ), in respect to the amount in the bulk alloy (Spectrum 26 ). This region corresponds to an internal corrosion attack.
Table 5. Elemental composition (wt%) from EDS spectra collected from .
Looking closer at the internal corrosion area () it can be seen how this is characterised by a grain boundary type of attack. From the EDS maps in it can be seen how this internal corrosion area is characterised by a depletion of Fe at the grain boundaries, where an oxide is formed. Some traces of Cl and S appear to be present below the metal surface. The grain boundaries attack is responsible for a ‘diffusion cell’ type of behaviour, which has been reported already in the literature for coatings [Citation41].
Figure 8. SEM micrograph with EDS maps of NiCrFeSi HVOF coating after 1000h exposure at higher magnification.
reports the elemental composition of the spectra collected at several locations of . Spectra 34 and 35 reports the composition of the corrosion products around the grain boundaries. It can be seen by the spectra that those areas are depleted in Fe, while maintaining the same amount of Cr and higher O and Cl content. This could suggest the formation of Cr-rich oxide, which could stop the diffusion of alloying elements from the bulk of the alloy to the surface. This could translate into the lack of Cr available to form a protective oxide. Spectra 29, 30 report the composition of different grains close to the metal surface, which are either fully enclosed in the corrosion product or not fully enclosed in the corrosion product, respectively. From these values, it can be seen how the Cr content of the fully enclosed grain is lower than that of the rest of the alloy (16 wt% and 18 wt% respectively). This is in agreement with the idea that corrosion products stop Cr diffusion from the alloy, leaving the grain below the metal surface depleted in Cr.
Table 6. Elemental composition (wt%) from EDS spectra collected from .
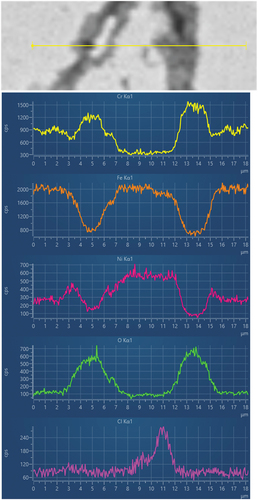
shows the line scans collected from . It can be seen how the line intersects two different corrosion products along the grain boundaries, and how in these areas there is an increase in Cr content, together with O. The concentration of the two elements then falls inside the grain. Opposite behaviour has been observed for Fe.
Figure 9. EDS line scans from location in .
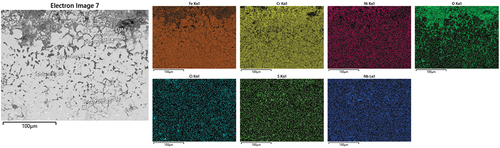
shows the SEM micrograph and EDS maps for the other Ni-based coating, the NiCrFeSi deposited through laser clad. The micrograph confirms what has been seen from the metal change distribution and the optical images () with coating still present on the surface of the alloy. The maps show depletion of Cr from the corroded areas and no evidence of a protective Cr-rich oxide on the surface of the material. On the contrary, it seems that the formation of Fe-rich oxide has been formed on the coating surface and in the internal corrosion areas. The presence of Cl has been observed in these areas as well. This could suggest that Cl could react with Fe to form an Fe-Cl complex, which could then form Fe-rich oxides when in contact with O [Citation40]. Similar behaviour with the formation of pits has already been seen in the literature [Citation38].
Figure 10. SEM micrographs with EDS maps of NiCrFeSi deposited through laser clad after 1000 h exposure.
reports the elemental composition of the spectra collected from . Spectra 1 and 3 report the composition of the coating close to the surface and close to the metal, respectively. From the data, it can be seen that, apart from some trace of Cl and K near the surface, no major difference was recorded. Spectra 2 and 5 report the composition of corrosion products on the metal surface and internal corrosion, respectively. It can be seen how the spectra taken inside one of the pits (Spectrum 5) presents a high concentration of K and Cl (about 20 wt% for both), lower than on the coating surface (Spectrum 4).
Table 7. Elemental composition (wt%) from EDS spectra collected from .
shows a higher magnification of the internal corrosion area. It can be seen how the area below the surface presents signs of oxidation and simultaneous Cr depletion, while it is rich in Fe. It can also be seen how below the depleted zone Cr is forming needle-like type of structure, which is rich in Cr and depleted in Fe. The presence of Cl can also be seen on the coating surface, where Fe is also present. This is in line with what is observed for the NiCrFeSi coating deposited through HVOF ().
Figure 11. SEM micrographs with EDS maps of NiCrFeSi deposited through laser clad after 1000 h exposure, at higher magnification.
shows the elemental composition of the EDS spectra collected from . Spectrum 6 reports the composition of the scale/deposit layer that is mainly composed of Fe, O and Cl. The same type of composition has been found in the internal corrosion areas (Spectrum 7). Spectrum 8 highlights the diffusion of S inside the coating, while the pits show high Cl concentration.
Table 8. Elemental composition (wt%) from EDS spectra collected from .
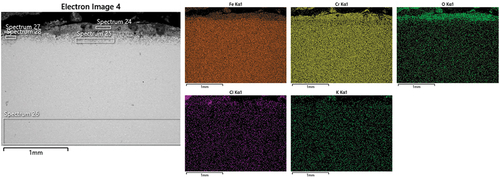
shows the SEM micrographs and EDS maps for FeCrAl deposited through laser clad. It can be seen how a scale has been observed on top of the sample, which is detached from the alloy. This seems to be primarily composed of Fe-rich oxides. Below the surface is an oxygen-rich area, which corresponds to an internal type of corrosion attack.
Figure 12. SEM micrographs with EDS maps of FeCrAl deposited through laser clad after 1000 h exposure.
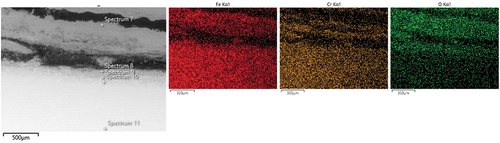
The spectra collected from are reported in . It can be seen how the highest Cr concentration has been found on the inner scale (Spectrum 9) and in the bulk alloy (Spectrum 11), while a depleted zone is observed in the internal corrosion area.
Table 9. Elemental composition (wt%) from EDS spectra collected from .
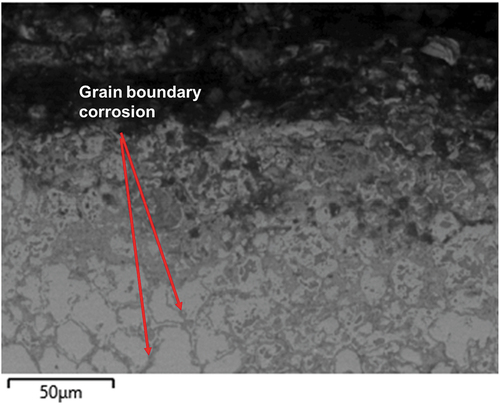
The internal corrosion area seems to show signs of intergranular attack, as shown from . This is in line with what has been observed in , showing internal grain boundary attacks, which could lead to a ‘diffusion cell’ type of behaviour, which could enhance the corrosion attack.
Figure 13. SEM micrograph of FeCrAl deposited through laser clad.
General discussion
From the data reported, it can be seen how the three different coatings studied suffered enhanced corrosion attack, which resulted in internal corrosion and ‘diffusion cell’ type of behaviour. All the three coatings were not able to stop the diffusion of corrosive elements (mainly Cl and K) through the coating thickness, also affecting the substrate alloy. Among the three coatings, the one composed of NiCrFeSi deposited through laser clad seemed to be the only one remaining on the surface of the alloy, although it did suffer the same type of attack. The main reason for the slightly better performance of the NiCrFeSi deposited through laser clad (with respect to the NiCrFeSi deposited through HVOF) could be attributed to the higher thickness of the coating with respect to the same coating deposited through HVOF (1500 μm and 200 μm, respectively, ). On the other hand, the FeCrAl coating had a similar thickness to the NiCrFeSi deposited through laser clad, but it showed a higher amount of damage that can be due to the fact that the high amount of Fe could have led to the formation of a Fe-rich oxide layer. This could have caused the spallation of the oxide layer on the surface, increasing the corrosion damage observed.
Conclusion
This work has presented corrosion behaviour of three different coatings (NiCrFeSi and FeCrAl deposited through laser clad, and a NiCrFeSi deposited through HVOF) in a simulated biomass combustion environment. The three alloys were deposited on a stainless-steel alloy (347HFG) and exposed at a temperature of 700°C for 1000 h, using the deposit re-coat technique. The deposit used for the exposure was composed of KCl.
The samples were analysed through dimensional metrology, SEM and EDS. From the dimensional metrology data, only NiCrFeSi deposited through laser clad showed some coating remaining on the sample after 1000 h exposures. From the SEM and EDS analyses, it has been observed that all the samples showed internal corrosion type of attack along the grain boundaries. These areas are also characterised by depletion of alloying elements (mainly Cr), showing the typical ‘diffusion cell’ type of behaviour.
The best performing coating (NiCrFeSi laser clad) had two main differences with the other two coatings. The difference with NiCrFeSi HVOF is mainly the thickness of the coatings, 1500 μm for NiCrFeSi laser clad and 200 μm NiCrFeSi HVOF. The amount of damage observed to the NiCrFeSi laser clad was 700 μm median value, which is higher than the thickness of the NiCrFeSi HVOF coating. On the other hand, the difference between the FeCrAl and the NiCrFeSi laser clad is mainly due to the higher Fe content of the FeCrAl. From the SEM images, it has been shown that Fe in FeCrAl seems to form an Fe-rich oxide, which could have caused spallation of the oxide layer, exposing the coating/alloy to the deposit.
Acknowledgments
EU Research Fund for Coal and Steel Project RFCS-2015/709954: “Preparation for Commercial Demonstration Plant for 700°C Operation.
Disclosure statement
No potential conflict of interest was reported by the author(s).
Additional information
Funding
References
- The Climate Change Act 2008 (2050 Target Amendment). Order; 2019.
- State of play on the sustainability of solid and gaseous biomass used for electricity, heating and cooling in the EU. Eur Sci J. 2014;DOI:10.1017/CBO9781107415324.004
- Energy-Related products policy framework. UK Department for Business, Energy & Industrial Strategy (BEIS). 2021.
- Froggatt A, Hadfield A. Deconstructing the European energy union: governance and 2030 goals. UK Energy Research Centre; 2015.
- Pye S, Li FGN, Petersen A, et al. Assessing qualitative and quantitative dimensions of uncertainty in energy modelling for policy support in the United Kingdom. Energy Res Soc Sci. 2018;46:332–344.
- Kattirtzi M, Ketsopoulou I, Watson J. Incumbents in transition? The role of the ‘big six’ energy companies in the UK. Energy Policy. 2021;148(Part A):111927.
- Sami M, Annamalai K, Wooldridge M. Co-firing of coal and biomass fuel blends. Prog Energy Combust Sci. 2001;27(2):171–214.
- Khodier AHM, Hussain T, Simms NJ, et al. Deposit formation and emissions from co-firing miscanthus with daw mill coal: pilot plant experiments. Fuel. 2012;101:53–61.
- Hussain T, Khodier AHM, Simms NJ. Co-combustion of cereal co-product (CCP) with a UK coal (daw mill): combustion gas composition and deposition. Fuel. 2013;112:572–583.
- Leprince S, Quadrelli R, Bennett S, et al. Tracking public investment in energy technology research: A Roadmap, IEA, Paris. Int J Energy Res. 2022.
- Fang G, Yang K, Tian L, et al. Can environmental tax promote renewable energy consumption? — an empirical study from the typical countries along the belt and road. Energy. 2022;260:125193.
- Winchester N, Reilly JM. The feasibility, costs, and environmental implications of large-scale biomass energy. Energy Econ. 2015;51:188–203.
- Huang H, Gao Y, Chen H, et al. Biomass briquette fuel, boiler types and pollutant emissions of industrial biomass boiler: a review. Particuology. 2023;77:79–90.
- Rajmohan K, Ramya C, Varjani S. Trends and advances in bioenergy production and sustainable solid waste management. Energy Environ. 2021;32(6):1059–1085.
- Perry M, Rosillo-Calle F. Recent trends and future opportunities in UK bioenergy: maximising biomass penetration in a centralised energy system. Biomass Bioenergy. 2008;32(8):688–701.
- IEA (2007). IEA energy technology essentials - biomass for power generation and CHP, IEA, Paris. High Temp. 1–4. https://www.iea.org/reports/biomass-for-power-generation-and-chp.
- International Renewable Energy Agency. Renewable energy technologies: cost analysis series. International Renewable Energy Agency (IRENA) Copyright IRENA. 2012;1:274.
- Power technology, https://www.power-technology.com/marketdata/gardanne-biomass-power-plant-france/(09 January 2023) 2021.
- Power technology, https://www.power-technology.com/projects/tees-renewable-plant-teesside/( accessed 09.01.23) 2020.
- Jenkins BM, Baxter LL, Miles TR, et al. Combustion properties of biomass. Fuel Process Technol. 1998;54(1–3):17–46.
- Demirbas A. Potential applications of renewable energy sources, biomass combustion problems in boiler power systems and combustion related environmental issues. Prog Energy Combust Sci. 2005;31(2):171–192.
- García R, Pizarro C, Álvarez A, et al. Study of biomass combustion wastes. Fuel. 2015;148:152–159.
- Sharp WBA. Superheater corrosion in biomass boilers: today’s science and technology (ORNL/TM-2011/399). Oak Ridge, Tennessee: Oak Ridge National Laboratory; 2011.
- Nielsen HP, Frandsen FJ, Dam-Johansen K. Lab-scale investigations of high-temperature corrosion phenomena in straw-fired boilers. Energy Fuels. 1999;13(6):1114–1121.
- Nielsen HP, Frandsen FJ, Dam-Johansen K, et al. The implications of chlorine-associated corrosion on the operation of biomass-fired boilers. Prog Energy Combust Sci. 2000;26(3):283–298.
- Frandsen FJ. Utilizing biomass and waste for power production—a decade of contributing to the understanding, interpretation and analysis of deposits and corrosion products. Fuel. 2005;84(10):1277–1294.
- Shao Y, Wang J, Preto F, et al. Ash deposition in biomass combustion or co-firing for power/heat generation. Energies (Basel). 2012;5(12):5171–5189.
- Montgomery M, Jensen SA, Borg U, et al. Experiences with high temperature corrosion at straw-firing power plants in Denmark. Mater Corros. 2011;62(7):593–605.
- Mori S, Sumner J, Bouvet J, et al. Fireside and steamside performance in biomass power plant. Mater High Temp. 2022;39(2):106–121.
- Mori S, Pidcock A, Sumner J, et al. Fireside corrosion of heat exchanger materials for advanced solid fuel fired power plants. Oxid Met. 2022;97(3–4):281–306.
- Hussain T, Simms NJ, Nicholls JR, et al. Fireside corrosion degradation of HVOF thermal sprayed FeCrAl coating at 700-800°C. Surf Coat Technol. 2015;268:165–172.
- Fähsing D, Rudolphi M, Konrad L, et al. Fireside corrosion of chromium- and aluminum-coated ferritic–martensitic steels. Oxid Met. 2017;88:155–164.
- Wu D, Liu S, Yuan Z, et al. Effect of pre-oxidation on high-temperature chlorine-induced corrosion properties of air plasma-sprayed Ni-5%al coatings. J Therm Spray Technol. 2021;30(7):1927–1939.
- Corrosion of metals and alloys - method for metallographic examination of samples after exposure to high temperature corrosive environments. ISO/DIS 26 (2011).
- Meadowcroft DB, Tomkings AB, Grabke HJ, et al. A code of practice for discontinuous corrosion testing in high temperature gaseous atmospheres. Mater Sci Forum. 1997;251–254:973–978.
- Grabke HJ. Guidelines for methods of testing and research in high temperature corrosion EFC 14. London: CRC Press; 1995.
- Stringer J, Wright IG. Current limitations of high-temperature alloys in practical applications. Oxid Met. 1995;44(1–2):265–308.
- Sanusi T, (2021), PhD Thesis, Formation of corrosive compounds from biomass/waste combustion, Cranfield University.
- Folkeson N, Jonsson T, Halvarsson M, et al. The influence of small amounts of KCl(s) on the high temperature corrosion of a Fe-2.25cr-1mo steel at 400 and 500°C. Mater Corros. 2011;62(7):606–615.
- Mayoral MC, Andrés JM, Laguarta S. Evidence of corrosion on metallic surfaces at 500 °C and 560 °C by metal-potassium trisulphate formation in oxy-co-combustion. Fuel. 2016;183:80–89.
- Evans HE, Taylor MP. Diffusion cells and chemical failure of mcraly bond coats in thermal-barrier coating systems. Oxid Met. 2001;55. DOI:10.1023/A:1010369024142