
 ?Mathematical formulae have been encoded as MathML and are displayed in this HTML version using MathJax in order to improve their display. Uncheck the box to turn MathJax off. This feature requires Javascript. Click on a formula to zoom.
ABSTRACT
More than 60 million homes in India are unfit for decent living. Replacing this stock with decent housing will entail significant costs and increase energy consumption and related CO2 emissions due to both upfront and long-term energy requirements. This paper assesses the life cycle costs (LCC), life cycle energy (LCE) and CO2 emissions impacts of filling the current housing gap with different building materials and technologies, and maintaining reasonable standards of indoor temperature and humidity. These outcomes are assessed under different climatic conditions and residential behavioural patterns, using urban and rural housing archetypes, and considering conventional as well as low-cost materials and energy-savings measures. The results demonstrate that stabilized-earth blocks are a preferred solution to the prevailing norm of fired bricks. Along with filler slab and roof insulation, they offer a win–win solution to reduce both LCC by 18% and LCE by 17% compared with conventional techniques in bridging the housing gap. LCE savings can be further increased to 28% without increasing the investment cost compared with conventional solutions. The insights provided by this study on abatement costs and efficacy can be used by policy-makers for affordable housing and climate-related policies.
Introduction
Access to adequate, safe and affordable housing for all is recognized as a universal right and a key target for sustainable development (United Nations (UN), Citation2015; UN-Habitat, Citation2001). More than 60 million homes in India are unfit for decent living (Ministry of Rural Development (MoRD), Citation2011; National Buildings Organisation (NBO), 2013). Replacing this stock with decent housing will entail significant costs and increase energy consumption and related CO2 emissions (Akpinar-Ferrand & Singh, Citation2010). Maintaining reasonable standards of temperature and humidity in Indian homes in general will generate significant additional energy demand (Akpinar-Ferrand & Singh, Citation2010). This paper evaluates the potential range of life cycle costs (LCC), energy requirements and CO2 implications for bridging the housing gap in India under different building design, materials and space-conditioning technology choices. A further objective is to identify opportunities for cost and energy reductions over current practices.
The housing gap in India amounts to about 19 million units in urban areas (NBO, Citation2013) and at least 43 million in rural areas (MoRD, Citation2011), including homes that are structurally inadequate (e.g. slums), obsolete or overcrowded and the lack of homes for about 1 million homeless people. In addition, the poor housing quality and lack of affordable space conditioning prevent people from maintaining indoor thermal conditions within safe limits (Akpinar-Ferrand & Singh, Citation2010), leading to increased health and mortality risks from extreme conditions, such as from heatwaves (Mazdiyasni et al., Citation2017).
Decent housing needs to be affordable as well as safe. Over 40% of the housing shortage pertains to homes below the poverty line (Tiwari, Rao, & Day, Citation2016). Overcrowding in homes is more acute for the poor because they have larger household sizes.
Globally, buildings contribute over 18% of greenhouse gases (GHGs) (Edenhofer et al., Citation2014). In India, energy demand and related GHG emissions from the building sector could grow by 700% by 2050 relative to 2005 (Khosla, Sagar, & Mathur, Citation2017). Residences emit 7% of India’s GHG emissions (Indian Network for Climate Change Assessment (INCCA), Citation2010). Implementing energy-efficiency measures would contribute to achieve about 30% of energy savings in new residential buildings (Ministry of Environment & Forests (MoEF), Citation2012).
The Government of India has recently launched the programme ‘Housing for All’ (Pradhan Mantri Awas Yojana) with the aim of constructing 20 million housing units for the urban poor and slum households (Ministry of Housing and Urban Affairs (MHUA), Citationn.d.; Ministry of Housing and Urban Poverty Alleviation (MHUPA), Citation2016). The choice of technology, design and materials used for such programmes may have a significant impact on the cost and CO2 emissions of meeting the housing gap. The design of buildings may present trade-offs or synergies between cost and energy use, and between upfront investments and long-term operation.
Current approaches to housing delivery in developing countries often use inappropriate construction methods (Bruen, Hadjri, & von Meding, Citation2013). Construction practices in India largely make use of energy-intensive materials, such as concrete, steel and fired bricks (Praseeda, Mani, & Venkatarama Reddy, Citation2014; Tiwari, Citation2003). In particular, bricks and reinforced concrete (RCC) roofing have replaced traditional materials for rural housing (Praseeda et al., Citation2014), whereas RCC framing is typical for urban multi-storey buildings (Bansal, Singh, & Sawhney, Citation2014; Bardhan, Citation2011). Energy-efficiency measures and alternative building materials can play a major role in the reduction of CO2 emissions and costs (Tiwari, Citation2003; Venkatarama Reddy & Jagadish, Citation2003). These measures include the choice of masonry, roofing type and alternative materials with higher thermal resistance and/or low embodied energy (EE) such as stabilized earth blocks (SEB) masonry and filler-slab roofing (Ramesh, Prakash, & Shukla, Citation2012b; Tam, Citation2011).
For rural housing, mud and stone have been suggested for their low EE and construction costs (Praseeda et al., Citation2014). However, the operational energy (OE) for such buildings and the potential to insulate them are not well researched, nor is the effect of their shorter service life and quality (Mastrucci & Rao, Citation2017; Mishra & Usmani, Citation2014; Praseeda et al., Citation2014; Singh, Mahapatra, & Atreya, Citation2009). Furthermore, mud construction requires high maintenance due to its vulnerability to erosion, water penetration and termite attacks. Some of these drawbacks can be overcome by the use of materials with enhanced performance: SEB and non-erodible mud plaster (Srivastava & Kumar, Citation2018). However, the combined life cycle energy (LCE) and costs of these enhanced materials have not as yet been assessed.
Previous studies for India estimate either the material requirements and costs of providing new houses (Debnath, Singh, & Singh, Citation1995; Tiwari, Citation2003) or the energy demand from conventional and traditional buildings (Mishra & Usmani, Citation2014; Singh et al., Citation2009). Some authors recently adopted life cycle assessment (LCA), in particular LCE assessment, to estimate the building energy requirements in India (Praseeda, Reddy, & Mani, Citation2016; Ramesh, Prakash, & Shukla, Citation2012a; Sharma & Marwaha, Citation2015). Such an approach allows for a more holistic analysis of trade-offs between the construction and use of buildings.
In the international literature, large-scale studies for fast-growing countries mainly focused on resource flow estimates and embodied impacts (Currie, Lay-Sleeper, Fernández, Kim, & Musango, Citation2015; Göswein, Krones, Celentano, Fernández, & Habert, Citation2017; Mastrucci, Marvuglia, Leopold, & Benetto, Citation2017) while building operation is rarely investigated (Yang & Kohler, Citation2008) or uses statistical data.
The use of engineering-based models, although more data intensive, is promising for the ability to model the impact of future technologies (Swan & Ugursal, Citation2009) on energy requirements. Dynamic energy models have the ability to account properly for the dynamic behaviour of buildings, the effect of thermal mass, thermal comfort conditions and occupants’ schedules (Aste, Angelotti, & Buzzetti, Citation2009), which are key especially under severe climatic conditions and tropical areas. However, their application in large-scale studies for developing countries is still limited (Global Buildings Performance Network (GBPN), Citation2013; Invidiata & Ghisi, Citation2016; Ramesh et al., Citation2012b; Silva, Almeida, & Ghisi, Citation2016). Humidity and latent loads have been also overlooked (Lin & Deng, Citation2004).
In addition, studies that link costs to energy and CO2 emissions in order to evaluate policy-relevant questions such as identifying pathways to bridge the housing gap are largely missing. Recent studies coupled LCA and building models for policy support at the national level in Organisation for Economic Co-operation and Development (OECD) countries, but applications in developing countries are limited (Mastrucci et al., Citation2017). Making decisions based on either low-cost investments or energy efficiency alone might lead to housing solutions with higher life cycle costs.
In this analysis, common construction practices are compared with alternative techniques to explore the potential for cost reduction and limiting energy demand and CO2 emissions while providing durable and safe housing. A building archetype model is coupled with dynamic energy simulations to investigate the combination of building characteristics, climate and occupant behaviour. A life cycle perspective is adopted in order to provide insights into the trade-off between upfront and operating costs, on the one hand, and EE versus OE and emissions, on the other. Based on housing gap data, building simulation results are aggregated to the country scale in order to provide insights for policy on the relative impacts of construction practices, energy-savings measures and behaviour on cost and emissions outcomes. The study focuses on the requirements to fill the current housing gap, leaving the future evolution of the building stock to future research.
Methods
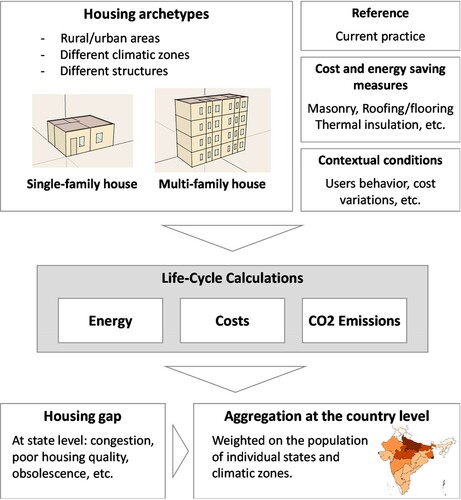
The method consists of applying a building simulation model combined with a life cycle methodology for estimating energy, costs and CO2 emissions for a given set of inputs on user behaviour (such as setpoints for temperature and humidity, and the floor-space coverage and duration of air-conditioning – AC), climatic conditions, building archetypes, design and space-conditioning technology (). A reference set of building configurations, technology and material conditions represents current practices. A parametric analysis is run to evaluate the influence of contextual conditions and the effect of alternative design and energy-savings measures on unit costs and energy. The building simulation results were normalized across archetypes to a common unit of energy intensity per unit of dwelling and floor space (m2). Earlier research demonstrates that to an approximation energy use in these archetypes scales with floor space (Mastrucci & Rao, Citation2017). Results are then aggregated to the country scale using housing gap data combined with minimum floor space requirements for decent housing (10 m2 per person with a minimum of 30 m2 for up to three persons) (Rao & Min, Citation2017) to estimate the total build-out and OE requirements.
Figure 1. Overview of the method.
Three main stages can be identified in the life cycle of buildings: production/construction stage, use stage and end-of-life stage. Production/construction and use stage were included in this study. Maintenance and end of life were excluded as they are expected to account for less than 1% of the total LCE (Ramesh, Prakash, & Kumar Shukla, Citation2013). Maintenance is not negligible in LCC calculations (Heralova, Citation2014). However, it is likely to be comparable for the types of building considered and therefore not material to the outcomes of this paper. The building lifetime was assumed to be 50 years to be consistent with other studies for India (Praseeda et al., Citation2014; Praseeda et al., Citation2016) and in agreement with the assumption of durable construction.
Housing archetypes
The building model used in this study is based on the archetypes technique (Moffatt, Citation2004; Swan & Ugursal, Citation2009). This technique consists of identifying a limited number of buildings as representative of specific building classes.
Two archetypes were identified on the basis of previous work (Mastrucci & Rao, Citation2017) and relevant literature: a single-family house (SFH) to represent rural homes (MoRD, Citation2016) and a four-storey multifamily house (MFH) to represent urban housing in India (Bansal et al., Citation2014) (). While the choice of two archetypes seems limited for a large new housing stock as that of India, the lack of detailed data on the current and future building stocks precluded a more thorough categorization. To make up for this limitation, this approach seeks to define a baseline (reference case) based on representative housing types and common construction practice in India (Bansal et al., Citation2014; Naveen Kishore & Chouhan, Citation2014; Ramesh et al., Citation2013; Sharma & Marwaha, Citation2015; Srivastava & Kumar, Citation2018), and then to simulate a series of variations to key parameters to account for different contextual conditions, building design and potential energy-savings measures (). Whilst the analysis seeks to be as comprehensive as possible, some caveats exist regarding building geometry, where a high variability of configurations is expected, and specific regional construction systems and materials may apply.
Figure 2. Schematic plans of the housing units with floor surfaces of 30 and 40 m2.
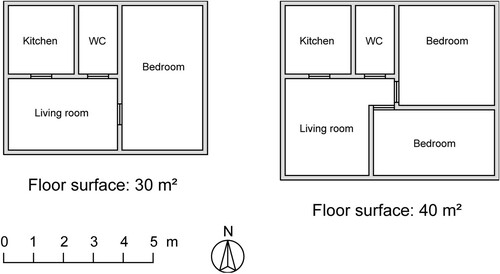
Table 1. Input for parametric analysis.
Both archetype designs are based on safety and comfort requirements previously identified for decent housing (Mastrucci & Rao, Citation2017; Rao & Min, Citation2017): minimum living space, permanent construction, adequate thermal insulation and proofing, and indoor temperature and humidity levels.
Reference case
The reference rural SFH case has a masonry structure and the urban MFH is based on an RCC framing. The reference dwelling floor surface area is set to 40 m2, corresponding to an average house area for rural and urban (Tiwari et al., Citation2016). The main building elements included in the analysis are reported in (for material properties, see Table SM2 in the supplemental data online). Technological systems, piping and cabling were not included. For the operational stage, OE for space heating and cooling was considered.
Table 2. Construction systems for single-family housing (SFH) and multifamily housing (MFH).
Parameters related to occupants’ behaviour were drawn from a previous study and chosen to quantify energy use conservatively (Mastrucci & Rao, Citation2017): the temperature and relative humidity setpoints were set to 26°C and 60% respectively to ensure an adequate comfort level (predicted mean vote (PMV) = 0.5) (International Organization for Standardization (ISO), Citation2005); the operation schedule for AC is 22:00–06:00 hours in bedrooms only; the ventilation is assumed 0.5 air changes per hour (ACH); and no window shadings are in use.
Parametric analysis
A parametric analysis was run with the twofold goal of estimating the influence of relevant contextual conditions and exploring the effect of energy and cost-saving measures, based on key parameters identified from the literature (Heeren et al., Citation2015; Mastrucci & Rao, Citation2017).
All possible combinations of parameters variations were tested to cover the entire input space, accounting for the interaction between parameters. Each combination may be considered an independent scenario of building conditions. These scenarios are presented without attached likelihoods because the literature provides an insufficient basis from which to assess future practices in new buildings (Tian, Citation2013). The parameters are synthetically presented below. For additional information, see section SM 1 in the supplemental data online.
Contextual parameters include building location, geometry, construction materials, infiltration/ventilation and occupants’ behaviour. Regarding building location, the five national climatic zones of India (see Table SM1 in the supplemental data online) and building orientation were considered. Building geometry variations included the previously described archetypes, dwelling size and windows size. Alternative construction materials and technologies were included in the analysis and adapted to the two archetypes on the basis of the relevant literature and building practices in India (Nanyam, Sawhney, & Gupta, Citation2017; Naveen Kishore & Chouhan, Citation2014; Praseeda et al., Citation2016; Srivastava & Kumar, Citation2018). Some of these technologies, such as prefabrication and steel framing, entail higher construction costs but shorter construction times (Nanyam et al., Citation2017).
The following variations in occupants’ behaviour were implemented: different thermal comfort settings, including indoor temperature (25–27°C) and relative humidity (55–65%); extended use of AC to cover both the living room and bedrooms; infiltration/ventilation; and use of window shadings.
Energy-savings measures for the building envelope include different masonry materials, roof technologies, thermal insulation and low-emissivity double-glazing instead of single-glazing. This analysis builds on previous studies where masonry materials and roof technologies with low EE and costs were identified for India (Ramesh, Citation2012; Ramesh et al., Citation2012a, Citation2012b; Srivastava & Kumar, Citation2018; Tam, Citation2011), including hollow concrete blocks (HCB), aerated concrete blocks (ACB), fly ash–lime–gypsum blocks (FAB), SEB for masonry, filler slab for roofing. In addition, thermal insulation was included with an optimal thickness of 5 cm for the Indian context (Ramesh et al., Citation2012b).
Energy intensities
EE requirements were calculated by multiplying EE intensities by the estimated quantity of material for the specific archetype (see section SM 2.1 in the supplemental data online). Similar to other authors (Sharma & Marwaha, Citation2015), EE intensities were obtained from Indian sources and averaged in the case of multiple sources (see Tables SM2 and SM3 in the supplemental data online). While alternative EE intensities from international databases are available (e.g. Ecoinvent), they represent conditions in industrialized countries and largely lack data for emerging countries (Ortiz, Castells, & Sonnemann, Citation2009). As such, they do not reflect prevailing construction practices, technologies and conditions, nor India’s unique dependence on coal (INCCA, Citation2010).
Energy requirements for space heating and cooling were simulated in dynamic state using the software EnergyPlus (US Department of Energy (DOE), Citation2016) (see section SM 2.2 in the supplemental data online).
Cost analysis
LCC was calculated using the annuity calculation method (European Committee for Standardization (CEN), Citation2007). The annualized costs, here expressed in international dollarsFootnote1 ($/y), are calculated as follows:(1)
(1) where Cr represents the running costs; aτ,r is the annuity factor; and V0(j) is the investment cost for the component or system j. This equation assumes that all components j remain unchanged during the lifetime of the building. The annuity factor is calculated using:
(2)
(2) where τ is the lifetime of the building; and r is the discount rate. Both social and private perspectives on investment were considered using two different discount rates: 4% (social) (Lopez, Citation2008) and 15% (private) (Ernst & Young (EY), Citation2017).
The source for the cost of building materials and construction works is the Delhi Schedule of Rates for 2014 (Central Public Works Department (CPWD), Citation2014). The electricity price was set to the average paid by households (0.164 $/kWh) as reflected in the National Sample Survey of Consumption Expenditure of 2011–12 (International Household Survey Network (IHSN), Citation2013). Uncertainty on the price variation for materials was estimated as the five-year (2011–12 to 2016–17) variation in the wholesale price index for India (see section SM1.2 in the supplemental data online). Land and design costs as well as maintenance and disposal costs are omitted.
CO2 emissions
CO2 emissions embodied in building materials were calculated by combining the fuel shares of the EE used in the production of each material with the fuels’ respective carbon intensities (for details, see section SM1.2 in the supplemental data online). Emissions for cement production are 0.507 tCO2 eq/t clinker production (Gibbs, Soyka, & Conneely, Citation2000) (see Table SM6 in the supplemental data online). Regarding the operational stage, CO2 emissions from electricity are 0.82 tCO2/MWh of electricity, which reflects the dominance of coal in the fuel mix (Ministry of Power (MoP), Citation2011).
Aggregation to the country level
Energy intensities were combined with housing gap data at the state level to account for heterogeneity in climatic conditions and levels of poverty. The national rural housing gap of 43 million was allocated to states in proportion to states’ share of low-income population in 2012 (see Table SM11 in the supplemental data online) (MoRD, Citation2011). Urban housing gap data are available at the state level (NBO, Citation2013).
Housing gaps were multiplied by energy, cost and CO2 emission requirements for one housing unit at the state level respecting housing archetypes and climatic zones. For the aggregation, SFH (MFH) was assumed for rural (urban) areas, being representative of the main housing typology. Two dwelling floor areas were assumed in the aggregation: the reference 40 m2, and 30 m2 corresponding to the average house area for lower-income groups in rural and urban areas (Tiwari et al., Citation2016). This is reasonable despite the heterogeneity in household size because of the finding that dwelling size does not alter the overall energy intensity per m2 (Mastrucci & Rao, Citation2017). Except for infiltration/ventilation, all other parameters were varied to generate ranges for the aggregated result. Ventilation was set at the reference value (0.5 h−1) under the assumption that new buildings will be moderately air tight. Results are provided for the total build-out requirements to cover the gaps as well as for operation and turnover requirements over the housing life cycle.
Results
The analysis demonstrates that alternatives to current construction practices can simultaneously reduce LCC and emissions of housing in India in a range of contextual conditions. The following sections report results for the reference case, effect of energy and cost-saving measures and aggregated estimates to bridge the housing gap based on the optimal solutions for rural and urban areas respectively.
Reference case: LCE and LCC
and show the LCE and LCC intensity requirements per floor surface unit for the reference case (SFH and MFH) compared with other structure types while varying contextual conditions in composite climate. Overall, MFHs have lower LCE intensities than do SFHs. MFHs have both lower material requirements and OE as a consequence of their more compact configuration. However, the share of EE in LCE for MFHs is higher due to the use of more energy-intensive materials for RCC and steel structures. Between RCC, prefab and steel options, the RCC frame structure represents the MFH solution with lower LCE. The prefab structure entails an increase in both EE and OE, while the steel option provides EE in between the two others (steel has high energy intensity but overall the building is lighter)Footnote2 and good performance in terms of OE (better wall insulation).
Figure 3. Life cycle energy (LCE) intensity of different housing types and structures (composite climate). Bars indicate the reference case; whiskers indicate variation under different contextual conditions: orientation, dwelling size, window size, shading, setpoints and air-conditioner operation schedules (see ).
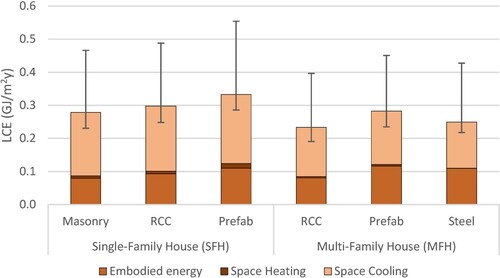
Figure 4. Life cycle costs (LCC) intensity of different housing types and structures (composite climate) under social (S) and private (P) discount rates. Bars indicate the reference case; whiskers indicate variation under different contextual conditions: orientation, dwelling size, window size, shading, setpoints, air-conditioner operation schedules, and material and electricity price variations (see ).
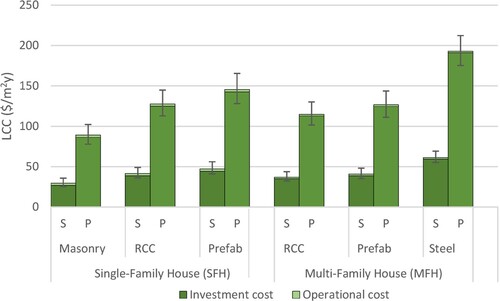
For SFHs, the masonry structure entails the lowest LCE and LCC intensities. This is the combined result of less RCC embedded (lower EE) and thicker walls providing additional thermal resistance and inertia (lower OE). The LCC intensity associated with RCC framing and prefab structures is higher for SFHs compared with MFHs and the cost increase for switching from RCC framing to prefab is significantly higher for SFHs. In all cases, including under the social discount rate, which favours long-term costs, investment costs dominate total LCC.
Results for different climatic zones (see Table SM13 in the supplemental data online) show the expected result that the energy demand for cooling dominates OE in the warm–humid (0.179–0.224 GJ/m2), composite (0.148–0.192 GJ/m2) and hot–dry (0.137–0.177 GJ/m2) regions, while heating demand is null or low, except for the cold climate zone (0.029–0.061 GJ/m2y). This confirms the findings in similar studies (Mastrucci & Rao, Citation2017; Ramesh et al., Citation2012b; Rawal & Shukla, Citation2014). Due to conservative assumptions on user behaviour in the baseline, the range of variation in OE (and LCE) (see section SM3.4 in the supplemental data online) is mostly upward, reflecting larger conditioned spaces, an extended AC schedule instead of a night schedule and stricter setpoints for temperature and humidity (variation in the range of 60–70%). Infiltration and ventilation are also among the most influential parameters. Other parameters, such as orientation and window size, marginally affect the results. In the case of LCC, the range of variation is mainly determined by the material price variations. Increasing the housing size over 40 m2 has negligible effect on LCC.
Effect of energy and cost-saving measures
and show the effect of several design options on LCE and investment cost compared with the reference solutions respectively for a SFH with masonry structure and an MFH with RCC framing in composite climate (for complete OE results under different climates, see section SM3.5 in the supplemental data online).
Figure 5. Effect of energy-saving measures for a single-family house (SFH) with masonry structure (composite climate) on life cycle energy (LCE) and investment costs compared with the reference case (REF). Energy-savings measures include alternative masonry materials – hollow concrete blocks (HCB), aerated concrete blocks (ACB), fly ash–lime–gypsum blocks (FAB) and stabilized earth blocks (SEB) – alternative roof/floor materials – filler slab (FIL) – and insulation (ins) for walls (W), roof (R) and windows (G) (see ). The full red dots represent the combination of measures entailing the best LCE and life cycle costs (LCC) savings.
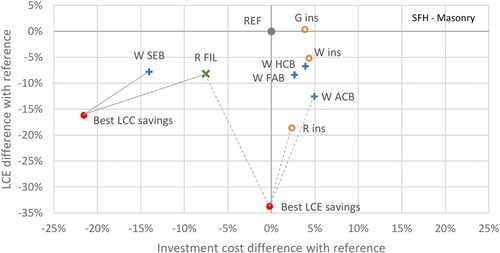
Figure 6. Effect of energy saving measures for a multifamily house (MFH) with reinforced concrete (RCC) structure (composite climate) on life cycle energy (LCE) and investment costs compared with the reference case. Energy-savings measures include alternative masonry materials – hollow concrete blocks (HCB), aerated concrete blocks (ACB), fly ash–lime–gypsum blocks (FAB) and stabilized earth blocks (SEB) – alternative roof/floor materials – filler slab (FIL) – and insulation (ins) for walls (W), roof (R) and windows (G) (see ). The full red dots represent the combination of measures entailing the best LCE and life cycle costs (LCC) savings.
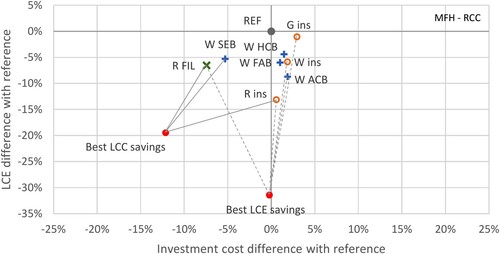
Changing the masonry material has the potential of reducing the LCE requirements by 7–13% for SFH and 4–9% for MFH compared with the reference fired bricks solution due to lower EE and enhanced thermal properties. In particular, ACB blocks offer the best energy savings due to low material density and conductivity. While most of the alternative materials (HCB, FAB and ACB) entail an increase in the investment cost up to 5%, SEB combine LCE savings (especially due to low EE intensity and higher thermal inertia) and significant investment cost reductions on the order of 15% (5%) for SFH (MFH). Energy and cost savings are higher for SFH because the quantity of masonry material is higher compared with MFH.
Replacing concrete slabs with filler slabs for flooring/roofing also allows concurrent reductions of both energy and costs on the order of 7–8%. Roof insulation offers significant LCE savings for both MFH and SFH (13–19%) with a modest increase in investment costs. Other energy conservation measures, i.e. wall insulation and high-performance windows, offer lower LCE savings due to a lower ratio between the reductions in OE and increase in EE.
The combination of measures providing minimum LCE requirements includes ACB masonry, filler slab roofing/flooring and roof insulation for both SFH and MFH, with additional wall insulation and high performance windows for MFH. LCE energy savings reduction amount to a total of 31–34%, while investment costs are similar to the reference case.
While the analysis of minimum LCE requirements demonstrates the possibility to achieve energy savings at no increase for investments costs, minimizing the LCC offers an opportunity for win–win solutions in terms of both energy and costs. The best solution (minimum LCC) resulted from the combination of SEB masonry and filler slab, while adding roof insulation is convenient for MFH only. This combination makes it possible to reduce at the same time LCC (21% for SFH and 13% for MFH) and LCE (16% for SFH and 20% for MFH).
The Pareto frontiers of optimal LCE–LCC solutions show that the choice of SEB and ACB for walls and filler slab for roof is robust across different climatic zones and archetypes characteristics (see Figures SM4 and SM5 in the supplemental data online). The effectiveness of insulation depends on the climate. It is most effective in zones with high temperatures (hot–dry, composite) and least effective in zones with lower temperatures but high humidity (warm–humid).
Bridging the housing gap: energy, emissions and cost implications
The total upfront energy to bridge the housing gap is estimated at 7.54–9.86 EJ assuming average housing unit sizes of 30 and 40 m2 respectively. CO2 emissions sum to 0.791–1.033 Gt CO2, which is between one-third and two-fifths of the total current annual CO2 emission in India (Janssens-Maenhout et al., Citation2017). Total calculated costs are estimated at $1.23–1.56 trillion. These costs are consistent with a McKinsey global study of affordable housing gaps that estimated the cost of upgrading homes for 440 million people (in contrast to 60 million in India) at $11–16 trillion (Woetzel, Ram, Mischke, Garemo, & Sankhe, Citation2014). Implementing low-cost technologies and energy-saving measures makes it possible to reduce the upfront energy up to 24%, CO2 emissions up to 17% and costs up to 18%, depending on the combination of technologies used.
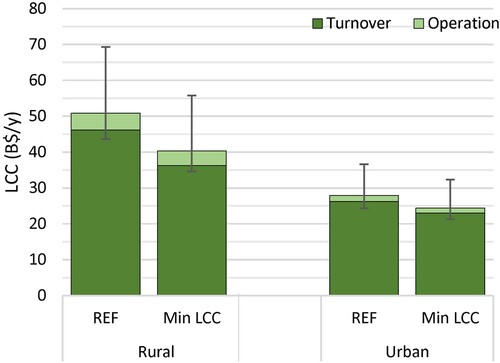
and show the total annual LCE and LCC to fill the housing gap in rural and urban areas in India by implementing reference versus energy-efficient and low-cost solutions. Similar to the results for single archetypes, the construction-related energy represents a smaller share of the total LCE, while its costs dominate the LCC, even with high AC usage. The total turnover energy is comparable for rural and urban in total despite the larger housing gap in rural areas, due to higher EE of urban construction. LCE savings up to 30% (20%) for rural (urban) housing can be achieved by implementing energy-efficient solutions. Total LCC reductions up to 21% (13%) for rural (urban) housing can be achieved by implementing low-cost solutions.
Figure 7. Total life cycle energy (LCE) for the operation and turnover of housing to fill the gap in rural and urban areas in India: reference case and minimum LCE. Bars indicate the reference case; whiskers indicate variation under different contextual conditions. Single-family house (SFH) housing is assumed for rural areas and multifamily housing (MFH) for urban areas.
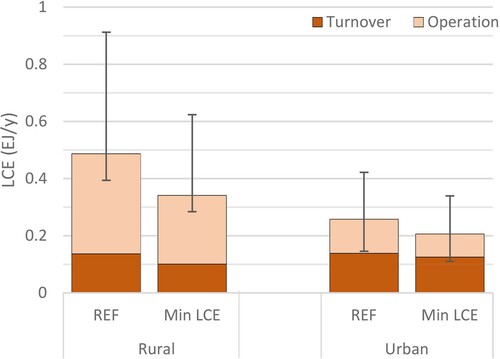
Figure 8. Total life cycle costs (LCC) for the operation and turnover construction (turnover) of housing to fill the gap in rural and urban areas in India: reference case and minimum LCC (social discount rate). Bars indicate the reference case; whiskers indicate variation in total LCC under different contextual conditions. Single-family house (SFH) housing is assumed for rural areas and multifamily housing (MFH) for urban areas.
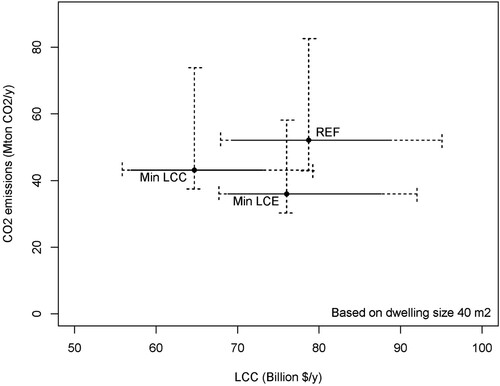
compares total life cycle CO2 emissions versus LCC for bridging the entire housing gap in India for the reference, minimum LCE and minimum LCC. This comparison reveals that the least-cost solution significantly reduces energy, but the least energetic solution marginally reduces costs relative to the reference. The minimum LCE case entails reductions of CO2 emissions by 31% and LCE by 28% compared with the reference; however, LCC reduction is limited to 3%. In the minimum LCC case, LCC are reduced by 18%, along with reductions of CO2 emissions (17%), and LCE (17%).
Figure 9. Range of total CO2 emissions and life cycle costs (LCC) (social discount rate) for filling the housing gap in India under variation of contextual conditions and for different cases: reference (REF); minimum life cycle energy (LCE) and minimum LCC. Dots indicate the reference for difference cases; continuous (dotted) lines indicate variation for construction (operation) emissions and costs. Results are based on the assumption of 40 m2 dwellings for filling the gaps.
Discussion
This study shows that there are many possible technology and design options to improve on prevailing construction practices that lower both the costs and energy needs for bridging the housing gap by almost 20%. These savings are possible by adopting SEB instead of fired brick masonry and filler slab instead of RCC slab, among other changes related to materials and structures. These findings are robust to different climate conditions and likely behaviour with regard to space cooling, although the absolute costs and energy would change accordingly.
Implications of different housing types and structures
MFHs entail lower energy requirements per unit of floor surface for both EE and OE compared with SFHs. However, construction costs per unit of floor surface are higher due to the higher costs for the building structure and foundations. Note that land costs are not included. MFHs have an advantage in this regard since they entail higher building and residential density compared with SFHs, but urban areas also tend to have higher land prices. These considerations suggest that taller buildings may seem more attractive, but limiting the number of floors to four to five may be more affordable with respect to water pumping, easier access to open ground and requirements for safety against earthquake, wind and fire (Gopalan & Venkataraman, Citation2015).
This study finds that masonry (RCC framing) is the most profitable solution for SFH (MFH) in terms of both LCE and LCC. This confirms and advances the results of other Indian studies focusing on the construction stage only (Dineshkumar & Kathirvel, Citation2015; Naveen Kishore & Chouhan, Citation2014). Other alternative technologies might present other advantages. In particular, prefab techniques offer the potential to reduce the gross versus net area due to reduced wall thickness (Srivastava & Kumar, Citation2018). They also require significantly lower construction times (Naveen Kishore & Chouhan, Citation2014), which is particularly important given the enormity of the housing gap and the ambition of government plans to provide housing for all by 2022. However, many economic and political obstacles might affect the transfer of prefabrication technology to India. Prefab may not be accepted in the construction industry if it threatens construction jobs due to automation and disrupts local building traditions (Smith & Narayanamurthy, Citation2008). As a new industry, prefab would require a large initial capital infusion in manufacturing sites to achieve economies of scale (Nanyam et al., Citation2017). Prefab solutions are therefore seen as potentially interesting for large MFH developments in urban and per-urban areas where the relative increase in cost is lower compared with SFH.
Material choice and energy-savings measures
Design choices of materials are critical, because they not only greatly affect the investment cost but also influence the energy efficiency, indoor thermal comfort and environmental profile of buildings over their life cycle.
This analysis confirmed the results of other studies (Ramesh et al., Citation2012b) where ACB offer the lowest LCE due to their low conductivity and moderate EE. However, cost considerations favour SEB where low EE and good thermal properties are combined with lower costs. Similarly, replacing RCC slabs with filler slabs offers a win–win solution for flooring and roofing where both energy and costs are reduced, corroborating and extending the results of previous studies (Naveen Kishore & Chouhan, Citation2014; Tiwari, Citation2003).
Whilst using mud construction for rural housing would entail even lower costs and EE, significant limitations apply for this material (Srivastava & Kumar, Citation2018). SEB are a viable alternative that can reduce both LCE and LCC due to its properties of moderate cost and EE in construction, and good thermal behaviour in operation. Further promoting the use of local materials (e.g. bamboo, natural fibres etc.), reuse of waste material (e.g. fly-ash, rice husk) (Srivastava & Kumar, Citation2018) and the development of new low-cost technologies (Moroz, Lissel, & Hagel, Citation2014; Puri, Chakrabortty, Anand, & Majumdar, Citation2017) has promise and merits further investigation.
Thermal insulation may provide additional OE and cost savings by limiting heat transfers through the envelope for some climatic zones. However, there is a trade-off between these savings and the increase in the EE and investment costs. In agreement with other authors (Ramesh et al., Citation2012b), this study confirmed that roof insulation is more effective than wall insulation in Indian conditions as it provides higher OE savings in proportion to EE and investment cost. Whilst thermal insulation and high-performance glazing contribute to achieve the highest LCE savings, these measures may not be convenient from an LCC perspective when high-performance masonry-roofing is in place. Indeed, the increase in investment costs to provide such measures would not be always compensated by the marginal decrease in operational costs.
Influence of household behaviour and market conditions
The range of variation of LCE and CO2 emissions is greatly influenced by the amount of conditioned floor area, schedules of AC operation and setpoints. Note that this study estimates hypothetical AC demand without considering the affordability and actual uptake of AC. The results for the low-cost solution (minimum LCC) show that the per capita electricity needs to provide thermal comfort range between 105 and 283 kWh/y, which is 13–35% of India’s per capita annual electricity consumption of 805 kWh in 2014 (World Bank, Citation2017).
LCC is greatly influenced by electricity and material market prices. Construction material market prices have steadily increased in the recent past, which is an obstacle to the development of future low-cost housing. In this context, promoting the use of local and low-cost materials, such as the SEB, is of particular importance for bridging the housing gap.
Implications for filling the housing gap
Bridging the gap in rural housing, which has historically been overlooked by housing policies (Singh, Swaminathan, & Ramachandran, Citation2015), would entail 65–70% of the total CO2 emissions and cost estimated. Although this study shows high potential for simultaneously reducing energy, costs and CO2 emissions while keeping the construction safe and durable, this potential may involve overcoming many political hurdles related to access to land, key infrastructures or residents’ consent (UN-Habitat, Citation2012). Potential barriers against sustainable practices include initial high costs of some technologies, low levels of user support and political factors (Gopalan & Venkataraman, Citation2015; Lyons, Citation2009; Ross, Bowen, & Lincoln, Citation2010).
Limitations and further research
The method used in this paper is based on a building archetype approach that inevitably leads to a number of simplifications. First, only two archetype housings were considered to represent rural and urban buildings respectively. Considering alternative configurations would enrich the results with more insights on energy-savings opportunities. This is especially true for rural buildings, where regional typologies are the results of adaptation to specific contextual conditions (MoRD, Citation2016). The different material options were based on current construction practice and viable alternatives according to the relevant literature. These assumptions may not be suitable for location-specific analyses that need to factor the local availability of materials, transportation distances, potentially different production processes and housing life due to specific contextual conditions.
Carbon emissions and primary energy were selected for the analysis as they are key indicators for the environmental impact of buildings (Mastrucci et al., 2017); nevertheless, other impact categories, such as abiotic resources depletion and acidification potential, are expected to be significant for a massive market uptake for new housing and should be investigated in future research.
This study has not considered affordability, with the underlying assumption that this is largely a policy matter. We assume all housing that need AC to achieve thermal comfort have it (all climatic zones in India). These assumptions are not applicable to current market conditions, but they do provide policy-makers with an estimate of aspirational costs and energy needs. This study has also not considered advance high-efficiency cooling technologies.
The LCC calculation does not attempt to estimate building costs comprehensively, but rather focuses on estimating the cost implications of particular technology and material choices. Land value, maintenance, disposal and other additional costs associated with securing against natural hazards were omitted.
Total annual requirements for filling the housing gaps are also strongly dependent on the floor surface per housing unit assumed, and the feasibility of rolling out housing to close the gap (Olaya, Vásquez, & Müller, Citation2017). The results of this study can be used to estimate the outcomes of different scenarios of house sizes and stock build up.
The political economy around the provision of housing upgrades, particularly related to multi-storey buildings in urban areas, needs to be factored when translating these results to actual policy (Takeuchi, Cropper, & Bento, Citation2008). Housing projects have often not delivered their stated benefits to occupants, or relocated them at great inconvenience.
Conclusions
This paper estimates the energy, cost and CO2 emission requirements of bridging the housing gap in India with technology and material choices that go beyond prevailing practices.
The results demonstrate that SEB masonry, as an alternative to conventional fired bricks, has the potential to lower the cost of bridging the housing gap while also reducing CO2 emissions growth. Together with some additional design features, such as filler slab for roofing/flooring and roof insulation in place of conventional solutions, SEB can reduce LCC by 18%, and both LCE and CO2 emissions by 17%. The combination of ACB masonry, filler slab, roof and wall insulation and high-performance windows have the potential to increase the LCE saving potential up to 28%, but entail higher LCC and investment costs comparable with current practice. These results are based on a high standard of comfort and safety that likely exceed the current low-cost housing expansion. The absolute costs for alternative technologies would scale with the standard of comfort adopted. However, the parametric analysis in this study shows that the relative rank of the options considered is robust to absolute changes in costs and energy.
The novelty of the methodology lies in its incorporation of energy and cost, operation and embodied components, and the influence of contextual parameter variations in key assumptions. This method is replicable in other countries. Future developments include the application to other countries and the development of time-series scenarios for filling the housing gap.
Supplemental Material
Download PDF (1.3 MB)Disclosure statement
No potential conflict of interest was reported by the authors.
Additional information
Funding
Notes
1 Costs are presented in international dollars. Purchasing power parity (PPP) exchange rates for 2010 were used for conversion from local currency (see the supplemental data online).
2 Material intensities per floor surface unit for the different archetypes are reported in section SM3.1 in the supplemental data online.
Related Research Data
References
- Akpinar-Ferrand, E., & Singh, A. (2010). Modeling increased demand of energy for air conditioners and consequent CO2 emissions to minimize health risks due to climate change in India. Environmental Science and Policy, 13(8), 702–712. doi: https://doi.org/10.1016/j.envsci.2010.09.009
- Aste, N., Angelotti, A., & Buzzetti, M. (2009). The influence of the external walls thermal inertia on the energy performance of well insulated buildings. Energy and Buildings, 41(11), 1181–1187. doi: https://doi.org/10.1016/j.enbuild.2009.06.005
- Bansal, D., Singh, R., & Sawhney, R. L. (2014). Effect of construction materials on embodied energy and cost of buildings – A case study of residential houses in India up to 60 m2 of plinth area. Energy and Buildings, 69, 260–266. doi: https://doi.org/10.1016/j.enbuild.2013.11.006
- Bardhan, S. (2011). Embodied energy analysis of multi-storied residential buildings in urban India. 143, 411–421. doi: https://doi.org/10.2495/ESUS110351
- Bruen, J., Hadjri, K., & von Meding, J. (2013). Design drivers for affordable and sustainable housing in developing countries. Journal of Civil Engineering and Architecture, 7(10), 1220–1228.
- Central Public Works Department (CPWD). (2014). Delhi schedule of rates. Government of India, CPWD.
- Currie, P., Lay-Sleeper, E., Fernández, J. E., Kim, J., & Musango, J. K. (2015). Towards urban resource flow estimates in data scarce environments: The case of African cities. Journal of Environmental Protection, 6(9), 1066–1083. doi: https://doi.org/10.4236/jep.2015.69094
- Debnath, A., Singh, S. V., & Singh, Y. P. (1995). Comparative assessment of energy requirements for different types of residential buildings in India. Energy and Buildings, 23(2), 141–146. doi: https://doi.org/10.1016/0378-7788(95)00939-6
- Dineshkumar, N., & Kathirvel, P. (2015). Comparative study on prefabrication construction with cast in-situ construction of residential buildings. International Journal of Innovative Science, Engineering and Technology, 2(4), 1–6. Retrieved from www.ijiset.com
- Edenhofer, O., Pichs-Madruga, R., Sokona, Y., Kadner, S., Minx, J., Brunner, S., … Zwickel, T. (2014). Technical summary. Climate change 2014: Mitigation of climate change. Contribution of Working Group III to the Fifth Assessment Report of the Intergovernmental Panel on Climate Change, 33–107. doi: https://doi.org/10.1103/PhysRevD.70.106002
- Ernst & Young (EY). (2017). Cost of capital – India survey. Retrieved from http://www.ey.com/Publication/vwLUAssets/ey-cost-of-capital-india-survey-2017/$FILE/ey-cost-of-capital-india-survey-2017.pdf
- European Committee for Standardization (CEN). (2007). Energy performance of buildings – Economic evaluation procedure for energy systems in buildings – European Standard EN 15459. CEN.
- Global Buildings Performance Network (GBPN). (2013). Building for our future: The deep path for closing the emissions gap in the building sector. Paris: GPBN. Retrieved from http://www.gbpn.org/reports/buildings-our-future-deep-path-closing-emissions-gap-building-sector
- Gibbs, M. J., Soyka, P., & Conneely, D. (2000). CO2 emissions from cement production. IPCC Good Practice Guidance and Uncertainty Management in National Greenhouse Gas Inventories, 175–182. Retrieved from http://www.ipcc-nggip.iges.or.jp/public/gp/english/
- Gopalan, K., & Venkataraman, M. (2015). Affordable housing: Policy and practice in India. IIMB Management Review, 27(2), 129–140. doi: https://doi.org/10.1016/j.iimb.2015.03.003
- Göswein, V., Krones, J., Celentano, G., Fernández, J. E., & Habert, G. (2017). Embodied GHGs in a fast growing city: Looking at the evolution of a dwelling stock using structural element breakdown and policy scenarios. Journal of Industrial Ecology, 0(0). doi: https://doi.org/10.1111/jiec.12700
- Heeren, N., Mutel, C. L., Steubing, B., Ostermeyer, Y., Wallbaum, H., & Hellweg, S. (2015). Environmental impact of buildings – What matters? Environmental Science and Technology, 49(16), 9832–9841. doi: https://doi.org/10.1021/acs.est.5b01735
- Heralova, R. S. (2014). Life cycle cost optimization within decision making on alternative designs of public buildings. Procedia Engineering, 85, 454–463. doi: https://doi.org/10.1016/j.proeng.2014.10.572
- Indian Network for Climate Change Assessment (INCCA). (2010). India: Greenhouse gas emissions 2007. Retrieved from http://www.moef.nic.in/downloads/public-information/Report_INCCA.pdf
- International Household Survey Network (IHSN). (2013). India – National Sample Survey 2011–2012 (68th Round) – Schedule 1.0 (Type 1) – Consumer Expenditure. IHSN. Retrieved from http://catalog.ihsn.org/index.php/catalog/3281
- International Organization for Standardization (ISO). (2005). International Standard ISO 7730:2005 – Ergonomics of the thermal environment Analytical determination and interpretation of thermal comfort using calculation of the PMV and PPD indices and local thermal comfort criteria. Geneva: ISO.
- Invidiata, A., & Ghisi, E. (2016). Impact of climate change on heating and cooling energy demand in houses in Brazil. Energy and Buildings, 130, 20–32. doi: https://doi.org/10.1016/j.enbuild.2016.07.067
- Janssens-Maenhout, G., Crippa, M., Guizzardi, D., Muntean, M., Schaaf, E., Olivier, J. G. J., & Schure, K. M. (2017). Fossil CO2 & GHG emissions of all world countries. Luxembourg: Publications Office of the European Union. doi:https://doi.org/10.2760/709792
- Khosla, R., Sagar, A., & Mathur, A. (2017). Deploying low-carbon technologies in developing countries: A view from India’s buildings sector. Environmental Policy and Governance, 27(2), 149–162. doi: https://doi.org/10.1002/eet.1750
- Lin, Z., & Deng, S. (2004). A study on the characteristics of nighttime bedroom cooling load in tropics and subtropics. Building and Environment, 39(9), 1101–1114. doi: https://doi.org/10.1016/j.buildenv.2004.01.035
- Lopez, H. (2008). The social discount rate: Estimates for nine Latin American countries. (Working Paper). Washington: The World Bank. Retrieved from http://documents.worldbank.org/curated/en/135541468266716605/pdf/wps4639.pdf
- Lyons, M. (2009). Building back better: The large-scale impact of small-scale approaches to reconstruction. World Development, 37(2), 385–398. doi: https://doi.org/10.1016/j.worlddev.2008.01.006
- Mastrucci, A., Marvuglia, A., Leopold, U., & Benetto, E. (2017). Life cycle assessment of building stocks from urban to transnational scales: A review. Renewable and Sustainable Energy Reviews, 74(February), 316–332. doi: https://doi.org/10.1016/j.rser.2017.02.060
- Mastrucci, A., & Rao, N. D. (2017). Decent housing in the developing world: Reducing life-cycle energy requirements. Energy and Buildings, 152, 629–642. doi: https://doi.org/10.1016/j.enbuild.2017.07.072
- Mazdiyasni, O., AghaKouchak, A., Davis, S. J., Madadgar, S., Mehran, A., Ragno, E., & Niknejad, M. (2017). Increasing probability of mortality during Indian heat waves. Science Advances, 3(6), e1700066. doi: https://doi.org/10.1126/sciadv.1700066
- Ministry of Environment & Forests (MoEF). (2012). India second national communication to the United Nations framework convention on climate change. Government of India, Ministry of Environment & Forests. Retrieved from http://unfccc.int/resource/docs/natc/indnc2.pdf
- Ministry of Housing and Urban Poverty Alleviation (MHUPA). (2016). India Habitat III, national report, 2016. Government of India, MHUPA.
- Ministry of Housing and Urban Affairs (MHUA). (n.d.). Pradhan Mantri Awas Yojana – Housing for all (Urban). Government of India, MHUA. Retrieved from http://pmaymis.gov.in/
- Ministry of Power (MoP). (2011). CO2 baseline database for the Indian power sector. Retrieved from http://cea.nic.in/reports/others/thermal/tpece/cdm_co2/user_guide_ver9.pdf
- Ministry of Rural Development (MoRD). (2011). Working group on rural housing for the 12th Five Year Plan. New Delhi.
- Ministry of Rural Development (MoRD). (2016). Pahal: Prakriti Hunar Lokvidya – A compendium of rural typologies. Government of India, MoRD.
- Mishra, S., & Usmani, J. A. (2014). Energy conservation in mud house as compared to brick wall building in India. International Journal of Advanced Engineering Research and Studies, III(II), 151–156.
- Moffatt, S. (2004). Stock aggregation: Methods for evaluating the environmental performance of building stocks. Paris: IEA Annex 31. Retrieved from http://www.iisbe.org/annex31/index.html
- Moroz, J. G., Lissel, S. L., & Hagel, M. D. (2014). Performance of bamboo reinforced concrete masonry shear walls. Construction and Building Materials, 61, 125–137. doi: https://doi.org/10.1016/j.conbuildmat.2014.02.006
- Nanyam, V. P. S. N., Sawhney, A., & Gupta, P. A. (2017). Evaluating offsite technologies for affordable housing. Procedia Engineering, 196(June), 135–143. doi: https://doi.org/10.1016/j.proeng.2017.07.183
- National Buildings Organisation (NBO). (2013). State of housing in India: A statistical compendium. New Delhi: NBO. Retrieved from http://nbo.nic.in/Images/PDF/Housing_in_India_Compendium_English_Version.pdf
- Naveen Kishore, K., & Chouhan, J. S. (2014). Embodied energy assessment and comparisons for a residential building using conventional and alternative materials in Indian context. Journal of The Institution of Engineers (India): Series A, 95(2), 117–127. doi: https://doi.org/10.1007/s40030-014-0075-x
- Olaya, Y., Vásquez, F., & Müller, D. B. (2017). Dwelling stock dynamics for addressing housing deficit. Resources, Conservation and Recycling, 123, 187–199. doi: https://doi.org/10.1016/j.resconrec.2016.09.028
- Ortiz, O., Castells, F., & Sonnemann, G. (2009). Sustainability in the construction industry: A review of recent developments based on LCA. Construction and Building Materials, 23(1), 28–39. doi: https://doi.org/10.1016/j.conbuildmat.2007.11.012
- Praseeda, K. I., Mani, M., & Venkatarama Reddy, B. V. (2014). Assessing impact of material transition and thermal comfort models on embodied and operational energy in vernacular dwellings (India). Energy Procedia, 54, 342–351. doi: https://doi.org/10.1016/j.egypro.2014.07.277
- Praseeda, K. I., Reddy, B. V. V., & Mani, M. (2016). Embodied and operational energy of urban residential buildings in India. Energy and Buildings, 110, 211–219. doi: https://doi.org/10.1016/j.enbuild.2015.09.072
- Puri, V., Chakrabortty, P., Anand, S., & Majumdar, S. (2017). Bamboo reinforced prefabricated wall panels for low cost housing. Journal of Building Engineering, 9, 52–59. doi: https://doi.org/10.1016/j.jobe.2016.11.010
- Ramesh, S. (2012). Appraisal of vernacular building materials and alternative technologies for roofing and terracing options of embodied energy in buildings. Energy Procedia, 14(2011), 1843–1848. doi:https://doi.org/10.1016/j.egypro.2011.12.887
- Ramesh, T., Prakash, R., & Kumar Shukla, K. (2013). Life cycle energy analysis of a multifamily residential house: A case study in Indian context. Open Journal of Energy Efficiency, 2(1), 34–41. doi: https://doi.org/10.4236/ojee.2013.21006
- Ramesh, T., Prakash, R., & Shukla, K. K. (2012a). Life cycle approach in evaluating energy performance of residential buildings in Indian context. Energy and Buildings, 54, 259–265. doi: https://doi.org/10.1016/j.enbuild.2012.07.016
- Ramesh, T., Prakash, R., & Shukla, K. K. (2012b). Life cycle energy analysis of a residential building with different envelopes and climates in Indian context. Applied Energy, 89(1), 193–202. doi: https://doi.org/10.1016/j.apenergy.2011.05.054
- Rao, N. D., & Min, J. (2017). Decent living standards: Material prerequisites for human wellbeing. Social indicators Research, doi: https://doi.org/10.1007/s11205-017-1650-0
- Rawal, R., & Shukla, Y. (2014). Residential buildings in India: Energy use projections and saving potentials. Paris: Global Buildings Productivity Network (GBPN). Retrieved from http://www.gbpn.org/sites/default/files/08.%20INDIA%20Baseline_TR_low.pdf.
- Ross, N., Bowen, P. A., & Lincoln, D. (2010). Sustainable housing for low-income communities: Lessons for South Africa in local and other developing world cases. Construction Management and Economics, 28(5), 433–449. doi: https://doi.org/10.1080/01446190903450079
- Sharma, A., & Marwaha, B. M. (2015). A methodology for energy performance classification of residential building stock of Hamirpur. HBRC Journal, 13(3), 337–352. doi: https://doi.org/10.1016/j.hbrcj.2015.11.003
- Silva, A. S., Almeida, L. S. S., & Ghisi, E. (2016). Decision-making process for improving thermal and energy performance of residential buildings: A case study of constructive systems in Brazil. Energy and Buildings, 128, 270–286. doi: https://doi.org/10.1016/j.enbuild.2016.06.084
- Singh, M. K., Mahapatra, S., & Atreya, S. K. (2009). Bioclimatism and vernacular architecture of north-east India. Building and Environment, 44(5), 878–888. doi: https://doi.org/10.1016/j.buildenv.2008.06.008
- Singh, S., Swaminathan, M., & Ramachandran, V. K. (2015). Housing shortages in rural India. Review of Agrarian Studies, 54–72.
- Smith, R., & Narayanamurthy, S. (2008). Prefabrication in developing countries: A case study of India. In P. Clouston (Ed.), Without a hitch: New directions in prefabricated architecture (pp. 48–53). Proceedings for 2008 Northeast Fall Conference of the Association of Collegiate Schools of Architecture. Amherst: University of Massachusetts. Retrieved from https://scholarworks.umass.edu/cgi/viewcontent.cgi?referer=https://duckduckgo.com/&httpsredir=1&article=1006&context=wood
- Srivastava, M., & Kumar, V. (2018). The methods of using low cost housing techniques in India. Journal of Building Engineering, 15(November 2017), 102–108. doi: https://doi.org/10.1016/j.jobe.2017.11.001
- Swan, L. G., & Ugursal, V. I. (2009). Modeling of end-use energy consumption in the residential sector: A review of modeling techniques. Renewable and Sustainable Energy Reviews, 13(8), 1819–1835. doi: https://doi.org/10.1016/j.rser.2008.09.033
- Takeuchi, A., Cropper, M., & Bento, A. (2008). Measuring the welfare effects of slum improvement programs: The case of Mumbai. Journal of Urban Economics, 64(1), 65–84. doi: https://doi.org/10.1016/j.jue.2007.08.006
- Tam, V. W. Y. (2011). Cost effectiveness of using low cost housing technologies in construction. Procedia Engineering, 14, 156–160. doi: https://doi.org/10.1016/j.proeng.2011.07.018
- Tian, W. (2013). A review of sensitivity analysis methods in building energy analysis. Renewable and Sustainable Energy Reviews, 20, 411–419. doi: https://doi.org/10.1016/j.rser.2012.12.014
- Tiwari, P. (2003). Sustainable practices to meet shelter needs in India. Journal of Urban Planning and Development, 129(2), 65–83. doi: https://doi.org/10.1061/(ASCE)0733-9488(2003)129:2(65)
- Tiwari, P., Rao, J., & Day, J. (2016). Housing development in a developing India. In Development paradigms for urban housing in BRICS countries. London: Palgrave Macmillan. doi: https://doi.org/10.1057/978-1-137-44610-7
- UN-Habitat. (2001). The habitat agenda – Istanbul Declaration on Human Settlements. United Nations Centre for Human Settlements. Retrieved from http://www.un.org/ga/Istanbul+5/declaration.htm
- UN-Habitat. (2012). Sustainable housing for sustainable cities: A policy framework for developing countries. Nairobi: UN-Habitat. Retrived from https://unhabitat.org/books/sustainable-housing-for-sustainable-cities-a-policy-framework-for-developing-cities/
- United Nations (UN). (2015). Transforming our world: The 2030 Agenda for Sustainable Development. Retrieved from https://sustainabledevelopment.un.org/
- US Department of Energy (DOE). (2016). EnergyPlus documentation, v. 8.5. Retrieved from https://energyplus.net/
- Venkatarama Reddy, B. V., & Jagadish, K. S. (2003). Embodied energy of common and alternative building materials and technologies. Energy and Buildings, 35(2), 129–137. doi: https://doi.org/10.1016/S0378-7788(01)00141-4
- Woetzel, J., Ram, S., Mischke, J., Garemo, N., & Sankhe, S. (2014). A blueprint for addressing the global affordable housing challenge. McKinsey Global Institute.
- World Bank. (2017). World development indicators. Retrieved from https://data.worldbank.org/data-catalog/world-development-indicators
- Yang, W., & Kohler, N. (2008). Simulation of the evolution of the Chinese building and infrastructure stock. Building Research & Information, 36(1), 1–19. doi: https://doi.org/10.1080/09613210701702883