ABSTRACT
At universities worldwide, creating a ‘smart campus’ is gaining significance. This is a response to the increasingly dynamic use of the campus and the pressure on resources: energy, financial and human resources. The university community has become more mobile, student numbers more unpredictable and funding more uncertain. Consequently, campus strategies focus on resource efficiency and sharing space, requiring investment in management information to improve decision making. The Internet of Things (IoT) can help to provide big data about use patterns: by collecting real-time data on space utilization, users can make better use of current spaces and real estate managers can make better decisions about long-term demand. Furthermore, space utilisation data can be complemented with user feedback data and environmental variables, e.g. noise levels, luminance. In this research we identify the capabilities of existing IoT applications through a literature study. Literature also suggests that information from IoT applications is not utilized in organisational decision-making processes. Through four case studies we analyse these decision-making processes and identify the process-level requirements to make strategic decisions in campus management. Then we show how information from the IoT can be directly connected to these processes, thus providing a valuable addition of real-time data as input.
Introduction
At universities across the world, the notion of a ‘smart campus’ is becoming increasingly appealing as a response to the multitude of challenges that impact campus development and operation. Firstly, universities are faced with an increasingly uncertain demand (both qualitatively and quantitatively) for facilities. An increasing share of international students results in a more uncertain student influx (OECD, Citation2019) and a more diverse demand for student facilities and services on campus (Sankari et al., Citation2018; TU Delft, Citation2016). Furthermore, as securing research funding from public or private sources is increasingly competitive in ‘academic capitalism’ (Lepori & Reale, Citation2019; Schulze-Cleven & Olson, Citation2017), there is competition for resources. This results in more temporary contracts and uncertainty in the demand for offices and laboratories. Secondly, the modernization of many campuses is a challenge. Many campuses in Europe and the United States consist largely of ageing buildings that are often in need of renovation and therefore (re)investment – (Den Heijer & Tzovlas, Citation2014; Kadamus, Citation2013). Combined with reduced government funding, this leads universities to alternative financing models. Newell and Manaf (Citation2017) observe a clear tendency amongst five Australian universities to use different funding models for their investments such as leasing, debt funding, donations and private development. In the UK, universities have already invested significantly using models such as private bond issuing, commercial bank lending, and loans from the European Investment Bank (McCann et al., Citation2019). Put together, these challenges greatly increase the difficulty of strategic decision making in campus management.
The combination of more ambitious goals and pressure on energy, financial and human resources is reason for universities to invest in efficient campus management, including by means of information. In previous research, the authors researched the use of Smart campus tools to support universities. Smart campus tools are defined as follows:
… a service or product with which information on space use is collected real-time to improve utilization of the current campus on the one hand, and to improve decision-making about the future campus on the other hand.
The why: why would a university implement a smart tool? Just as with real estate, the basic assumption with smart campus tools is if they would not add value to the university campus, no university would invest in it. In order to understand how smart campus tools add value, a model of A. C. Den Heijer (Citation2011) is used that identifies the added value of real estate decisions. Four stakeholder perspectives are defined, each with their own objectives through which added value can be measured. These stakeholder perspectives and the ways real estate adds value to their perspective are:
Strategic (decision makers): Improving quality of place, stimulating collaboration, stimulating innovation, supporting image, supporting culture
Functional (end users): Supporting user activities, increasing user satisfaction, increasing flexibility
Financial (controllers): Increasing revenues, decreasing costs, reducing risks
Physical (technical managers): Reducing footprint
The what: what data must the smart tool collect in order to achieve the objectives? In order to understand what data is collected, traditional space use frameworks of NAO (Citation1996) or Space Management Group (Citation2006) are complemented by an indoor positioning framework provided by Christensen et al. (Citation2014, pp. 7–8). Four levels of space use are defined, which Christensen et al. term ‘occupancy resolutions’: frequency, occupancy, identity and activity, which can each be aggregated in space and time.
The how: how can space use be measured real-time? A study on indoor positioning methods by Mautz (Citation2012) and a white paper by Serraview (Citation2015) were used to generate a first overview of possible sensing technologies, which has been expanded and refined throughout the research.
With smart campus tools, universities improve the effective and efficient use of their spaces in the short-term, by measuring the use of these spaces in real time and guiding students and employees to available spaces that match their needs. Real-time data on space use are also used to optimize the delivery of building services (heating, ventilation, lighting), resulting in energy savings (Balaji et al., Citation2013, Citation2016). Over the past years, significant research attention has been given to the development of information technologies that can measure space use in real time, focusing mostly on operational applications.
However, at the same time, information on utilization of spaces, user satisfaction, and energy consumption can be used to support various campus management decisions. These decisions are strategic decisions (with a long-term focus) e.g. building renovation, construction and disposal and tactical decisions (with a mid-term focus) e.g. optimization of cleaning schedules, building opening hours and purchase quantities of food facilities. As we will show, the use of the information delivered by smart campus tools and their application in organizational processes has received little attention.
In order to research the delivery of information from Smart campus tools to support strategic decision making on campus, an Information Management perspective is used (Bytheway, Citation2014, pp. 29–30). In Information Management, the delivery of information to support decision making is understood in the following steps (Bytheway, Citation2014):
The information technology that forms the technological component of an information system;
The information system that delivers our needs in a more personalized way;
The organizational process that benefits from our system;
The organizational information that will be derived from the system;
The organizational benefits that we expect as a result of the system;
The organizational strategy that is realized through the delivery of the benefits.
The three previous aspects (why, how and what) can be positioned within this framework. The sensing technologies are information technologies, which are engineered into an information system. This information system includes both hardware and the human capability to work with the system (Bytheway, Citation2014). The occupancy resolutions describe the delivery of information to the information system. The information systems are applied in organizational processes in order to improve them and deliver organizational benefits, which are the previously described objectives describe the organizational benefits. Smart campus tools as a whole are approached as part of campus information systems: they collect data, which are then applied not only in operational but also in strategic processes, in order to help universities meet their new challenges. In this paper, we focus on the strategic processes.
In scientific research and in practice, Smart campus tools are more commonly termed ‘Internet of Things’ (IoT). IoT is defined by Gubbi et al. (Citation2013) as
Interconnection of sensing and actuating devices providing the ability to share information across platforms through a unified framework, developing a common operating picture for enabling innovative applications. This is achieved by seamless ubiquitous sensing, data analytics and information representation with Cloud computing as the unifying framework.
Research methods
In order to answer the research question, a mixed methods approach is adopted. First, literature is studied to understand which IoT applications are available and how these relate to decision-making processes. Then, a strategic decision-making process in campus management is studied. For this a case study approach is used. Finally, the outcomes from both studies are combined to answer the research question.
Literature study
The literature study focuses on the potential use of IoT applications in campus management. In the field of CREM surprisingly little has been published regarding IoT applications: a scan of the 2014–2017 issues of the Journal of Corporate Real Estate, Facilities and the Journal of Property Research did not yield any relevant articles to the subject matter. Therefore, a search query in Scopus () was developed to extend the scope to any relevant studies, linking sensors to either added values of CREM, real estate domains, occupancy measurements or different types of real estate. A limitation of this search query is that some relevant papers were not identified through it; these papers have been added through other searches. This study was first done in 2016 and reiterated in 2018 and 2020. shows the steps that were taken to select the 60 studied papers; shows the inclusion and exclusion criteria used in the studies.
Figure 1. Scopus query.
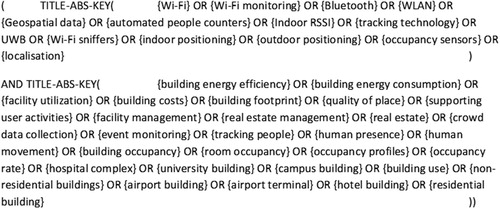
Figure 2. Scanning steps of the literature review.
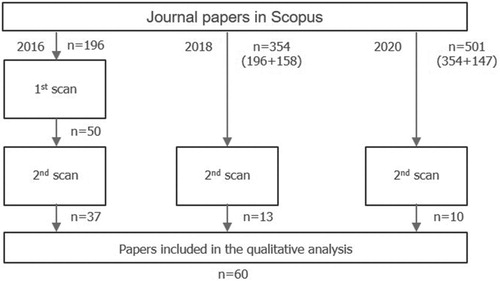
Table 1. Criteria to include and exclude papers.
The results are organized in a study-and-concept matrix in which the articles are listed in rows and the categories in columns. Initially, the literature study focused on the IoT applications presented in the papers. The following aspects were documented and analysed: sensors used, type of space use measurement and CREM objectives. In the 2018 iteration, more aspects were added to the matrix in order to identify the perceived research gap concerning IoT support to decision-making processes. The following fields were added: the research field of the authors, the type and scale of the space that the study was applied to, granularity of results, reported outcomes, and the way in which those outcomes are used.
Case studies
Through four case studies an understanding is gained of current campus management practices, including the current contribution of IoT applications. The cases are actual decision-making processes of campus (re)development at different Dutch universities (henceforth the ‘strategy process’). The main components of each decision-making process are the involved actors, the activities, and information flow through the process. In two cases IoT applications are implemented and in the other two cases not. This allows the identification of changes in the business processes as a result of IoT applications.
For each case study the following procedure is followed:
A first interview is conducted with a campus manager in which he/she is asked to go through a recent adjustment of the university’s campus strategy. For this interview, customer journey mapping (Halvorsrud et al., Citation2016) is used to structure the interview protocol and visualize the results. This method was chosen because it is a customer-centric method – the customer being the campus manager – and because it provides a comprehensive, visual overview.
The customer journey map is translated into diagrams. According to Bytheway (Citation2014), process analysis and information analysis are the two principal ways of visualizing an information system; in our cases, the information system serving campus management. For the process analysis, a high-level process diagram shows the relationship of campus management to other business processes, and a more detailed activity diagram shows the activities in campus management. For the information analysis an information diagram shows the information flow that supports campus management. The diagrams are visualized as basic flow charts, as these suffice in practically all cases (Koutamanis, Citation2019). displays the elements of these flow charts.
A second interview is conducted with the campus manager to validate the activity diagrams. In three cases, extra input was collected for the information diagrams as well.
The activity and information diagrams are adjusted accordingly. These diagrams form the basis for the analysis of IoT connectivity to strategic processes.
Figure 3. Nodes and arcs in a flow chart.
Literature study
Overview of IoT applications
Literature shows that IoT applications are applied to a wide range of built environments. Although our focus was mostly on academic buildings and offices, the studied literature also covers hospitals (Prentow et al., Citation2015; Ruiz-Ruiz et al., Citation2014; Stisen et al., Citation2017), outdoor settings (Abedi et al., Citation2013; Chang et al., Citation2010; Versichele et al., Citation2012), sports venues (Liebig et al., Citation2014; Stange et al., Citation2011), residential buildings (Chuah et al., Citation2013; Pesic et al., Citation2019; Villarrubia et al., Citation2014), train stations (Daamen et al., Citation2015; van den Heuvel & Hoogenraad, Citation2014), and airports (Schauer et al., Citation2014).
The literature has been categorized by type of application. We distinguish between nine types of IoT applications (). The application types most frequently present in literature are location-based user applications (18 times), optimizing building services (13 times), and monitoring user flows (13 times). Other application types are monitoring space use (5), building energy simulation (5), telecare (4), user detection (2), social sensing applications (2), and emergency response (1). There are three papers that report on multiple application types. Dave et al. (Citation2018) discuss the development of a platform that contains numerous location-based user applications, but also provides opportunities to optimize building services. Sutjarittham et al. (Citation2018) discuss four different pilots of IoT applications, which offer benefits to users via location-based user applications, as well as monitor the use of space. Romero Herrera et al. (Citation2018) make use of a platform that measures indoor climate and occupant comfort, which contains a location-based user application, and which can support optimization of building services. Each of these examples is considered separately under each row, which is why the total amount of IoT applications is 63 instead of 60. For each of these applications, the table shows which objectives are intended, which occupancy resolution is measured, which sensors are applied, and at which granularity the system delivers results.
Table 2. Types of IoT applications and their properties; in the appendix, the references are listed per application type.
Application type is closely linked to the type of objectives. As expected, location-based user applications are mostly aimed at supporting users, e.g. in wayfinding or improving comfort, just as optimizing building services is mostly aimed at energy savings. Monitoring user flows and monitoring space use are equally aimed at supporting users and optimizing costs. Similarly, most application types favour a specific occupancy resolution. For example, applications that monitor space use mostly measure on the resolution of occupancy, and telecare applications mostly measure on the resolution of activity.
With respect to granularity, most application types favour room level granularity or higher. The only exception is monitoring user flows, where results on floor and building level are found. Furthermore, in monitoring user flows and user detection, the granularity of outdoor settings is not always compatible to the indoor scale used in the table. In location-based user applications, there are also a few instances where the granularity is unknown; in these cases, experiments are conducted on a small scale (Chapre et al., Citation2013; Deak et al., Citation2010), making it difficult to determine the granularity.
Finally, when comparing application type to the sensors used, the diversity in sensing approaches becomes apparent. While some applications, such as location-based user applications and optimizing building services, seem to favour a certain sensing approach (Wi-Fi and multiple sensors, respectively), in other areas one type of sensor is not predominant. Furthermore, a significant number of papers make use of multiple sensing methods. In applications that optimize building services, researchers make use of sensors that measure aspects of the indoor environment, such as temperature, CO2, luminance, humidity, acoustics (Ekwevugbe et al., Citation2017; Ioannidis et al., Citation2017; Saralegui et al., Citation2019; Schwee et al., Citation2019). In two recent studies, these are combined with the collection of user feedback (Dave et al., Citation2018; Romero Herrera et al., Citation2018). Together with space utilization data, data on the indoor environment and user feedback can provide valuable information to support decision making.
Supporting decision-making processes
An important question in the literature study was how IoT applications can affect decision making in real estate management. For an answer, we first looked at the results presented in each paper: these results describe the performance of the IoT application itself (i.e. is the measurement of the technology accurate), the performance of the environment, or both. Measurements of the environment are for instance occupancy measurements, user flows, noise levels. With regards to the performance of the IoT applications, Mautz (Citation2012) named the performance benchmarking of implemented systems as one of the recommendations for further research. More recently, Mathisen et al. (Citation2016) have observed that few extensive evaluations of positioning methods have been reported in large-scale environments. For the purpose of this paper, results that measure the performance of the environment are especially relevant, as they can potentially inform organizational decision making: Among the studied papers, we find that 46 out of 60 papers report on the performance of the IoT application, whilst only 28 out of 60 papers report on the performance of the environment. 14 papers report both types of results. This suggests a tendency in literature to focus on the performance of the IoT application when reporting results; however, recently the literature has also reported more on the performance of the environment: see .
Table 3. Overview of the amount of papers by year, and the type of results they report.
In literature that reports results related to the performance of the environment, we looked for links to decision making. These fall under four categories. In the first category, the results improve understanding of what is studied. This does not necessarily mean that decision making is considered. For example, Stange et al. (Citation2011) have involved decision makers in their research and report that they have gained new insights on the movement behaviour of their customers. However, they do not mention what these insights are. Nor do report on any of the three other categories: improvements they may lead to, what they recommend based on the findings or how the decision makers used this information. In total, 10 out of 28 papers fall in this category.
In the second category, the results can be used for a specific improvement. These improvements can be realized through automation or through organizational processes. For example, Garg and Bansal (Citation2000) conclude that through automation ‘about 5% more energy can be saved by using smart occupancy sensor as compared to non-adapting fixed TD sensors’. Abedi et al. (Citation2014) write that
by identifying the peak periods of utilisation, the facility management team can optimise their performance by selecting critical periods for inspection and providing facilities. Also, this team can be aware of people’s response to space design change or new facility setup such as upgraded coffee machine, adding a TV and entertainment facilities.
In the third category, the results include advice for specific improvements in the environments. There are only two papers that contain such an advice. Zhang et al. (Citation2010) advise enlarging the spaces along the windows in the studied office because use of these spaces was found to be suboptimal in their IoT-based measurements. Wang and Shao (Citation2017) write that their results
revealed that the current 24-hour opening policy for the library during term time did not correlate with usage. On the other hand, the eight-hour library-opening duration during the summer holiday period could be extended to include the early evening hours to benefit user productivity.
Finally, in the fourth category, the authors report on the use of results in real-life decision-making processes. There is only one paper in this category. van den Heuvel and Hoogenraad (Citation2014) report that ‘our analysis of passenger route choice in Amsterdam Central station illustrate that planners should be careful with assumptions about pedestrian route choice inside train stations’. They then report which assumptions hold and do not hold, followed by the relation to decision making: ‘These findings have had significant implications for a major overhaul that is being planned.’ Additionally, the authors also refer to a separate paper that discusses in more detail how the results are used in decision making. In this example, the authors show the actual use of data in a decision-making process.
Almost all papers (25 out of 28) belong to the first two categories. In our view, this constitutes a research gap: when making strategic or tactical decisions in real estate management, it is not always apparent how the information from IoT applications are, could or should be used. Therefore, it is useful to analyse existing practices in organizations that already use IoT applications in decision making and compare it to others that do without. This research gap complements the previously stated research gaps regarding the performance of IoT applications: both of them obstruct successful delivery and implementation of IoT applications.
Strategic decision making in campus management
Contexts of the four case studies
The organizational processes, their activities and information flows are studied in four Dutch universities. To show the similarities across the four cases, a summary is provided in . In all cases, the universities have experienced a significant increase in student population. The organization of the executive branch and faculties is also similar but there are slight differences in the responsibilities of the real estate (RE) departments. In three of the four cases, the RE department is not responsible for facility management. In the fourth case, the RE department is not only also responsible for facility management, but moreover for other services: IT, the university library and procurement.
Table 4. Case studies and their characteristics.
shows the use of IoT applications in each case. At two universities, IoT applications are implemented to monitor the occupancy of education spaces, with an additional functionality of booking the study spaces. In the two other cases, pilots have been conducted with IoT applications and with the same goals and functionalities, as exploration of further steps towards IoT implementation.
Table 5. The use of IoT applications in case studies.
Analysis of decision-making processes
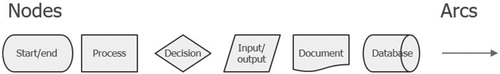
The first step of the analysis of the four cases is the comparison of the four process diagrams. In these diagrams, the processes of (re)developing a campus strategy are shown in relation to the involved actors and other organizational processes. This gives a high-level overview of what a university does (Bytheway, Citation2014). The four processes were so similar, that they could be generalized in the process diagram in . This diagram illustrates that planning the development of a campus requires many different stakeholders, as well as their specific inputs.
Figure 4. Process analysis: Process diagram displaying the generic strategy process in campus management in relation to other business processes. The responsibilities of the real estate department are emphasized.
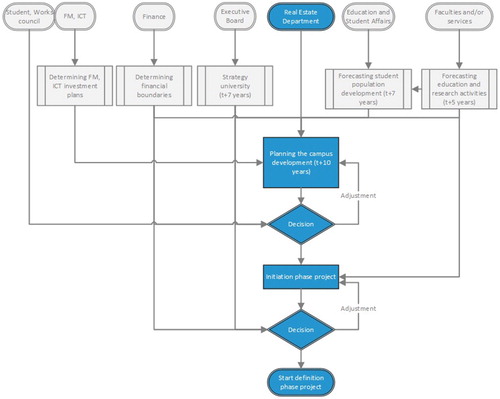
At the heart of the diagram (), the main process is shown (‘planning the campus development’). The outcomes of this process are used to initiate projects. In the four cases the projects described are the construction of a new education building, the renovation of a faculty building, the decision to retain and repurpose a building for education spaces, and the relocation of a faculty. Providing input to the main process are four separate processes: determining financial boundaries, the university strategy, forecasting student population, and forecasting education and research activities. Each of these processes can trigger the initiation of the main process. In the main process, the stakeholders responsible for the other processes provide the necessary input: for example, when the process is triggered by a changing forecast in student population, it also requires input with regards to the university strategy, financial boundaries and education and research activities. Each of these inputs can have a major impact on the decision; in order to understand those impacts a more detailed analysis is required.
The second step of the analysis is the comparison of the activity diagrams of the four cases. Activity diagrams show how the high-level process of ‘planning the campus development’ consists of lower-level activities. As such, they provide a fruitful starting point in understanding the overall function of a business application in relation to a business process (Bytheway, Citation2014). These activity diagrams closely reflect the actual practice at the four universities. Consequently, they formed the main output of the interviews and have been validated with the interviewees.
The first thing that one notices is that the four activity diagrams seem quite different: TU Eindhoven (appendix) is similar to Wageningen University, and TU Delft (appendix) is similar to Radboud University but there are significant differences between the two pairs. Business processes may seem very similar in a high-level analysis, but these lower-level analyses illustrate how different they can be in implementation. A comparison between two cases illustrates the most important differences.
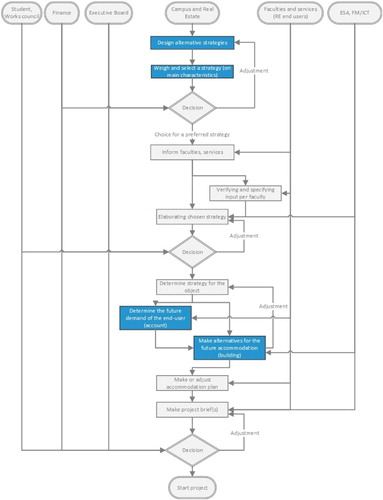
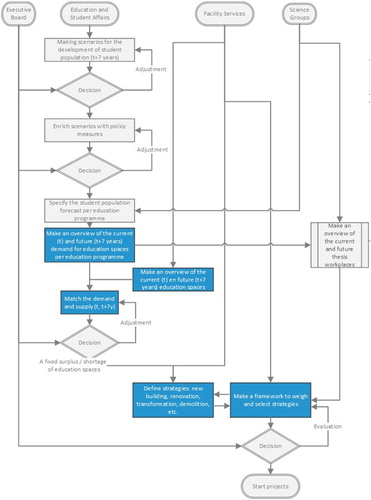
At Wageningen University, the process of redeveloping the campus strategy was triggered by an adjustment of the student forecast. The activity diagram () details how first scenarios for the forecast were made, after which they were combined with policy measures to arrive at a definitive student forecast. Note that these activities are related to a separate business process in the process analysis, i.e. forecasting student population. Then, with the definitive forecast, a specification was made per education program. This is necessary in order to determine the demands for education spaces on campus, which were compiled in an overview. This overview was compared with an overview of the available and planned education spaces in order to match the demand to supply. The matching returned a surplus or shortage of education spaces on campus. Finally, after deciding on the match, strategies were defined in order to address the surplus or shortage. In an iterative process, these were combined with requirements and other demands for spaces on campus to create a framework for weighing and selecting strategies. The process was finalized by deciding on a strategy, after which a project was initiated.
Figure 5. Activity diagram Wageningen University. The matching of supply and demand on a portfolio level and the subsequent definition of strategies are emphasized.
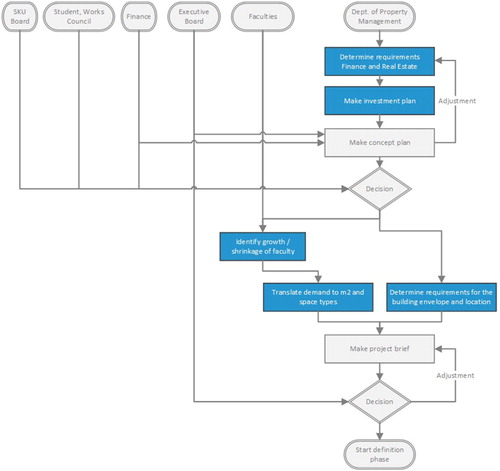
At Radboud University, the activity diagram () describes a regular update of the campus strategy. The RE department initiated the process by determining requirements for the strategy: these requirements were financial and real estate constraints (i.e. building age, condition level). Next, an investment plan was drawn up based on these requirements. This was translated into a draft plan, in consultation with the Finance department and the Executive Board. After determining this plan, a project was initiated for the relocation of a faculty. In this project, the growth or shrinkage of the faculty’s student and employee populations were identified, whilst at the same time determining the requirements for the building envelope and location. The forecast for the faculty’s population was translated into a demand for space (in m2 and space types), which together with the aforementioned requirements were compiled into a project brief. After fixing the project brief, the next phase of the project was started.
Figure 6. Activity diagram Radboud University. The definition of strategies and the subsequent matching of demand and supply on a building level are emphasized.
The first thing that must be noted is that the start and end of the activity diagrams are different. The activity diagram of Wageningen University partially describes activities in the process of forecasting the student population and does not describe the steps taken in the initiation of projects, whereas the diagram of Radboud University starts at the development of the campus strategy and ends with the conclusion of the initiation phase. Furthermore, unlike Radboud University, Wageningen University has implemented IoT technology. The first aspect in which the (re)development of the campus strategies differ, is how the process is started. As mentioned earlier, the ‘triggers’ are different in each case.
Next, the activities required to determine the campus strategy differ significantly in both cases. As a result, the content of the strategies is likely to be different as well. At Radboud, financial and real estate requirements are drawn up in order to make an investment plan. This plan is likely to be a sequence of building-level interventions. The demand for space is only determined after determining the campus strategy, in the initiation phase of a project. At Wageningen, the approach is the other way around. First, the demand for education spaces is determined on a portfolio (or campus) level, after which strategies are defined to satisfy this demand, given requirements and other demands for spaces.
The difference observed here is of major importance. As the complexity of decision making is increasing at the university, matching demand and supply only on a building level poses numerous risks. Firstly, an incomplete picture on a portfolio level may result in a wrong prioritization of building-level interventions. Secondly, accurately determining the demand in a building-level intervention is increasingly difficult due to the increasingly shared use of facilities on a campus level, possibly leading to a wrong estimation of the demand. As universities continue to move towards a more uncertain ‘match’ between demand for space and supply of spaces, a portfolio-level approach is desirable. In a portfolio-level approach, demand and supply are matched for each specific space type (education spaces, offices, laboratories, etc.) across the whole portfolio in order to inform the definition of strategies.
Matching IoT potential to campus management processes
Next, we combine the findings from the previous two sections. In the literature study, various IoT applications have been described and categorized. Through various sensing technologies, room-level data can be delivered not only on various occupancy resolutions, but also on environmental aspects, as well as user feedback. Through the case studies, we identify a need to match demand for spaces and supply of spaces per space type, on a portfolio level, in order to inform the definition of strategies. By using information analysis, it is possible to match the capacities of IoT applications to the information needs of the cases. According to Bytheway (Citation2014), information analysis focuses on entities and the information that is needed about them. Here, we try to understand how the information potentially available from IoT can support current processes; our information diagrams are thus to be understood as designs.
In , the result of the analysis is shown in an information diagram. This information diagram is based on the activity diagram of an existing case, Wageningen University. Information diagrams follow a similar structure to activity diagrams, with some slight differences. The parallelogram node is introduced as an element to show all the relevant information input into the process. Furthermore, the descriptions in the start/end nodes and the process nodes have changed: instead of showing descriptions of the stakeholders and the activities, they now show the input delivered by each stakeholder and the resulting output of each activity.
Figure 7. An information diagram showing the proposed information flow through the first part of the portfolio-level process at Wageningen University. The information needs of the entities and the IoT platform which delivers the required input are emphasized.
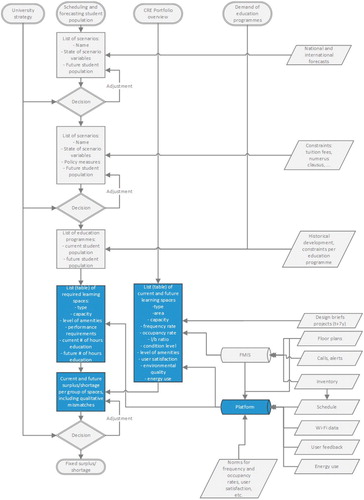
The highlighted parts of the information diagram show the intended relationship between the entities, i.e. the output of each activity, and the input directed towards it, i.e. its information needs. As can be seen in the diagram, the process requires two lists of all education spaces through two separate activities. In the first list, the information needs are the type of education space, the level of amenities of those spaces, their capacity, and the current and future number of hours that these spaces are required for education in each period. These are the information needed in order to determine the demand for education spaces: in amounts and characteristics. In the second list, the information needs are the type of education space, the area, capacity, length-width ratio, condition level, as well as frequency and occupancy rates, user satisfaction, energy performance, CO2 concentration, luminance, noise, etc. These are the information needed in order to determine the supply of education spaces: in amounts, characteristics and performance.
IoT applications thus deliver information to the overview of supply (together with scheduling and facility management information (FMIS) systems). In order to make use of this information, the overview of demand requires additional information: in , this is termed ‘performance requirements’. These requirements state for the minimum user satisfaction, maximum CO2 concentration, minimum occupancy rate, etc. They are not determined by the education programs, but shown as a separate input to the overview. Through the addition of IoT applications, information is added to the decision-making process that is essential for the subsequent definition of strategies. On the supply side, IoT helps to obtain a reliable overview of the current supply, which can be monitored and permanently evaluated. On the demand side, this helps to overcome issues in the definition of the demand, which may be limited in scope or erroneous due to the absence of performance assessment.
Without the information from IoT applications, the match between demand and supply may be evaluated wrongly. Without information on actual frequency and occupancy rates, it is likely that the required amount of space is incorrectly determined: actual frequency rates may be lower than those scheduled due to overbooking, or higher if there are many ad hoc activities. Without information on the user satisfaction, it is likely that incorrect assumptions are made about which existing spaces perform well and which do not. A high space utilization may be unjustly equated to mean a high user satisfaction, leading to disposition of spaces with low utilization which do meet user requirements. Without information on the indoor climate, it is likely that incorrect assumptions are made about why existing spaces underperform. For example, low user satisfaction or utilization may be caused by poor lighting, noise issues, or high CO2 concentrations.
In addition to the relationship between the entities and information needs, also states the position of an ‘platform’ in a database node. This is because in strategy processes, it is very time consuming to create an overview of the performance of each space in order to inform portfolio-level decisions. As it is displayed in the figure, the platform brings together the inputs from various IoT applications, other databases and sources in order to automate such an overview of the performance. The closer the overview in the platform adheres to the output stated by the activity, the more it will support the needs of the process.
Conclusion
The increasingly dynamic allocation and complex use of spaces at universities requires sharper tools not only in operation but also in strategic processes. Information on real-time space utilization is one of the foundations of such tools. The main question this paper set to answer was: How can IoT applications be used to effectively support (strategic) decision making in university campus management?
Through a literature study of 60 papers, we identified nine types of IoT applications. These nine types all use various types of sensing methods and measure a specific type of occupancy resolution. Most applications favour a room-level accuracy or higher. Other variables such as environmental aspects and user feedback are also measured. Then, through a study of the process of (re)developing a campus strategy in four cases, we identified activities to which IoT applications can deliver value. Through a cross-case comparison, we show that two cases ‘match’ their demand for space and supply of spaces prior to developing strategies (on a portfolio level), whereas two other cases do this after determining their strategy (on a building level). We argue that given the problem statement, a portfolio-level approach for each specific space type is preferable. Finally, we matched the capabilities of the IoT applications to the processes of the case studies. Here, we provide in detail the information needs of a portfolio-level process.
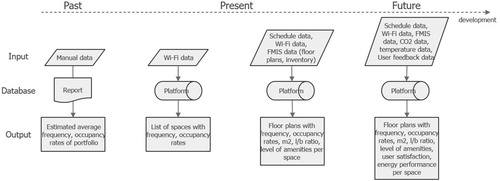
The activity and information diagrams provide a solid basis for integrating the IoT in campus management. Currently, many universities do not yet utilize IoT applications on their campus, or they focus on collecting a specific type of information: in the studied cases this was frequency and occupancy rates for education spaces. Given the multitude of information they can collect with IoT and the different space types they can collect it for, choosing which IoT applications to implement is a complex decision. Additionally, these implementations can be costly and uncertain. It is important to support campus managers and universities in choosing an appropriate IoT solution, especially given the growing number of IoT providers (see ).
Figure 8. Development towards SCT effectively supporting campus management with big data / use patterns
There are many potential areas for further research. Firstly, the literature study has shown that there is a research gap between research on information technology and its application in the REM domain. There is enough knowledge about the available technologies, but not about the demands from a REM perspective. This paper has studied how IoT can support a strategic process in campus management. Further research also needs to identify how IoT can effectively support tactical and operational decision-making processes on the university campus.
Secondly, there is also a need for more research on the potential impact of IoT applications on campus performance, and for large-scale experimental evaluations of IoT applications. Without it, universities may implement the wrong applications or not make effective use of the information resulting from it. A limited understanding of how IoT is integrated into campus management processes may lead to failures in IoT implementations: Cisco (Citation2017) reports that 60 per cent of all IoT initiatives do not move past the proof-of-concept stage, and that only 26 per cent of initiatives are considered a success; collaboration between IT and business was cited as the primary success factor.
Towards the future, there are many trends that will possibly influence the future demand of spaces at universities. Online education, changing funding mechanisms and life-long learning are but a few of these. Furthermore, the recent Coronavirus pandemic has shown to what extent unforeseen changes can disrupt the demand for space, and its effects are likely to impact the use of spaces at universities and many other places long after. With IoT applications in place, users of the current campus will be enabled to use the campus more effectively, and campus managers will be better positioned to assess the effects of these demands on space usage and adapt their campus strategies accordingly.
Appendix.docx
Download MS Word (281.6 KB)Acknowledgments
The authors would like to thank the campus managers of the four Dutch universities for their participation in this research.
Disclosure statement
No potential conflict of interest was reported by the author(s).
Data availability statement
The data that support the findings of this study are openly available at https://doi.org/10.4121/uuid:2dc9f21d-b514-4ed0-aea2-ebcead8cb256 and https://doi.org/10.4121/uuid:0e001d3b-b2cd-44e7-bb5a-e3b64c329b57.
Correction Statement
This article has been republished with minor changes. These changes do not impact the academic content of the article.
Related Research Data
References
- Abedi, N., Bhaskar, A., & Chung, E. (2013). Bluetooth and Wi-Fi MAC address based crowd data collection and monitoring: Benefits, challenges and enhancement. 36th Australasian Transport Research Forum (ATRF), Brisbane.
- Abedi, N., Bhaskar, A., & Chung, E. (2014). Tracking spatio-temporal movement of human in terms of space utilization using media-access-control address data. Applied Geography, 51, 72–81. https://doi.org/10.1016/j.apgeog.2014.04.001
- Balaji, B., Koh, J., Weibel, N., & Agarwal, Y. (2016). Genie: A longitudinal study comparing physical and software thermostats in office buildings. Ubicomp 2016.
- Balaji, B., Xu, J., Nwokafor, A., Gupta, R., & Agarwal, Y. (2013). Sentinel: Occupancy based HVAC actuation using existing WiFi infrastructure within commercial buildings. Sensys 2013, Rome, Italy.
- Bytheway, A. (2014). Investing in information. The information management body of knowledge. Springer International Publishing.
- Castro, P., Chiu, P., Kremenek, T., & Muntz, R. (2001). A probabilistic room location service for wireless networked environments. Ubicomp.
- Chang, S., Wolf, M., & Burdick, J. W. (2010, May 3–7). Human detection and tracking via ultra-wideband (UWB) Radar. 2010 IEEE International Conference on Robotics and Automation, Anchorage. https://doi.org/10.1109/ROBOT.2010.5509451
- Chapre, Y., Mohapatra, P., Jha, S., & Seneviratne, A. (2013, October 21–24). Received signal strength indicator and its analysis in a typical WLAN system (short paper). Proceedings – Conference on Local Computer Networks, LCN. https://doi.org/10.1109/LCN.2013.6761255
- Chen, J., & Ahn, C. (2014). Assessing occupants’ energy load variation through existing wireless network infrastructure in commercial and educational buildings. Energy and Buildings, 82, 540–549. https://doi.org/10.1016/j.enbuild.2014.07.053
- Chen, J., Chen, H., & Luo, X. (2019). Collecting building occupancy data of high resolution based on WiFi and BLE network. Automation in Construction, 102, 183–194. https://doi.org/10.1016/j.autcon.2019.02.016
- Chen, Y., Lymberopoulos, D., Liu, J., & Priyantha, B. (2013). Indoor localization using FM signals. IEEE Transactions on Mobile Computing, 12(8), 1502–1517. https://doi.org/10.1109/TMC.2013.58. Article 6516864.
- Christensen, K., Melfi, R., Nordman, B., Rosenblum, B., & Viera, R. (2014). Using existing network infrastructure to estimate building occupancy and control plugged-in devices in user workspaces. International Journal of Communication Networks and Distributed Systems, 12(1), 4–29. https://doi.org/10.1504/IJCNDS.2014.057985
- Chuah, J. W., Li, C., Jha, N. K., & Raghunathan, A. (2013, January 5–10). Localized heating for building energy efficiency. Proceedings of the IEEE International Conference on VLSI Design. https://doi.org/10.1109/VLSID.2013.155
- Chung, T. M., & Burnett, J. (2001). On the prediction of lighting energy savings achieved by occupancy sensors. Energy Engineering: Journal of the Association of Energy Engineering, 98(4), 6–23. https://doi.org/10.1092/6H6F-YLH1-NKHE-YFAL
- Cisco. (2017). Cisco survey reveals close to three-fourths of IoT projects are failing.
- D'Souza, M., Wark, T., Karunanithi, M., & Ros, M. (2013). Evaluation of realtime people tracking for indoor environments using ubiquitous motion sensors and limited wireless network infrastructure. Pervasive and Mobile Computing, 9(4), 498–515. https://doi.org/10.1016/j.pmcj.2012.03.007
- Daamen, W., Van den Heuvel, J. P. A., Ton, D., & Hoogendoorn, S. (2015, July 19–25). Using Bluetooth and WiFi to unravel real-world slow mode activity travel behaviour. 14th International Conference on Travel Behaviour Research, Windsor, United Kingdom.
- Dave, B., Buda, A., Nurminen, A., & Främling, K. (2018). A framework for integrating BIM and IoT through open standards. Automation in Construction, 95, 35–45. https://doi.org/10.1016/j.autcon.2018.07.022
- Deak, G., Curran, K., & Condell, J. (2010). Evaluation of smoothing algorithms for a RSSI-based device-free passive localisation. Advances in Intelligent and Soft Computing, 84, 469–476. https://doi.org/10.1007/978-3-642-16295-4_52
- Den Heijer, A. C. (2011). Managing the university campus. Eburon Academic Publishers.
- Den Heijer, A., & Tzovlas, G. (2014). The European Campus – heritage and challenges. Institution is TU Delft.
- Dodier, R. H., Henze, G. P., Tiller, D. K., & Guo, X. (2006). Building occupancy detection through sensor belief networks. Energy and Buildings, 38(9), 1033–1043. https://doi.org/10.1016/j.enbuild.2005.12.001
- Ekwevugbe, T., Brown, N., Pakka, V., & Fan, D. (2017). Improved occupancy monitoring in non-domestic buildings. Sustainabile Cities and Society, 30(2017), 97–107. https://doi.org/10.1016/j.scs.2017.01.003
- Furey, E., Curran, K., & McKevitt, P. (2012). HABITS: A Bayesian filter approach to indoor tracking and location. International Journal of Bio-Inspired Computation, 4(2), 79–88. https://doi.org/10.1504/IJBIC.2012.047178
- Garg, V., & Bansal, N. K. (2000). Smart occupancy sensors to reduce energy consumption. Energy and Buildings, 32(1), 81–87. https://doi.org/10.1016/S0378-7788(99)00040-7
- Gubbi, J., Buyya, R., Marusic, S., & Palaniswami, M. (2013). Internet of Things (IoT): A vision, architectural elements, and future directions. Future Generation Computer Systems, 29(7), 1645–1660. https://doi.org/10.1016/j.future.2013.01.010
- Halvorsrud, R., Kvale, K., & Folstad, A. (2016). Improving service quality through customer journey analysis. Journal of Service Theory and Practice, 26(6), 840–867. https://doi.org/10.1108/JSTP-05-2015-0111
- Ioannidis, D., Zikos, S., Krinidis, S., Tryferidis, A., Tzovaras, D., & Likothanassis, S. (2017). Occupancy-driven facility management and building performance analysis. International Journal of Sustainable Development Planning, 12(7), 1155–1167. https://doi.org/10.2495/SDP-V12-N7-1155-1167
- Jiang, Y., Pan, X., Li, K., Lv, Q., Dick, R. P., Hannigan, M., & Shang, L. (2012, September 5–8). ARIEL: Automatic Wi-Fi based room fingerprinting for indoor localization. UbiComp’12 – Proceedings of the 2012 ACM Conference on Ubiquitous Computing. https://doi.org/10.1145/2370216.2370282
- Kadamus, J. (2013). The state of facilities in higher education. 2013 Benchmarks, best practices, & trends. Sightlines LLC.
- Kilic, Y., Wymeersch, H., Meijerink, A., Bentum, M. J., & Scanlon, W. G. (2014). Device-free person detection and ranging in UWB networks. IEEE Journal on Selected Topics in Signal Processing, 8(1), 43–54. https://doi.org/10.1109/JSTSP.2013.2281780 Article 6600737.
- Kjaergaard, M. B., Wirz, M., Roggen, D., & Troster, G. (2012, March 19–23). Mobile sensing of pedestrian flocks in indoor environments using WiFi signals. 2012 IEEE International Conference on Pervasive Computing and Communications, PerCom 2012. https://doi.org/10.1109/PerCom.2012.6199854
- Kosba, A. E., Saeed, A., & Youssef, M. (2012, April 1–4). Robust WLAN device-free passive motion detection. IEEE Wireless Communications and Networking Conference, WCNC. https://doi.org/10.1109/WCNC.2012.6214375
- Koutamanis, A. (2019). Building information – representation and management: Fundamentals and principles. TU Delft.
- Labeodan, T., Aduda, K., Zeiler, W., & Hoving, F. (2016). Experimental evaluation of the performance of chair sensors in an office space for occupancy detection and occupancy-driven control. Energy and Buildings, 111(2016), 195–206. https://doi.org/10.1016/j.enbuild.2015.11.054
- Lepori, B., & Reale, E. (2019). The changing governance of research systems. Agencification and organisational differentiation in research funding organisations. In D. Simon, S. Kuhlmann, J. Stamm, & W. Canzler (Eds.), Handbook of science and public policy (pp. 448–465). Edward Elgar Publishing.
- Liebig, T., Andrienko, G., & Andrienko, N. (2014). Methods for analysis of spatio-temporal Bluetooth tracking data. Journal of Urban Technology, 21(2), 27–37. https://doi.org/10.1080/10630732.2014.888215
- Lim, C. H., Ng, B. P., & Da, D. (2008). Robust methods for AOA geo-location in a real-time indoor WiFi system. Journal of Location Based Services, 2(2), 112–121. https://doi.org/10.1080/17489720802415189
- Liu, X., Makino, H., Kobayashi, S., & Maeda, Y. (2008). Research of practical indoor guidance platform using fluorescent light communication. IEICE Transactions on Communications, E91-B(11), 3507–3515. https://doi.org/10.1093/ietcom/e91-b.11.3507
- Lopez-Novoa, U., Aguilera, U., Emaldi, M., Lopez-de-Ipina, D., Perez-de-Albeniz, I., Valerdi, D., Iturricha, I., & Arza, E. (2017). Overcrowding detection in indoor events using scalable technologies. Pervasive Ubiquitous Computing, 21, 507–519. https://doi.org/10.1007/s00779-017-1012-6
- Maraslis, K., Cooper, P., Tryfonas, T., & Oikomonou, G. (2016). An intelligent hot-desking model based on occupancy sensor data and its potential for social impact. In A. e. a. Hameurlain (Ed.), Transactions on large-scale data- and knowledge-centred systems XXVII (pp. 142–158). Springer-Verlag.
- Martani, C., Lee, D., Robinson, P., Britter, R., & Ratti, C. (2012). ENERNET: Studying the dynamic relationship between building occupancy and energy consumption. Energy and Buildings, 47, 584–591. https://doi.org/10.1016/j.enbuild.2011.12.037
- Mathisen, A., Sorensen, S. K., Stisen, A., Blunck, H., & Gronbaek, K. (2016, October 4–7). A comparative analysis of indoor WiFi positioning at a large building complex. 2016 International Conference on Indoor Positioning and Indoor Navigation (IPIN), Alcara de Henares, Spain. https://doi.org/10.1109/IPIN.2016.7743666
- Mautz, R. (2012). Indoor positioning technologies [Habilitation thesis, ETH Zurich ]. https://doi.org/10.3929/ethz-a-007313554
- McCann, L., Hutchison, N., & Adair, A. (2019). External funding of major capital projects in the UK higher education sector: Issues of demand, supply and market timing? Journal of Property Research, 36(1), 97–130. https://doi.org/10.1080/09599916.2019.1590453
- Mohottige, I. P., & Moors, T. (2018, October 1–4). Estimating room occupancy in a smart campus using WiFi soft sensors. IEEE 43rd Conference on Local Computer Networks. https://doi.org/10.1109/LCN.2018.8638098
- NAO. (1996). Space management in higher education: A good practice guide.
- Newell, G., & Manaf, Z. (2017). Education as an asset class.
- Nyarko, K., & Wright-Brown, C. (2013, November 12–14). Cloud based passive building occupancy characterization for attack and disaster response. 2013 IEEE International Conference on Technologies for Homeland Security, HST 2013. https://doi.org/10.1109/THS.2013.6699097
- OECD. (2019). Education at a glance 2019. OECD indicators.
- Orozco-Ochoa, S., Vila-Sobrino, X. A., Rodríguez-Damián, M., & Rodríguez-Liñares, L. (2011). Bluetooth-based system for tracking people localization at home. Advances in Intelligent and Soft Computing, 91, 345–352. https://doi.org/10.1007/978-3-642-19934-9_44
- Pesic, S., Tosic, M., Ikovic, O., Radovanovic, M., Ivanovic, M., & Boskovic, D. (2019). BLEMAT: Data analytics and machine learning for smart building occupancy detection and Prediction. International Journal of Artificial Intelligence Tools, 28(06), 1960005. https://doi.org/10.1142/S0218213019600054
- Prentow, T. S., Ruiz-Ruiz, A. J., Blunck, H., Stisen, A., & Kjærgaard, M. B. (2015). Spatio-temporal facility utilization analysis from exhaustive WiFi monitoring. Pervasive and Mobile Computing, 16(PB), 305–316. https://doi.org/10.1016/j.pmcj.2014.12.006
- Prentow, T. S., Thom, A., Blunck, H., & Vahrenhold, J. (2015, June 15–18). Making sense of trajectory data in indoor spaces. 2015 16th IEEE International Conference on Mobile Data Management, https://doi.org/10.1109/MDM.2015.44
- Rachuri, K. K., Efstratiou, C., Leontiadis, I., Mascolo, C., & Rentfrow, P. J. (2014). Smartphone sensing offloading for efficiently supporting social sensing applications. Pervasive and Mobile Computing, 10(PART A), 3–21. https://doi.org/10.1016/j.pmcj.2013.10.005
- Rodríguez-Martín, D., Pérez-López, C., Samà, A., Cabestany, J., & Català, A. (2013). A wearable inertial measurement unit for long-term monitoring in the dependency care area. Sensors (Switzerland), 13(10), 14079–14104. https://doi.org/10.3390/s131014079
- Romero Herrera, N., Doolaard, J., Guerra-Santin, O., Jaskiewicz, T., & Keyson, D. (2018). Office occupants as active actors in assessing and informing comfort: A context-embedded comfort assessment in indoor environmental quality investigations. Advances in Building Energy Research. https://doi.org/10.1080/17512549.2018.1488620
- Ruiz-Ruiz, A. J., Blunck, H., Prentow, T. S., Stisen, A., & Kjaergaard, M. B. (2014, March 24–28). Analysis methods for extracting knowledge from large-scale WiFi monitoring to inform building facility planning. 2014 IEEE International Conference on Pervasive computing and Communications, PerCom 2014. https://doi.org/10.1109/PerCom.2014.6813953
- Sankari, I., Peltokorpi, A., & Nenonen, S. (2018). A call for co-working – users’ expectations regarding learning spaces in higher education. Journal of Corporate Real Estate, 20(2), 117–137. https://doi.org/10.1108/JCRE-03-2017-0007
- Saralegui, U., Anton, M. A., Arbelaitz, O., & Muguerza, J. (2019). Smart Meeting room usage information and prediction by modelling occupancy profiles. Sensors, 19(2), 353. https://doi.org/10.3390/s19020353
- Schauer, L., Werner, M., & Marcus, P. (2014). Estimating crowd densities and pedestrian flows using Wi-Fi and Bluetooth. Mobiquitous 2014, London, Great Britain.
- Schulze-Cleven, T., & Olson, J. R. (2017). Worlds of higher education transformed: Toward varieties of academic capitalism. Higher Education, 73(6), 813–831. https://doi.org/10.1007/s10734-017-0123-3
- Schwee, J. H., Johansen, A., Jorgensen, B. N., Kjaergaard, M. B., Mattera, C. G., Sangogboye, F. C., & Veje, C. (2019). Room-level occupant counts and environmental quality from heterogeneous sensing modalities in a smart building. Scientific Data, 6(1), 1–11. https://doi.org/10.1038/s41597-019-0274-4
- Serraview. (2015). Managing workplace Utilization. IoT & other technologies for tracking workplace utilization. http://info.serraview.com/workplace-utilization-free-guide
- Shrestha, S., Talvitie, J., & Lohan, E. S. (2013, November 5–7). On the fingerprints dynamics in WLAN indoor localization. 2013 13th International Conference on ITS Telecommunications, ITST 2013. https://doi.org/10.1109/ITST.2013.6685532
- Space Management Group. (2006). Space utilisation: practice, performance and guidelines.
- Stange, H., Liebig, T., Hecker, D., Andrienko, G., & Andrienko, N. (2011). Analytical workflow of monitoring human mobility in big event settings using Bluetooth. Proceedings of the 3rd ACM SIGSPATIAL International Workshop on Indoor Spatial Awareness, ISA’11.
- Stisen, A., Blunck, H., Kjaergaard, M. B., Prentow, T. S., Mathisen, A., Sorensen, S., & Gronbaek, K. (2017). Task phase recognition and task progress estimation for highly mobile workers in large building complexes. Pervasive and Mobile Computing, 38(2017), 418–429. https://doi.org/10.1016/j.pmcj.2016.08.016
- Sutjarittham, T., Gharakheili, H. H., Kanhere, S. S., & Sivaraman, V. (2018, December 16–19). Realizing a smart university campus: Vision, architecture, and implementation. IEEE International Conference on Advanced Networks and Telecommunications Systems (ANTS). https://doi.org/10.1109/ANTS.2018.8710084
- Sutjarittham, T., Gharakheili, H. H., Kanhere, S. S., & Sivaraman, V. (2019). Experiences with IoT and AI in a smart campus for optimizing classroom usage. IEEE Internet of Things Journal, 6(5), 7595–7607. https://doi.org/10.1109/JIOT.2019.2902410
- Talvitie, J., Renfors, M., & Lohan, E. S. (2015). Distance-based interpolation and extrapolation methods for RSS-based localization with indoor wireless signals. IEEE Transactions on Vehicular Technology, 64(4), 1340–1353. https://doi.org/10.1109/TVT.2015.2397598. Article 7024940.
- Tekler, Z. D., Low, R., Gunay, B., Andersen, R. K., & Blessing, L. (2020). A scalable Bluetooth low energy approach to identify occupancy patterns and profiles in office spaces. Building and Environment, 171(2020), 106681. https://doi.org/10.1016/j.buildenv.2020.106681
- Toh, C., & Lau, S. L. (2016, October 17–21). Indoor localisation using existing WiFi infrastructure – a case study at a university building. 22nd International Conference on Virtual system & Multimedia (VSMM). https://doi.org/10.1109/VSMM.2016.7863151
- TU Delft. (2016). Campus NL – Investeren in de toekomst (commissioned by the VSNU and 14 universities.
- Utsch, P., & Liebig, T. (2012, June 26–29). Modeling microscopic pedestrian mobility using Bluetooth. 2012 Eighth International Conference on Intelligent Environments, Guanajuato, Mexico. https://doi.org/10.1109/IE.2012.32
- Valks, B., Arkesteijn, M. H., Den Heijer, A. C., & Vande Putte, H. J. M. (2018). Smart campus tools. Adding value to university goals by measuring real-time space use. Journal of Corporate Real Estate. https://doi.org/10.1108/JCRE-03-2017-0006
- van den Heuvel, J. P. A., & Hoogenraad, J. H. (2014). Monitoring the performance of the pedestrian transfer function of train stations using automatic fare collection data. Transportation Research Procedia, 2(2014), 642–650. https://doi.org/10.1016/j.trpro.2014.09.107
- Vathsangam, H., Tulsyan, A., & Sukhatme, G. S. (2011, May 23–25). A data-driven movement model for single cellphone-based indoor positioning. Proceedings – 2011 International Conference on Body Sensor Networks, BSN 2011. https://doi.org/10.1109/BSN.2011.33
- Versichele, M., Neutens, T., Delafontaine, M., & Van de Weghe, N. (2012). The use of Bluetooth for analysing spatiotemporal dynamics of human movement at mass events: A case study of the Ghent festivities. Applied Geography, 32(2), 208–220. https://doi.org/10.1016/j.apgeog.2011.05.011
- Villarrubia, G., Bajo, J., De Paz, J. F., & Corchado, J. M. (2014). Monitoring and detection platform to prevent anomalous situations in home care. Sensors (Switzerland), 14(6), 9900–9921. https://doi.org/10.3390/s140609900
- Vu, L., Nahrstedt, K., Retika, S., & Gupta, I. (2010, 17–21 October). Joint Bluetooth/WiFi scanning framework for characterizing and leveraging people movement in university campus. MSWiM’10 – Proceedings of the 13th ACM International Conference on Modeling, Analysis, and Simulation of Wireless and Mobile Systems. https://doi.org/10.1145/1868521.1868563
- Wang, W., Chen, J., Huang, G., & Lu, Y. (2017). Energy efficient HVAC control for an IPS-enabled large space in commercial buildings through dynamic spatial occupancy distribution. Applied Energy, 207(2017), 305–323. https://doi.org/10.1016/j.apenergy.2017.06.060
- Wang, Y., & Shao, L. (2017). Understanding occupancy and user behaviour through Wi-Fi based indoor positioning. Building Research & Information. https://doi.org/10.1080/09613218.2018.1378498
- Zhang, X., Izato, T., Munenoto, J., Matsushita, D., & Yoshida, T. (2010). Relationship between office workers’ staying and workstation attributes in a non-territorial office using ultra wide band sensor network. Fronties of Architecture and Civil Engineering in China, 4(4). https://doi.org/10.1007/s11709-010-0076-4
Appendix
Table A1. Extension of showing the literature categorized per application type.
Figure A1. Activity diagram TU Eindhoven. The matching of supply and demand on a portfolio level and the subsequent definition of strategies are emphasized.
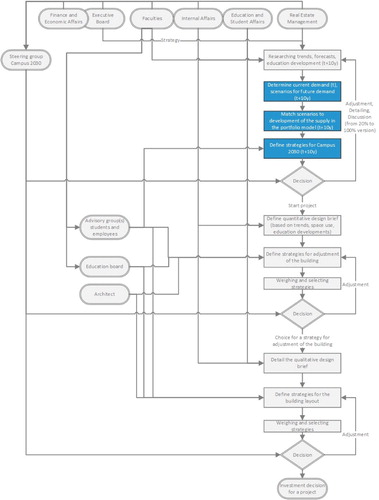
Figure A2. Activity diagram TU Delft. The definition of strategies and the subsequent matching of demand and supply on a building level are emphasized.