
 ?Mathematical formulae have been encoded as MathML and are displayed in this HTML version using MathJax in order to improve their display. Uncheck the box to turn MathJax off. This feature requires Javascript. Click on a formula to zoom.
ABSTRACT
Residential energy policies for individual dwellings predominantly provide minimum design standards for thermal performance and energy efficiency on a square metre basis. This paper quantifies predicted dwelling energy use on a national scale to enable evaluation of the effectiveness of this policy model. Utilizing Australia as a case study, analysis of 580,956 thermal energy design certificates for new detached dwellings verifies that, although minimum energy efficiency design standards were achieved, predicted energy use for thermal comfort increased by 10.4% per dwelling and 5.6% nationally in 2022 compared to 2018. The study examines the impact of both the number and floor area of new dwellings on dwelling energy use and highlights the disparate jurisdictional outcomes resulting from inconsistent implementation of national policy across multi-state governance. To deliver reductions in household energy use it is imperative that residential energy policies target household energy use, rather than only energy efficiency, of new dwellings, of which floor area is a key determinant. Furthermore, to achieve global climate change objectives, there is a need for complementary policy mechanisms that consider the collective energy use of the residential dwelling sector.
Introduction
Globally, 30% of primary energy is consumed by buildings, and residential buildings are the largest contributing sub-sector (IEA, Citation2022). Energy policy interventions have historically focused on technological and efficiency improvements or ‘behaviour change’ initiatives, while upholding the freedom of choice of individuals to their desired lifestyle (Welch & Southerton, Citation2019). However, globally, despite a 7.3% improvement in building energy efficiency between 2010 and 2021, the concurrent 22% increase in global floor area resulted in a 10% increase in the total energy consumption of the building sector (IEA, Citation2022). Space cooling energy consumption increased by 6.5% in 2020–2021 alone and the IEA (Citation2022) predict that floor areas will increase by a further 20% by 2030, exacerbating broader societal aspects such as embodied carbon and fuel poverty challenges. Overall, these compounding factors place the building sector not on track to achieve Paris agreement commitments (IEA, Citation2022, p. 1). To achieve global objectives, a radical change of building energy policy approaches is required to encompass individual consumption within broader societal systems (Fuchs et al., Citation2021; Royston et al., Citation2018; Welch & Southerton, Citation2019).
There is an imperative for contemporary dwellings to be designed to achieve global environmental obligations, and building energy regulations are critical to ensuring this. Adoption of building energy regulations commenced in the early 1950s in Sweden (Hjorth et al., Citation2011), with other countries such as Denmark (Thomson et al., Citation2018) and the UK (Cohen & Bordass, Citation2015) following in the 1960s, and the US (Deason & Hobbs, Citation2011) and Germany (Schettler-Köhler & Ahlke, Citation2016) in the 1970s. Beginning as prescriptive insulation requirements for new homes, regulations have evolved to performance based requirements enabled by modern building energy simulation software (IEA, Citation2013). While regulations remain nuanced to individual countries, they are commonly underpinned by a focus on improved energy efficiency (Evans et al., Citation2017). Research has demonstrated that dwellings designed to higher energy efficiency standards require less energy (Berry et al., Citation2014; Dixon et al., Citation2010), and that improvements in energy efficiency have been achieved (Gaglia et al., Citation2019). However, there is increasing scrutiny of whether the underpinning energy efficiency methodology itself is capable of reducing the overall energy consumption of residential dwellings (Kellogg & Cumbre-Gibbs, Citation2023; Kotchen, Citation2017). As society establishes net-zero aspirations, criticism has been raised of the current focus on operational energy efficiency in the building sector (Ness, Citation2020). Housing energy efficiency policy has overlooked housing sufficiency which, although challenging to liberal consumerist culture, has the potential to significantly reduce housing energy use on an individual and national scale (Speck & Hasselkuss, Citation2015). Similarly, Shove (Citation2018) criticizes the focus on efficiency and argues for a reassessment of the need for energy consumption. Renewable energy sources and net-zero policy approaches will have more successful outcomes if initial priority is given to reducing the absolute energy use of dwellings.
Globally, there is considerable disparity in dwelling floor area per capita, ranging from 10 m2 per person in India, to 80 m2 per person in Australia (Ellsworth-Krebs, Citation2020). Significantly, most nations have experienced substantial increases in floor area per capita over the last 60 years (Ellsworth-Krebs, Citation2020). Huebner and Shipworth (Citation2017) demonstrate building size has the greatest influence on dwelling energy consumption and advocate for energy policy to encourage reduced building size through downsizing. Viggers et al. (Citation2017) analysed contemporary detached dwelling plans in New Zealand and affirmed that despite the introduction of building energy regulations, the increased dwelling floor area that has occurred over the last 40 years nullified potential reductions in household energy consumption. Similarly, Clune et al. (Citation2012) simulated energy consumption of 72 Australian dwellings and estimated that due to increased dwelling size, the effectiveness of energy efficiency stringency improvements was reduced by 38%. In a study of state-level electricity consumption data in the US, Aroonruengsawat et al. (Citation2012) found up to a 5% decrease in energy consumption per capita attributable to building energy codes between 1970 and 2006. Another study, utilizing over a decade of billing data for 2239 new dwellings in Florida US, affirmed building energy code stringency achieved an enduring reduction of natural gas consumption, however found electricity consumption concurrently increased (Kotchen, Citation2017). Internationally, there is a scarcity of large-scale quantification of the outcomes of current building energy regulations to enable evaluation of the effectiveness of the energy efficiency policy model. Utilizing Australia as a national-scale case study, this current research analyses design data for new detached dwellings over a five-year period, to evaluate whether the energy use intensity metric (MJ/m2) which underpins Australian energy efficiency policy, has delivered reductions in predicted energy use (MJ/yr) for new detached homes on a household, jurisdictional and national scale.
Whilst it is acknowledged that apartment living is becoming increasingly prevalent (Kerr et al., Citation2021), detached dwellings remain the dominant housing typology in countries such as the US (USCB, Citation2023), Canada (Statistics Canada, Citation2023) and Australia (ABS, Citation2021). Detached residential dwellings are therefore the focus of this research.
Australian detached homes are amongst the world’s largest (Khajehzadeh & Vale, Citation2017; McKinlay et al., Citation2019), consequently the impact of floor area on dwelling energy use is of particular importance. This study aims to assess the significance of floor area in achieving tangible progress towards energy reduction commitments. Multi-level governance provides additional challenges to the consistent implementation of national building policy, a challenge shared by the majority of OECD countries including Australia (OECD, Citation2018). This research aims to establish how state policies in Australia influence the overall national outcomes for energy efficiency design of new detached homes. Furthermore, Australia’s latitudinal extent provides a unique opportunity to assess a national building energy policy across disparate climatic conditions.
Housing energy use
While there is variability between countries due to climate, relative wealth and access to air conditioning, approximately one-third of global residential building energy is utilized for heating and cooling for thermal comfort (known as ‘space conditioning’) (González-Torres et al., Citation2022). This proportion is consistent in Australia, where an average 39% of a dwelling’s energy use is estimated to be consumed for space conditioning () (EnergyConsult, Citation2021). However, due to climatic variability, there is significant disparity in the proportion of energy use for space conditioning across Australia’s jurisdictions (19–61%) (). There is also significant jurisdictional disparity in total dwelling energy use, with dwellings in colder climates requiring almost twice as much energy (50–60 GJ/dwelling/yr) as all other jurisdictions of Australia (28–36 GJ/dwelling/yr) (EnergyConsult, Citation2021). Australian housing energy policy has focused on energy efficiency for thermal comfort, although some jurisdictions have included other energy end uses (Moore et al., Citation2019).
Figure 1. Australian Household Energy End Use 2020: National Average and Jurisdictional Variance (developed by authors based on data from EnergyConsult [Citation2021]).
![Figure 1. Australian Household Energy End Use 2020: National Average and Jurisdictional Variance (developed by authors based on data from EnergyConsult [Citation2021]).](/cms/asset/f831f5ad-f146-4b86-b177-2b3b0b4ebe27/rbri_a_2301574_f0001_oc.jpg)
Energy use intensity and energy use
Energy use intensity (EUI) is a measure of the efficiency of total energy use and can be applied to both housing structures and household appliances (C.-f. Chen et al., Citation2022). For space conditioning, the EUI provides a measure of energy required per square metre of floor area (MJ/m2/yr). A dwelling’s predicted total space conditioning energy use (MJ/yr) can be calculated by multiplying the final predicted EUI (MJ/m2/yr) by the conditioned floor area (m2) of the dwelling. Simulation tools enable prediction of the EUI based on various house design parameters, and apply consistent assumptions for factors such as occupant behaviour and temperature setpoint choices (DoEE, Citation2019). Australia’s principal standard for building new homes has the overriding objective to reduce greenhouse gas emissions (ABCB, Citation2019b, p. 1) with regulatory implementation primarily based on the predicted energy requirement to maintain thermal comfort, normalized on a square metre basis (i.e. MJ/m2). Likewise, globally, the focus of the majority of building energy regulation is EUI rather than energy use per dwelling. However, there is growing discourse that achieving an overall reduction in dwelling energy use will require an alternative different approach (e.g. Ellsworth-Krebs, Citation2020; Huebner & Shipworth, Citation2017). Other industry sectors utilize total load metrics in conjunction with efficiency metrics to achieve both short- and long-term objectives (Australian Government, Citation2022b; Raha, Citation2007). This research quantifies predicted space conditioning energy use to assess the outcomes of the EUI policy metric – if EUI is an effective policy mechanism, energy use within the residential sector should be reduced.
New detached dwelling floor area
In a study comparing per capita floor area for all dwelling types (i.e. apartments and detached) of 13 countries, most countries demonstrated substantial increases in floor area over the last three decades (Ellsworth-Krebs, Citation2020). This previous research establishes that a focus on floor area per capita, rather than energy efficiency per square metre, may yield improvements in overall energy demand, identifying the need for housing energy policy to acknowledge the influence of house size on total energy demand of a dwelling.
Consistently over time, the largest per capita floor areas are in Australia, at approximately double that in the UK and 25% larger than in the US (Ellsworth-Krebs, Citation2020). Khajehzadeh and Vale (Citation2017) rank new detached dwellings in Australia as the largest in the world (). It is well recognized that the average floor area of detached dwellings in Australia is getting larger (e.g. Clune et al., Citation2012; McKinlay et al., Citation2019; McMullan & Fuller, Citation2015), increasing by more than 50% from the mid-1980s to 2009 (Dalton et al., Citation2011). Furthermore, despite the increasing floor area of homes, the number of people per household in Australia decreased from 2.8 to 2.5 during the period 1991–2021 (ABS, Citation2017, Citation2021).
Figure 2. International comparison of new detached dwelling floor sizes (developed by authors based on data from Khajehzadeh & Vale [Citation2017]).
![Figure 2. International comparison of new detached dwelling floor sizes (developed by authors based on data from Khajehzadeh & Vale [Citation2017]).](/cms/asset/3295f06d-e7c0-4e0e-852c-ba6056363ceb/rbri_a_2301574_f0002_oc.jpg)
Population growth
Globally, population is projected to grow by over 20% by 2050 with more than half of that within Africa, India and Asia (UN-DESA, Citation2022). While global regions will experience disparate rates of population growth, all regions are projected with positive growth by 2030 (UN-DESA, Citation2022) which, coupled with increasing per capita dwelling floor areas, has direct implications for the overall energy use of the residential dwelling sector. The building industry has thus far assumed that growth in floor area is a necessary requirement to meet the needs of population growth. However, there is a growing acknowledgment that achieving global sustainable consumption, resource usage and climate change goals will require a reassessment of politics and policy frameworks to incorporate the concept of sufficiency (e.g. Callmer & Bradley, Citation2021; Speck & Hasselkuss, Citation2015; Welch & Southerton, Citation2019).
In Australia, while the ABS (Citation2018) projected modest long-term population growth of 0.9–1.4% per annum, in the decade from 2011 to 2021 the population in capital cities increased by 17% (ABS, Citation2022). Suburban expansion resulted in new greenfield suburbs in the outer areas of the capital cities of Sydney and Melbourne, each suburb with new homes for over 20,000 people (ABS, Citation2022). In Melbourne, greenfield developments have contributed over half of the city’s urban development in the last 30 years (Daley & Coates, Citation2018). Single detached dwellings are prevalent in greenfield suburbs and contribute a significant proportion of Australia’s new residential floor area. These high rates of greenfield suburban expansion are inconsistent with the IEA (Citation2022) projections of 2030 building energy use, which attribute only 1.3%/yr increase in the overall floor area of advanced economies such as Australia.
Case study: Australia
Australia is a large continent with eight geopolitical states/territories (): New South Wales (NSW), Victoria (VIC), Queensland (QLD), South Australia (SA), Western Australia (WA), Tasmania (TAS), Australian Capital Territory (ACT) and Northern Territory (NT). Over 75% of the nation’s new housing is located in the eastern jurisdictions of VIC, NSW and QLD (ABS, Citation2023). Australia has eight diverse climatic zones (, ). The overarching regulatory instrument for the design and construction of residential buildings in Australia is the National Construction Code (NCC) which is implemented via state/territory-based regulations, enabling regional variations in application (ABCB, Citation2020). The focus of this research is on ‘Class 1’ buildings, defined by the NCC as standalone single dwellings of a domestic or residential nature (ABCB, Citation2022, p. 2), which comprise over 70% of dwellings in Australia (ABS, Citation2021).
Figure 3. Australian Climate Zones Map (ABCB, Citation2019a). Geopolitical jurisdictions labelled and emphasized. Map provided by the Australian Building Codes Board © 2023 under the CC BY ND licence. Original content hosted https://www.abcb.gov.au/resources/climate-zone-map.
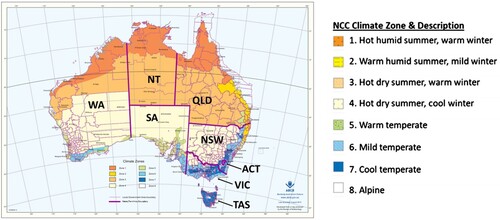
Table 1. Australian NCC climate zones and corresponding Koppen zones.
Housing energy policy in Australia
Analysis of housing energy policy in Australia is well established in the literature (e.g. Berry et al., Citation2022; Enker & Morrison, Citation2017; Moore et al., Citation2019) and will therefore not be replicated here. Instead, a brief overview is provided as a background for the analysis undertaken in this paper.
From the mid-1980s state and territory building energy policy evolved separately, in the absence of a national policy, initially specifying minimum insulation requirements (Berry & Marker, Citation2015). In 2003, the NCC first included building energy efficiency requirements, comprising thermal performance of the building fabric only (Berry & Marker, Citation2015). Adoption of the NCC energy requirements was varied between jurisdictions – outright implementation in VIC, SA and ACT, modified adoption in QLD, NT and WA, and substantial modification in NSW where a broader Building Sustainability Index (BASIX) including water use and appliance energy efficiency was implemented (Moore et al., Citation2019). NCC efficiency targets have slowly increased in stringency over the last two decades, with a perpetuation of varied jurisdictional adoption. However, the literature affirms that current energy efficiency requirements within the Australian residential housing sector fall short of international standards (Moore et al., Citation2019; Warren-Myers & Heywood, Citation2018). Furthermore, assessment of five of Australia’s eight jurisdictions by Moore et al. (Citation2019) determined that 82% of new Australian homes are designed to merely meet these sub-optimal policy minimums.
Nationwide House Energy Rating Scheme (NatHERS)
New homes in Australia require design stage planning approval that demonstrates compliance with the state/territory NCC policy implementation. The NCC provides several pathways to demonstrate building energy compliance, with the Nationwide House Energy Rating Scheme (NatHERS) being the most common methodology (CSIRO, Citation2021). This rating system uses accredited software (i.e. AccuRate, BERS Pro, FirstRate5) to simulate a building’s thermal performance (NatHERS, Citation2021).
NatHERS simulation software requires inputs relating to the location of the house and details of the house design (including conditioned floor area; building materials; glazing sizes, orientation and materials; construction type; and dwelling orientation) (NatHERS, Citation2021). The software assumes occupancy patterns based on the number of bedrooms and applies an area correction factor to nullify the advantage that larger homes have due to their lower surface area to floor area ratio (Chen, Citation2012, Citation2022; Delsante, Citation2005). NatHERS delineates 69 climate zones to accommodate assessments across the diverse climates of Australia, and each rating utilizes a zone-specific reference meteorological year climate file (NatHERS, Citation2021). The software calculates EUI for heating and cooling in MJ/m2/yr and a star rating out of 10 is generated based on the predicted EUI for the designated climate zone. presents the heating and cooling EUI for four climatically diverse locations for each of the star rating bands, illustrating how the same EUI will achieve a different rating when located in different climate zones.
Figure 4. NatHERS Star Bands. Maximum allowable EUI per NatHERS star rating in four locations (Darwin, Canberra, Perth, Sydney East). (Developed by authors based on data from CSIRO [Citation2019]).
![Figure 4. NatHERS Star Bands. Maximum allowable EUI per NatHERS star rating in four locations (Darwin, Canberra, Perth, Sydney East). (Developed by authors based on data from CSIRO [Citation2019]).](/cms/asset/09cb07ae-a5cd-42c3-a8aa-972084f8291e/rbri_a_2301574_f0004_oc.jpg)
The state/territory-based planning regulations define the minimum required NatHERS star ratings for new dwellings, and these have been progressively increased from the initial 3 to 4 stars mandated in 2003. By 2011 most jurisdictions (except NSW) had defined a minimum standard of 6 starFootnote1 rating for individual homes. In NSW, regulators undertook significant reviews of BASIX to align the methodology more closely with the NCC. However, Johnston (Citation2020) suggests BASIX minimums only rose to an equivalence of a NatHERS 5.5 stars in 2017. Despite industry resistance (HIA, Citation2022), the 2022 review of the NCC mandates an increased minimum 7-star NatHERS rating and a more holistic ‘whole of home’ assessment including a dwelling energy budget (Australian Government, Citation2022a). However, while some jurisdictions will implement NCC 2022 comprehensively, adoption is not uniform throughout the nation, resulting in continued jurisdictional disparity of minimum energy efficiency policy requirements ().
Table 2. Summary of NCC 2022 State/Territory Implementation Commitments (ABCB, Citation2023).
Data collation of Australian home energy rating certificates commenced in 2014 (James et al., Citation2017) and the Commonwealth Scientific and Industrial Research Organisation (CSIRO) now provides a national repository of design data of over 750,000 new detached dwellings (CSIRO, Citation2023). Considering jurisdictional policy review timeframes, the period between 2018 and 2022 represents a stable energy efficiency policy period for new housebuilding in Australia, and therefore this current research utilizes data from this period to assess policy outcomes. With the national policy change commencing from 2023, it is a timely opportunity to assess the designed energy performance standards that have been achieved under the policy framework during this period.
Previous research has analysed Australia’s housing design performance data from various perspectives (e.g. Berry et al., Citation2019, Citation2022; Clune et al., Citation2012; James et al., Citation2017; Moore et al., Citation2019). These studies have established benchmark NatHERS ratings for a subset of Australian jurisdictions but have largely excluded analysis of NSW and QLD, which contribute 43% of the nation’s overall new build housing (ABS, Citation2023). This current paper aims to establish a national perspective by incorporating all Australian jurisdictions. Furthermore, this current research broadens knowledge by analysing housing floor area data, a fundamental design parameter affecting space conditioning energy use.
Methodology
This research is focused on NCC Class 1 single detached dwellings and excludes other classes such as apartments. Data only for new builds are included. While some newly built dwellings are on greenfield sites, some will be replacing older dwelling stock. The data analysis period is January 2018 to December 2022.
Data sources
This research utilizes data from the Australian Bureau of Statistics (ABS) for nationally consistent data for new detached dwelling approvals (ABS, Citation2023) and NatHERS certificate data, which provides dwelling EUI, a thermal performance star rating, the dwelling’s jurisdiction, climatic zone and the conditioned floor area (CSIRO, Citation2023). Conditioned floor area refers to the area of the house measured from the inside of the external walls, excluding spaces that are not heated or cooled (DoEE, Citation2019). The NatHERS certificate data are provided to CSIRO after all software parameters have been applied and prior to any application of jurisdictional planning approval variations; the certificate data cannot be deconstructed to assess the impact of model assumptions on the final dwelling EUI.
Both the ABS and NatHERS data relate to the dwelling design stage. However, not all projects proceed to the construction stage, therefore there may be differences between designed and as-built dwelling numbers (James et al., Citation2017). While the NatHERS database is a national repository, in the jurisdictions of NSW, WA and NT the use of NatHERS is not mandatory to obtain planning approval for a new dwelling. However, CSIRO (Citation2022) estimates that nationally over 75% of new residential buildings use the NatHERS pathway. The NatHERS data represents the thermal performance design aspirations of the dwelling. Whilst it is globally well recognized that there can be a significant gap between design and as-built performance (e.g. Gram-Hanssen & Georg, Citation2018), there is a scarcity of data relating to as-built performance for Australian dwellings. Thus the NatHERS dataset represents the most comprehensive national dataset for the design stage thermal performance of Australian dwellings.
Data analysis
To investigate jurisdictional patterns of performance, this research analyses the number of new dwellings, their conditioned floor areas, predicted EUI, NatHERS star rating and overall predicted energy use for dwelling space conditioning. To establish policy minimum outcomes and identify the prevalence of higher performance standards NatHERS rating data have been assessed in 0.5-star band increments (e.g. star band 6 represents 6.0–6.4 stars). Prior to analysing data at the state/territory level, data-subsets with n < 50 were excluded to avoid skewed data associated with small sample sizes.
Using the NatHERS data for EUI and conditioned floor area, the predicted energy use for dwelling space conditioning was calculated by the following straightforward relationship:
Average dwelling energy use was calculated from the individual predicted dwelling energy use on both a jurisdictional and NatHERS star band basis. The total predicted dwelling energy use for the new dwelling sector was also calculated on a national and jurisdictional basis as follows:
Results and discussion
New detached dwelling approvals
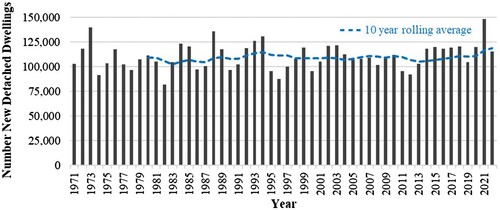
The number of new detached dwelling approvals in Australia has remained relatively consistent over the last 50 years, with a ten-year rolling average range of 101,935/yr to 118,414/yr (). In 2021, the number of new dwelling approvals increased to 148,101, which is 7% more than the previous peak in 1973. Dwelling approvals for 2022 reverted to 114,870 which suggest 2021 is an anomaly. It is postulated that this anomaly can be attributed to a COVID-related government stimulus for the construction industry, the HomeBuilderFootnote2 grant program (HIA, Citation2021). Between 2018 and 2022, an average of 121,348/yr new detached dwellings were approved throughout Australia. The data does not delineate whether the new dwellings are on greenfield sites or replacing existing dwellings, so this figure does not represent a net addition to the number of detached dwellings in Australia.
Figure 5. Number New Detached Dwellings (1971–2022): Australia.
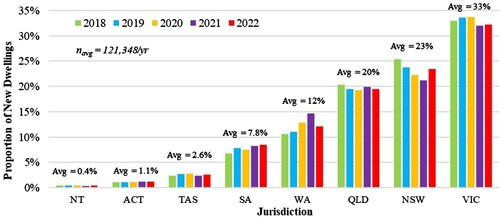
In the study period, 76% of new dwellings were built in the three jurisdictions of VIC, NSW and QLD (). WA contributed a further 12%, while the remaining four jurisdictions combined account for the residual 12%. While there was some movement from year to year, the proportion of new dwellings approved within each jurisdiction during this period was relatively consistent. The dominance of the jurisdictions of VIC, NSW and QLD in terms of the number of new dwellings is important when considering the cumulative effect of dwelling energy efficiency and dwelling energy use in each jurisdiction.
Figure 6. New Detached Dwellings: Jurisdictional Prevalence (2018–2022).
NatHERS star ratings
Overall, 580,956 NatHERS Certificates were registered for Class 1 new homes in Australia during the study period (). With 68% of all certificates rated in the 6–6.9-star range, the NCC minimum standard unambiguously dominates the nation. NatHERS 6–6.4 star was the mode rating band for all jurisdictions except NSW where the mode rating was 5–5.4-star. Nationally, approximately 21% of homes were designed below 6-stars, while 11% were designed at 7-stars or higher. These national results are notably different to the subset of results analysed by Moore et al. (Citation2019) relating to 2016–2018 data for five jurisdictions, which found that just 2% of NatHERS ratings were below 6-stars and 4.8% were above 7-stars. With NSW and QLD contributing 43% of Australia’s new dwellings (), this current research extends the analysis to assess the complete national perspective.
Table 3. Class 1 New Dwellings NatHERS Certificates (2018–2022): Jurisdictional and Ratings Distribution.
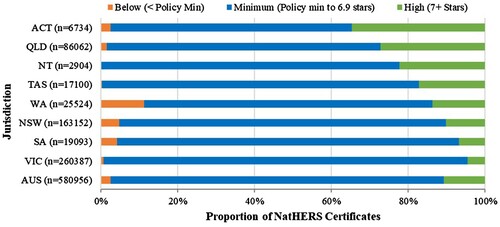
State/territory minimum performance
There are significant differences in the distribution of NatHERS ratings in Australia’s jurisdictions ((a,b)). Consistent with the findings of Moore et al. (Citation2019), the jurisdictions of VIC, SA, TAS, WA and the ACT have a distinct and dominant peak at 6-stars, reflecting a clear minimum outcome of the direct NCC policy implementation in these jurisdictions. However, in NSW, QLD and NT, where jurisdictional policy has modified the NCC, there is a much broader distribution of ratings with 45% of ratings in these jurisdictions below the NCC minimum of 6-stars (n = 113,799). This analysis establishes the state/territory policy outcome minimum NatHERS rating achieved (), which for all jurisdictions except WA represents at least 95% of ratings. Of particular note, industry promulgates an equivalence of minimum 5.5-star NatHERS for the NSW BASIX policy (Johnston, Citation2020). However, with 32% of NSW NatHERS ratings below 5.5-stars during the analysis period (n = 52,004), it is evident that this level does not appropriately define the lower threshold. This current analysis suggests the effective minimum achieved by the NSW BASIX policy is closer to NatHERS 5 stars which is consistent with the findings of Berry et al. (Citation2019).
Figure 7. NatHERS Star Ratings (2018–2022): Jurisdictional Performance. (a) VIC, SA, WA, TAS, ACT (b) NSW, NT, QLD.
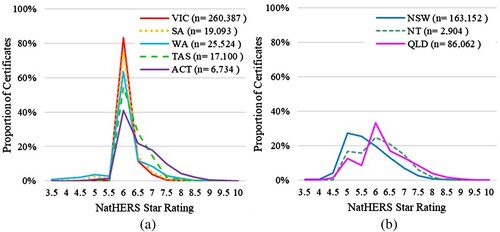
Table 4. Jurisdictional Minimum NatHERS Policy Outcomes (2018–2022).
To delineate jurisdictional differences in design stage thermal performance, ratings were grouped as:
Below (less than jurisdictional policy minimum),
Minimum (jurisdictional policy minimum to 6.9 stars) and
High (7+ stars).
In all jurisdictions the majority of homes were designed to the minimum policy outcome (), with an overall national average of 87%. All jurisdictions except WA had less than 5% of NatHERS ratings below the policy minimum outcome of the jurisdiction, with a national average of 2.5%, indicating that jurisdictional policies are creating effective, though lower, thresholds for minimum thermal performance in each jurisdiction.
Figure 8. Jurisdictional NatHERS Policy Performance (2018–2022).
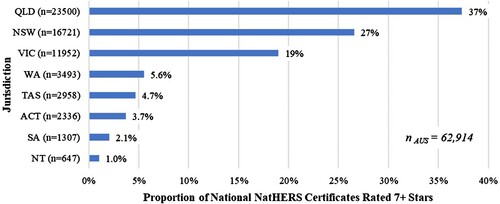
State/territory higher performance
While nationally 11% (n = 62,914) of homes were designed at the higher thermal performance of 7+ stars, there is a significant disparity between the jurisdictions ranging from 5% to 35% (). Due to the wide variance in the number of new dwellings between Australia’s jurisdictions, it is also important to consider these higher performance designs in absolute numbers. Of the nation’s 62,914 new dwellings designed at 7+ stars during the analysis period, QLD contributed the greatest proportion (37%), followed by NSW (27%) (). While less than 5% of new VIC dwellings were designed at 7+ stars, this equates to 11,952 new homes, or 19% of the nation’s new 7+ star homes. Conversely, although 35% of new homes in the ACT were designed to 7+ stars, this contributes only 3.7% of the national total of 7+ star ratings. Analysis by Berry et al. (Citation2022) attributes the mandatory disclosure policy approach as a significant driver in encouraging the design of higher energy performance of homes in the ACT. However, with more than 84% of Australia’s 7+ star ratings being in jurisdictions without mandatory disclosure policies, and the ACT having a more extreme climate by Australian standards, further investigation to understand the drivers for higher performance homes is required.
Figure 9. Higher Thermal Performance Design (2018–2022): Jurisdictional Distribution NatHERS 7+ Stars.
Energy use intensity
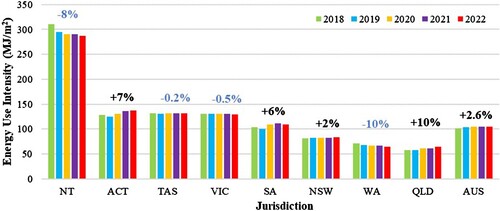
There was an increase of +2.6% in the national average EUI for space conditioning of new dwellings between 2018 and 2022 (), despite a stable space conditioning EUI policy platform during the study period. Half of Australia’s jurisdictions had moderate to significant increases in average EUI, with the greatest in QLD (+10%); a significant reduction in average EUI was demonstrated in WA and NT, and minor reductions were demonstrated in TAS and VIC. Further investigation is required to understand what factors encourage reductions in EUI in some jurisdictions. It is emphasized that due to the range in climates in Australia, seasonal heating and cooling needs are significantly different throughout the nation and it is not appropriate to compare dwelling EUIs between jurisdictions.
Figure 10. New Dwelling Average Energy Use Intensity (2018–2022): Jurisdictional Distribution. Percent change from 2018 to 2022 is indicated for each jurisdiction.
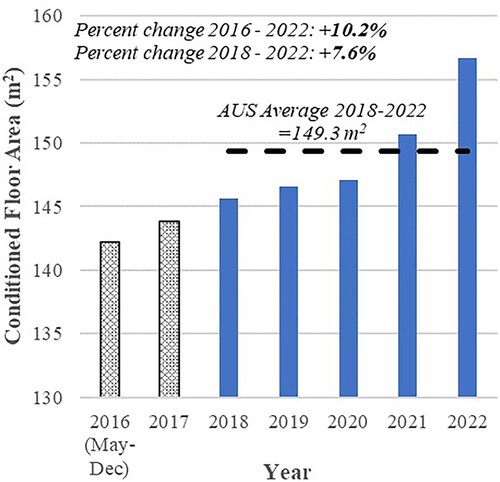
Conditioned floor area
The average conditioned floor area of new detached dwellings in Australia during the study period was 149.3 m2 (). The conditioned floor area of new homes in 2022 was 10% larger than that of new homes in 2016, indicating that the longer-term Australian trend of increasing detached dwelling sizes has steadily continued with more significant increases occurring in 2021–2022. While these conditioned floor areas are not directly comparable to the international data presented by Khajehzadeh and Vale (Citation2017), which includes unconditioned areas, or the Australian total floor area data analysed by Clune et al. (Citation2012), they re-affirm the need for Australian housing energy policy to encompass housing size as well as efficiency.
Figure 11. National Average Conditioned Floor Area (2018–2022). Additional data for 2016 and 2017 included for comparison.
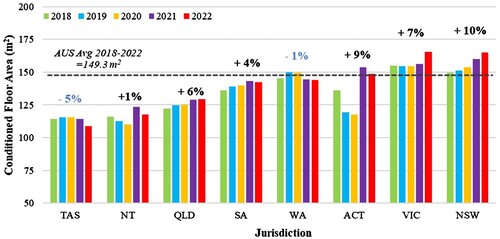
Data analysis by state/territory reveals significant disparities in conditioned floor areas of new detached dwellings (). VIC and NSW have the largest average floor areas and, due to the dwelling numbers in these jurisdictions, dominate the national average. New dwellings in TAS are the smallest in the nation, at just 76% of the national average, and TAS was also the only jurisdiction which achieved a moderate (−5%) reduction in conditioned floor area in the study period. While WA achieved a minor reduction in average conditioned floor area, all other jurisdictions had increases ranging from +1 to +10%. Overall, these trends suggest that current building policy, planning policy and market conditions fail to encourage smaller detached dwelling conditioned floor areas on a national level. Although planning authorities in Australia regulate floor areas of new dwellings via a ratio of the floor space area to the property’s land size, these planning regulations have not been employed for dwelling energy performance or sustainable housing reasons (McKinlay et al., Citation2019). Further investigation is required to understand what factors encourage smaller homes in TAS, NT and QLD.
Figure 12. Average Conditioned Floor Area (2018–2022): By Jurisdiction. Percent change from 2018 to 2022 is indicated for each jurisdiction.
Conditioned floor area by NatHERS star rating
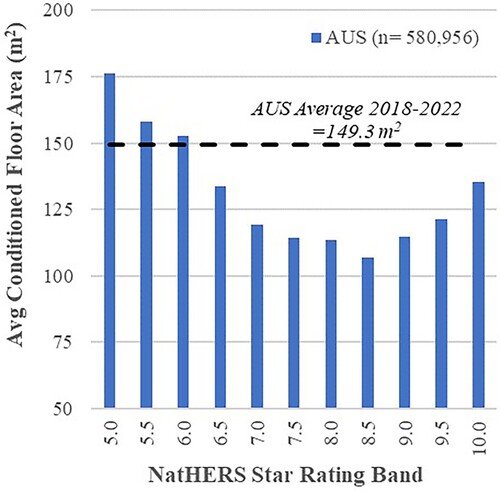
Analysis of data delineated by NatHERS star rating indicates that conditioned floor area decreased as star rating increased (). The area correction factor applied by the rating software will exaggerate this trend, however it is not possible to deconstruct the data to remove the impact of this factor. Six-star homes are slightly larger than the national average and 5-star homes are 18% larger. In contrast, 7-star homes are 20% smaller than the national average. Beyond 7-star the average dwelling conditioned floor area plateaus at approximately 112 m2, 25% smaller than the national average.
Figure 13. National Average Conditioned Floor Area (2018–2022): By NatHERS Star Rating.
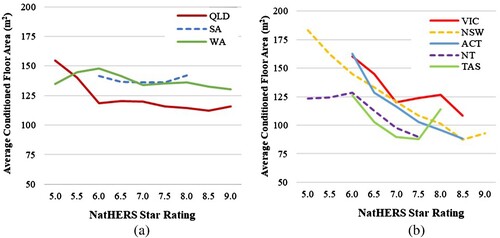
However, when these data are further analysed by jurisdictions, two distinct patterns are evident ((a,b)). For the jurisdictions of QLD, SA and WA, there is relatively little change in conditioned floor area as NatHERS rating increases from 6-star to 8–9 star. In contrast, in VIC, NSW, ACT, NT and TAS the conditioned floor areas markedly decrease as star rating increases. In these jurisdictions the conditioned floor area of 7-star dwellings is 17–29% smaller than that of a 6-star dwelling in the same jurisdiction. In NSW, VIC and ACT the overall pattern of decreasing conditioned floor area continues beyond 7-stars. Further research is required to determine what factors drive the smaller conditioned floor areas in new homes, i.e. whether the higher thermal performance rating drives the reduced floor area or whether the homeowner seeking a higher thermal performance home aspires to a smaller floor area. With the national policy increase to a minimum of 7-stars commencing from 2023, data will soon evidence if there is a broadscale reduction in average floor area, or whether the average floor area of 7-star homes increase.
Figure 14. State/Territory Average Conditioned Floor Area (2018–2022): By NatHERS Star Rating. (a) QLD, SA, WA (b) VIC, NSW, ACT, NT, TAS.
Predicted energy use for thermal comfort
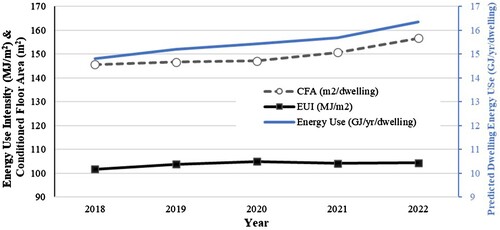
The national average predicted energy use for space conditioning in new dwellings increased by +10.4% from 14.8 GJ/year per dwelling in 2018 to 16.4 GJ/year per dwelling in 2022 (). This increase is a compounded effect of a small increase in the average EUI (+2.6%) with a relatively large increase in the average conditioned floor area (+7.6%). The prominence of the relationship between conditioned floor area and predicted energy use is evident and demonstrates the significant increase in overall predicted space conditioning energy use that has occurred while Australian housing energy policy has remained focussed on EUI.
Figure 15. New Dwelling Predicted Thermal Comfort Energy Use (2018–2022): National Average.
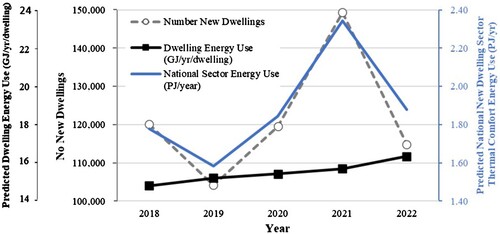
This increase in average dwelling predicted thermal comfort energy use is of even greater concern when combined with the increase in the number of new dwellings, quantifying the expected aggregate thermal comfort energy use of the new dwelling sector (). During the study period, the peak predicted energy use in 2021 was 48% greater than the minimum predicted energy use in 2019. While the peak number of new dwellings in 2021 is an anomaly among longer-term trends, these results demonstrate the substantial increase in national thermal comfort energy use that can occur if all the factors associated with dwelling space conditioning energy use are not encapsulated within national policy frameworks.
Figure 16. Total National New Dwelling Sector Predicted Thermal Comfort Annual Energy Use (2018–2022). Note these figures do not represent a net addition to the overall energy use of the housing sector as some new dwellings will be replacing existing housing stock.
Predicted energy use: jurisdictional results
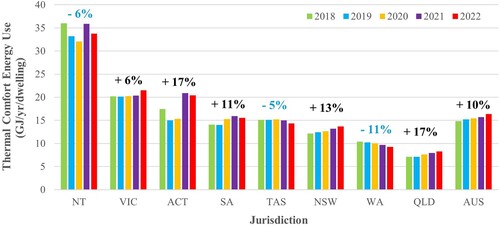
Due to the wide range of climates in Australia, seasonal heating and cooling needs are significantly different throughout the jurisdictions (). While it is not appropriate to compare dwelling energy requirements between the climatically different jurisdictions, it is appropriate to consider temporal changes within each jurisdiction. Between 2018 and 2022 new dwelling thermal comfort predicted energy use reduced in WA by 11% and in TAS and NT reduced by 5–6%. This correlates with the reduction in conditioned floor area achieved in these jurisdictions (). In contrast, all other jurisdictions had increased dwelling thermal comfort predicted energy use, ranging from +6% in VIC to a substantial +17% in ACT and QLD, again correlating with respective increases in conditioned floor areas.
Figure 17. New Dwelling Predicted Thermal Comfort Energy Use: State/Territory Dwelling Average (2018–2022). Percent change from 2018 to 2022 is indicated for each jurisdiction.
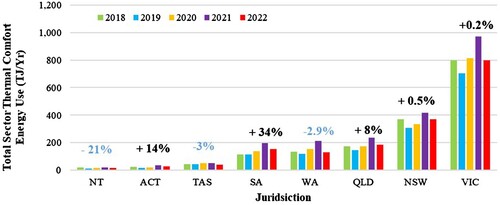
There is a large variance in total thermal comfort predicted energy use required for each jurisdiction (). While NT has the highest thermal comfort predicted energy use per dwelling, due to low numbers of new dwellings, it has the lowest total thermal comfort energy use for the overall jurisdiction. In contrast, NSW and QLD have relatively low thermal comfort dwelling predicted energy use, however the jurisdictional total energy use rank second and third highest due to high new dwelling numbers. VIC has both high new dwelling energy use and high new dwelling numbers, resulting in VIC having the highest overall jurisdictional thermal comfort predicted energy use. Conversely, while ACT has similar new dwelling energy use to VIC, it has far fewer new dwellings per year, so the total predicted energy use for the jurisdiction is relatively small. This analysis illustrates how these factors (i.e. EUI, floor area and new dwelling numbers) result in significant differences in both the scale and temporal changes of overall space conditioning energy use for each jurisdiction.
Figure 18. New Dwelling Predicted Thermal Comfort Energy Use: State/Territory Total (2018–2022). Percent change from 2018 to 2022 is indicated for each jurisdiction.
Predicted energy use: summary
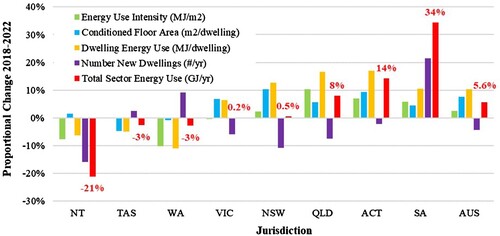
The disparate energy use outcomes of Australia’s states/territories due to the impacts of EUI, floor area, new dwelling numbers and the inconsistent jurisdictional implementation of national energy policy are highlighted in . While nationally the overall predicted energy required by the new dwelling sector increased by +5.6%, this figure ranged from −21% to +34% across the jurisdictions, exemplifying the range of outcomes that may occur due to the numerous factors involved. More than half of Australia’s jurisdictions had predicted increased total energy use. The focus of Australian housing energy policy on the EUI of individual dwellings has thus failed to demonstrate sector-wide reductions in predicted energy use.
Figure 19. New Dwelling Predicted Thermal Comfort Energy Factors (2018–2022): Summary Percent change from 2018 to 2022 is indicated for total sector energy use for each jurisdiction.
These disparate jurisdictional outcomes are pertinent to nations which have multi-state governance and varied jurisdictional implementation of national policy. Furthermore, in such nations, assessment of performance at a jurisdictional level is likely to reveal greater insights than is evidenced by national scale analysis. In turn, a jurisdictionally specific approach to reducing space conditioning energy use for new dwellings could generate more meaningful national outcomes – for example, a focus on ensuring floor sizes are reduced is important in some jurisdictions, while encouraging improved EUI would achieve greater benefits in other jurisdictions.
Conclusions and policy implications
There is an assumption underlying housing energy efficiency policy that improving the thermal performance of the building shell, as measured by a reduction in predicted EUI for space conditioning, will deliver reduced dwelling energy use. Utilizing dwelling building code approval data collated by government agencies, this national scale case study quantifies dwelling energy use to evaluate housing energy efficiency policy in Australia. This research establishes that in the absence of policy focus on the scale of dwellings, either in floor area or number, energy efficiency policy fails to achieve reduced average energy use on a dwelling, jurisdictional or national scale. To the contrary, significant predicted increases are evidenced.
The results of this research are consistent with global building sector energy consumption increases (IEA, Citation2022) and provide insights into the impacts of presently unregulated factors on dwelling energy use. This large-scale case study validates previous smaller-scale research regarding the importance of building size on energy consumption (e.g. Huebner & Shipworth, Citation2017; Viggers et al., Citation2017). With the broad climatic representation, multi-state governance, focus on an internationally prevalent housing typology and utilization of government agency data, this Australian case study offers a transferrable evaluation methodology and insights of energy efficiency-focused policy for new dwellings.
With international trends of both increasing per capita floor area (Ellsworth-Krebs, Citation2020) and increasing dwelling numbers due to population growth (UN-DESA, Citation2022) these factors are pertinent to international dwelling energy use outcomes. Whilst these factors are complex and cross traditional boundaries of building regulation, urban planning and social policies, the current trajectory of space conditioning energy use in new dwellings globally is counter to the acknowledged need to reduce greenhouse gas emissions. A transition by housing energy policy to annualized use-based metrics, even if only at the dwelling level, would enable policy frameworks to deliver overall reductions in energy use. In turn, policy frameworks which prioritize reducing annualized dwelling energy use will support net-zero targets to be achievable.
The reduction of carbon emissions by a nation’s residential building sector is dependent on the collective performance of individual homes. Complementary social policy mechanisms which encapsulate sector-wide energy use are required to address the fundamental multiplier effects of the number of new dwellings. Rather than focusing only on the energy use intensity of individual dwellings, it is imperative for national policy frameworks to target the energy use of both individual dwellings as well as the collective energy use of the new dwelling sector.
Acknowledgements
The authors thank Michael Ambrose and the CSIRO for facilitating access to NatHERS certificate data.
Disclosure statement
No potential conflict of interest was reported by the authors.
Correction Statement
This article was originally published with errors, which have now been corrected in the online version. Please see Correction (http://doi.org/10.1080/09613218.2024.2350740)
Notes
1 Queensland regulations allow a planning approval variation requiring a minimum of NatHERS 4.5-5-stars if outdoor living and photovoltaic energy generation is utilized (Queensland Government, Citation2021). The Northern Territory government adopted a lower minimum thermal performance minimum of 5-stars for new dwellings (NTGOA, Citation2022). While WA has adopted a NatHERS minimum of 6-stars, alternate pathways enable equivalent ratings down to 2-stars to be approved (BDAA, Citation2021).
2 The Australian Government HomeBuilder program provided AUD$15,000 to AUD$25,000 grants to over 110,000 new dwellings in 2020–2021 to encourage economic activity within the residential construction sector (Australian Government, Citation2022c).
References
- ABCB. (2019a). Australia Climate Zone Map. Retrieved March 1, 2022, from https://www.abcb.gov.au/resource/map/climate-zone-map-australia
- ABCB. (2019b). NCC 2019 Volume Two Amendment 1: Part 2.6 Energy Efficiency. Retrieved March 1, 2023, from https://ncc.abcb.gov.au/editions/2019-a1/ncc-2019-volume-two-amendment-1/section-2-performance-provisions/part-26-energy
- ABCB. (2020). National Construction Code, Volume 2, Building Code of Australia 2019, Amendment 1. Retrieved March 1, 2023, from https://ncc.abcb.gov.au/editions/2019-a1/ncc-2019-volume-two-amendment-1
- ABCB. (2022). Understanding the NCC: Building classifications. Retrieved March 1, 2023, from https://www.abcb.gov.au/resource/understanding-ncc/building-classifications
- ABCB. (2023). NCC 2022 state and territory adoption dates. Retrieved September 22, 2023, from https://abcb.gov.au/ncc-2022-state-and-territory-adoption-dates
- ABS. (2017). Snapshot of Australia. Retrieved December 2, 2022, from https://www.abs.gov.au/ausstats/[email protected]/Lookup/2071.0main+features22016
- ABS. (2018). Population projections, Australia. Retrieved December 2, 2022, from https://www.abs.gov.au/statistics/people/population/population-projections-australia/latest-release
- ABS. (2021). Snapshot of Australia: A picture of the economic, social and cultural make-up of Australia on Census Night, 10 August 2021. Retrieved December 2, 2022, from https://www.abs.gov.au/statistics/people/people-and-communities/snapshot-australia/latest-release
- ABS. (2022). Regional population: Statistics about the population for Australia’s capital cities and regions. Retrieved December 2, 2022, from https://www.abs.gov.au/statistics/people/population/regional-population/2021
- ABS. (2023). TABLE 20-29. Number of dwelling units approved in new residential buildings, original – Australia. Retrieved April 1, 2023, from https://www.abs.gov.au/statistics/industry/building-and-construction/building-approvals-australia/latest-release#data-downloads
- Aroonruengsawat, A., Auffhammer, M., & Sanstad, A. H. (2012). The impact of state level building codes on residential electricity consumption. The Energy Journal, 33(1), 31–52.
- Australian Government. (2022a). Building Ministers’ Meeting: Communiqué August 2022. Retrieved August 26, 2022, from https://www.industry.gov.au/news/building-ministers-meeting-communique-august-2022
- Australian Government. (2022b). Energy rating labels. Retrieved July 1, 2022, from https://www.energyrating.gov.au/label
- Australian Government 2022c, HomeBuilder. Retrieved July 19, 2022, from https://treasury.gov.au/coronavirus/homebuilder
- BDAA. (2021). The long road to energy efficiency in Western Australia. Retrieved July 1, 2022, from https://bdaa.com.au/the-long-road-to-energy-efficiency-in-western-australia/
- Beck, H. E., Zimmermann, N. E., McVicar, T. R., Vergopolan, N., Berg, A., & Wood, E. F. (2018). Present and future Köppen-Geiger climate classification maps at 1-km resolution. Scientific Data, 5(1), 180214. https://doi.org/10.1038/sdata.2018.214
- Berry, S., & Marker, T. (2015). Residential energy efficiency standards in Australia: Where to next? Energy Efficiency, 8(5), 963–974. https://doi.org/10.1007/s12053-015-9336-4
- Berry, S., Moore, T., & Ambrose, M. (2019). Flexibility versus certainty: The experience of mandating a building sustainability index to deliver thermally comfortable homes. Energy Policy, 133, 1–8. https://doi.org/10.1016/j.enpol.2019.110926
- Berry, S., Moore, T., & Ambrose, M. (2022). Australia’s experience of combining building energy standards and disclosure regulation. Frontiers in Sustainable Cities, 4. https://doi.org/10.3389/frsc.2022.801460
- Berry, S., Whaley, D., Davidson, K., & Saman, W. (2014). Do the numbers stack up? Lessons from a zero carbon housing estate. Renewable Energy, 67, 80–89. https://doi.org/10.1016/j.renene.2013.11.031
- Callmer, Å, & Bradley, K. (2021). In search of sufficiency politics: The case of Sweden. Sustainability: Science, Practice and Policy, 17(1), 194–208. https://doi.org/10.1080/15487733.2021.1926684
- Chen, C.-f., Xu, X., Adua, L., Briggs, M., & Nelson, H. (2022). Exploring the factors that influence energy use intensity across low-, middle-, and high-income households in the United States. Energy Policy, 168, 113071. https://doi.org/10.1016/j.enpol.2022.113071
- Chen, D. (2012). Area correction factors in AccuRate v1.1.4.1. CSIRO. https://www.hstar.com.au/Chenath/files/AreaAdjustment20121030.pdf
- Chen, D. (2022). Accurate and the Chenath Engine for residential house energy rating. CSIRO. https://www.hstar.com.au/Home/Chenath
- Clune, S., Morrissey, J., & Moore, T. (2012). Size matters: House size and thermal efficiency as policy strategies to reduce net emissions of new developments. Energy Policy, 48, 657–667. https://doi.org/10.1016/j.enpol.2012.05.072
- Cohen, R., & Bordass, B. (2015). Mandating transparency about building energy performance in use. Building Research & Information, 43(4), 534–552. https://doi.org/10.1080/09613218.2015.1017416
- CSIRO. (2019). Star Band Criteria. Retrieved August 1, 2022, from https://www.nathers.gov.au/sites/default/files/2019-10/NatHERS%20Star%20bands.pdf
- CSIRO. (2021). Energy rating. Retrieved May 28, 2021, from https://ahd.csiro.au/dashboards/energy-rating/
- CSIRO. (2022). NatHERS Certificates vs. ABS Building Approvals. Retrieved August 1, 2022, from https://ahd.csiro.au/other-data/certificates-vs-building-approvals/
- CSIRO. (2023). Australian Housing Data. Retrieved June 6, 2023, from https://ahd.csiro.au/dashboards/energy-rating/states
- Daley, J., & Coates, B. (2018). Housing affordability: Reimagining the Australian dream. Grattan Institute.
- Dalton, T., Wakefield, R., & Horne, R. (2011). Australian suburban house building: Industry organisation, practices and constraints. Australian Housing and Urban Research Institute RMIT Research Centre.
- Deason, J., & Hobbs, A. (2011). Codes to cleaner buildings: Effectiveness of US building energy codes. Climate Policy Initiative.
- Delsante, A. (2005). Is the new generation of building energy rating software up to the task? – A review of accurate. In ABCB Conference ‘Building Australia’s Future 2005’, September 11-15, 2005, Gold Coast, Qld. http://hdl.handle.net/102.100.100/181313?index=1
- Dixon, G., Abdel-Salam, T., & Kauffmann, P. (2010). Evaluation of the effectiveness of an energy efficiency program for new home construction in eastern North Carolina. Energy, 35(3), 1491–1496. https://doi.org/10.1016/j.energy.2009.12.006
- DoEE. (2019). NatHERS assessor handbook. Australian Government Department of the Environment and Energy.
- Ellsworth-Krebs, K. (2020). Implications of declining household sizes and expectations of home comfort for domestic energy demand. Nature Energy, 5(1), 20–25. https://doi.org/10.1038/s41560-019-0512-1
- EnergyConsult. (2021). 2021 residential energy baseline study: Australia and New Zealand. https://www.energyrating.gov.au/industry-information/publications/report-2021-residential-baseline-study-australia-and-new-zealand-2000-2040
- Enker, R. A., & Morrison, G. M. (2017). Analysis of the transition effects of building codes and regulations on the emergence of a low carbon residential building sector. Energy and Buildings, 156, 40–50. https://doi.org/10.1016/j.enbuild.2017.09.059
- Evans, M., Roshchanka, V., & Graham, P. (2017). An international survey of building energy codes and their implementation. Journal of Cleaner Production, 158(C), 382–389. https://doi.org/10.1016/j.jclepro.2017.01.007
- Fuchs, D., Sahakian, M., Gumbert, T., Giulio, A. D., Maniates, M., Lorek, S., & Graf, A. (2021). Consumption corridors: Living a good life within sustainable limits (1st ed.). Routledge.
- Gaglia, A. G., Dialynas, E. N., Argiriou, A. A., Kostopoulou, E., Tsiamitros, D., Stimoniaris, D., & Laskos, K. M. (2019). Energy performance of European residential buildings: Energy use, technical and environmental characteristics of the Greek residential sector – Energy conservation and CO₂ reduction. Energy and Buildings, 183, 86–104. https://doi.org/10.1016/j.enbuild.2018.10.042
- González-Torres, M., Pérez-Lombard, L., Coronel, J. F., Maestre, I. R., & Yan, D. (2022). A review on buildings energy information: Trends, end-uses, fuels and drivers. Energy Reports, 8, 626–637. https://doi.org/10.1016/j.egyr.2021.11.280
- Gram-Hanssen, K., & Georg, S. (2018). Energy performance gaps: Promises, people, practices. Building Research & Information, 46(1), 1–9. https://doi.org/10.1080/09613218.2017.1356127
- HIA. (2021). HomeBuilder drives surge in new home building. Retrieved May 3, 2021, from https://hia.com.au/-/media/HIA-Website/Files/Media-Centre/Media-Releases/2021/national/homebuilder-drives-surge-in-new-home-building.ashx
- HIA. (2022). NCC 2022 Stage 2 Public Comment Submission. Retrieved March 1, 2023, from https://hia.com.au/our-industry/-/media/files/newsroom/submissions/2021/hia-ncc-2022-stage-2-public-comment-submission.pdf
- Hjorth, H., Johansson, T., & Svensson, O. (2011). Implementing the Energy Performance of Buildings Directive: Implementation of the EPBD in Sweden. Status in November 2010.
- Huebner, G. M., & Shipworth, D. (2017). All about size? – The potential of downsizing in reducing energy demand. Applied Energy, 186, 226–233. https://doi.org/10.1016/j.apenergy.2016.02.066
- IEA. (2013). Policy pathway – Modernising building energy codes 2013.
- IEA. (2022). Buildings.
- James, M., Ambrose, M., Lane, B., & Wright, A. (2017). The NatHERS dataset: An exploration of its content, provenance, and usefulness in the characterization of new residential building. Energy Procedia, 121, 142–149. https://doi.org/10.1016/j.egypro.2017.08.011
- Johnston, P. (2020). Why NSW’s BASIX tool needs some love. The Fifth Estate. Retrieved November 15, 2021, from https://thefifthestate.com.au/innovation/rating-tools/why-nsws-basix-tool-needs-some-love/#!
- Kellogg, K. A., & Cumbre-Gibbs, N. L. (2023). The impact of state level residential building code stringency on energy consumption in the United States. Energy and Buildings, 278, 112607. https://doi.org/10.1016/j.enbuild.2022.112607
- Kerr, S.-M., Klocker, N., & Gibson, C. (2021). From backyards to balconies: Cultural norms and parents’ experiences of home in higher-density housing. Housing Studies, 36(3), 421–443. https://doi.org/10.1080/02673037.2019.1709625
- Khajehzadeh, I., & Vale, B. (2017). How house size impacts type, combination and size of rooms: A floor plan study of New Zealand houses. Architectural Engineering and Design Management, 13(4), 291–307. https://doi.org/10.1080/17452007.2017.1324401
- Kotchen, M. J. (2017). Longer-run evidence on whether building energy codes reduce residential energy consumption. Journal of the Association of Environmental and Resource Economists, 4(1), 135–153. https://doi.org/10.1086/689703
- McKinlay, A., Baldwin, C., & Stevens, N. J. (2019). Size matters: Dwelling size as a critical factor for sustainable urban development. Urban Policy and Research, 37(2), 135–150. https://doi.org/10.1080/08111146.2017.1374944
- McMullan, M., & Fuller, R. (2015). Spatial growth in Australian homes (1960-2010). Australian Planner, 52(4), 314–325. https://doi.org/10.1080/07293682.2015.1101005
- Moore, T., Berry, S., & Ambrose, M. (2019). Aiming for mediocrity: The case of Australian housing thermal performance. Energy Policy, 132, 602–610. https://doi.org/10.1016/j.enpol.2019.06.017
- NatHERS. (2021). How NatHERS star ratings are calculated. CSIRO. Retrieved December 1, 2021, from https://www.nathers.gov.au/owners-and-builders/how-nathers-star-ratings-are-calculated
- Ness, D. (2020). Growth in floor area: The blind spot in cutting carbon [version 3; peer review: 3 approved]. Emerald Open Research, 2, 2. https://doi.org/10.35241/emeraldopenres.13420.3
- NTGOA. (2022). Residential building and energy efficiency, viewed 1/7/2022, <https://nt.gov.au/property/building/build-or-renovate-your-home/building-and-energy-efficiency>
- OECD. (2018). Subnational governments in OECD countries: Key data.
- Queensland Government. (2021). 6-star energy standard for houses and townhouses. Retrieved July 1, 2022, from https://www.business.qld.gov.au/industries/building-property-development/building-construction/laws-codes-standards/sustainable-housing/energy-equivalence/6-star
- Raha, D. (2007). Paradigm shift in water environment protection in New South Wales. Australian Journal of Water Resources, 11(1), 67–78.
- Royston, S., Selby, J., & Shove, E. (2018). Invisible energy policies: A new agenda for energy demand reduction. Energy Policy, 123, 127–135. https://doi.org/10.1016/j.enpol.2018.08.052
- Schettler-Köhler, H., & Ahlke, I. (2016). Implementing the Energy Directive. EPBD implementation in Germany. Status in December 2016.
- Shove, E. (2018). What is wrong with energy efficiency? Building Research & Information, 46(7), 779–789. https://doi.org/10.1080/09613218.2017.1361746
- Speck, M., & Hasselkuss, M. (2015). Sufficiency in social practice: Searching potentials for sufficient behavior in a consumerist culture. Sustainability: Science, Practice and Policy, 11(2), 14–32. https://doi.org/10.1080/15487733.2015.11908143
- Statistics Canada. (2023). Structural type of dwelling and household size: Canada, provinces and territories, census divisions and census subdivisions. Retrieved August 25, 2023, from https://www150.statcan.gc.ca/t1/tbl1/en/tv.action?pid=9810004101
- Thomson, K. E., Wittchen, K. B., Ostertag, B., Severinsen, R., Palm, J., Hartung, T., & Varming, N. (2018). Implementing the energy performance of buildings directive. EPBD implementation in Denmark. Status in December 2016.
- UN-DESA. (2022). World population prospects 2022: Summary of results. United Nations Department of Economic and Social Affairs, Population Division. https://www.un.org/development/desa/pd/content/World-Population-Prospects-2022
- USCB. (2023). DP04 Selected Housing Characteristics. Retrieved August 24, 2023, from https://data.census.gov/table?tid=ACSDP1Y2022.DP04
- Viggers, H., Keall, M., Wickens, K., & Howden-Chapman, P. (2017). Increased house size can cancel out the effect of improved insulation on overall heating energy requirements. Energy Policy, 107, 248–257. https://doi.org/10.1016/j.enpol.2017.04.045
- Warren-Myers, G., & Heywood, C. (2018). A new demand-supply model to enable sustainability in new Australian housing. Sustainability, 10(2), 1–18. https://doi.org/10.3390/su10020376
- Welch, D., & Southerton, D. (2019). After Paris: Transitions for sustainable consumption. Sustainability: Science, Practice and Policy, 15(1), 31–44. https://doi.org/10.1080/15487733.2018.1560861