
Abstract
The concept of glycaemic index (GI) has led to efforts to develop low-GI foods. Bread contributes around one-quarter of carbohydrate intake in the Swedish diet. In this study, we sought to develop low-GI bread prototypes and examined the effects of bread making on content of total dietary fibre (TDF) and resistant starch (RS). Five bread prototypes were made in a commercial bakery, using sourdough fermentation and intact cereal and legume kernels. Predicted (p-GI) and in vivo GI values were determined, and TDF and RS were quantified. The p-GI value of the five prototypes was between 56 and 68. The confirmed in vivo GI value was 65 and 67 for two of the breads. The TDF content (≥17%) was not affected by bread making, but RS content was increased by three-fold. All breads were categorised as medium-GI, but with low glycaemic load (GL).
Introduction
The amount and type of carbohydrates ingested are among the major dietary factors controlling postprandial blood glucose response (Sheard et al. Citation2004). Epidemiological studies have shown that consumption of fibre-rich food is independently associated with a reduced risk of type-2 diabetes (T2D) (reviewed by Salas-Salvado et al. Citation2011). In contrast, intake of refined cereals or simple sugars (mono- and disaccharides) has been found to induce postprandial hyperglycaemia and may increase inflammatory responses, thus increasing the risk of T2D (Bulló et al. Citation2007).
As there are substantial differences in physiological responses to different types of carbohydrate, the glycaemic index (GI) concept was launched in 1981 (Jenkins et al. Citation1981). The GI value indicates the glucose-elevating effect of a food in comparison with a standard (usually glucose solution or white wheat bread). The glycaemic load (GL) is defined as the GI value multiplied by the carbohydrate content per serving. A meta-analysis of observational studies has shown that low-GI and low-GL diets are independently associated with a reduced risk of T2D (Barclay et al. Citation2008). This has changed consumers’ preferences towards products that claim to be low-GI.
Bread is the main carbohydrate source in the Swedish traditional diet, providing 19% and 28% of total carbohydrate and dietary fibre intake, respectively (NFA Citation2012). Bread is generally classified as a medium- to high-GI food (Atkinson et al. Citation2008). However, recent advances in bread baking technology are reported to allow bread with low-GI value to be produced using kernels from different cereal species, sourdough fermpentation using specific starter cultures, and/or addition of organic acids, fibre and bean extract (Bjorck and Elmstahl Citation2003; De Angelis et al. Citation2007; Marangoni and Poli Citation2008; De Angelis et al. Citation2009; Udani et al. Citation2009; Novotni et al. Citation2011). The high contents of resistant starch (RS) and total dietary fibre (TDF), both fractions of indigestible carbohydrate, in legume foods make these interesting candidates for development of low-GI products (Fujiwara et al. Citation2017). Both RS and TDF are reported to be affected by food processing, e.g. soaking, hydrothermal treatment, roasting, and frying (Dhingra et al. Citation2012).
During product development, in vitro determination of GI value has advantages (with respect to time and costs) over in vivo trials (Monro and Mishra Citation2010). An established in vitro methodology is determination of the starch digestion rate (giving predicted glycaemic index, p-GI) (Englyst et al. Citation1996; Goñi et al. Citation1997; van Kempen et al. Citation2010). In the methodology, human digestion is simulated using intestinal enzymes to obtain a p-GI value by quantifying digestible carbohydrates that would increase postprandial blood glucose levels. However, no standard procedure for determining the p-GI value has been established. A confounder can be the physical form of the food sample tested, which can be in freeze-dried form or fresh (as-eaten) (Araya et al. Citation2002; Fujiwara et al. Citation2017). The choice of reference dose (glucose solution or white bread) is another source of discrepancy, which can be accounted for by using a factor of 0.7 (Foster-Powell et al. Citation2002).
Data regarding the correlation between in vivo and in vitro data are inconsistent. Some studies report a good correlation (Araya et al. Citation2002), whereas others report inconsistent results (Urooj and Puttaraj Citation2000). Discrepancy can partly be explained by use of different references. Ferrer-Mairal et al. (Citation2012) determined p-GI values using white bread as reference and directly compared these with in vivo GI values based on glucose solution; this resulted in overestimation of p-GI values. However, it is recommended that in vitro data are confirmed by in vivo trials, for accurate branding information (Brand-Miller and Holt Citation2004).
The main aim of the present study was to develop a prototype of a low-GI bread, using intact cereal and legume kernels and sourdough fermentation. Secondary aims were to (a) study the effect of bread making on RS and TDF content, and (b) evaluate the effect of physical form of the food samples tested (fresh or freeze-dried) on p-GI values.
Material and methods
Bread baking and sampling
Five bread prototypes (named A, B, C, M, and W) were prepared using different ingredients. These comprised sourdough base, whole kernels (cooked and germinated grey peas, cooked white beans, germinated mung beans, soaked barley kernels), whole-meal rye flour, and sifted spelt flour, with the overall aim of producing bread with low-GI and good baking performance and appearance (). Bread making was carried out at a commercial bakery (Öländska Bröd AB, Borgholm, Sweden) as follows: Sourdough base was prepared from whole rye flour and fermented for 18–20 h at room temperature (20 ± 2 °C). After mixing of ingredients (), the dough was leavened for 2–3 h at 24–27 °C, portioned, shaped, and proofed for 3 h at 27–30 °C before baking (180 °C, aiming for internal bread temperature of 96–98 °C, for 90 min). The bread was cooled to room temperature before further analysis.
Table 1. Ingredients in bread prototypes A, B, C, W, and M.
The bread was sliced and the first and the last slice were discarded. The remaining slices were portioned, vacuum-packed in polyethylene bags, and stored at −20 °C. Dough samples and samples of all breads were also freeze-dried, milled (Cyclotec 1093 sample mill, Foss Tecator, Höganäs, Sweden), vacuum-packed in polyethylene bags, and stored at −20 °C.
The effect of the bread making procedure on the content of RS, non-RS and TDF was determined using freeze-dried samples of the three prototypes A, B, and C (200 g) collected from the dough after leavening and after proofing, and from the bread after cooling. The effect of storage on RS, non-RS, and TDF content was studied after storage for 6 days at ambient room temperature (20 °C) in a cupboard, according to household practice corresponding to shelf-life.
The p-GI value was determined for all five bread prototypes, on both the frozen sliced samples and freeze-dried material. The in vitro data from two of the bread prototypes (white bean bread “W” and mung bean bread “M”) were confirmed by an in vivo GI trial.
Quantification of total dietary fibre and, resistant and non-resistant starch
Total dietary fibre was determined in duplicate freeze-dried samples of all bread prototypes and ingredients according to the official method (AOAC 991.43), using a commercial kit (Megazyme International, Bray, Co., Wicklow, Ireland). In brief, 1 g sample was suspended in 40 mL MES-TRIS buffer (50 mM, pH 8.2). Thereafter, 50 µL heat-stable α-amylase (3000 ceralpha units/mL) were added and the samples were incubated in a water bath (98–100 °C, for 30 min). After cooling, 100 µL protease (350 tyrosine units/mL) solution were added to each sample and incubated (60 °C, for 30 min). To hydrolyse starch fragments to glucose, the pH was adjusted to pH 4.1–4.8. Then 200 µL amyloglucosidase (AMG; 3300 units/mL) were added and the samples were incubated (60 °C, for 30 min). To each sample, four volumes of ethanol were added to precipitate fibre and remove depolymerised protein and glucose. The residue was filtered, washed consecutively with 78% ethanol, 95% ethanol, and acetone, dried, and weighed. Samples were analysed for protein (using the Kjeldahl method) and ash (by ashing at 525 °C).
Resistant and non-resistant starch were determined for duplicate freeze-dried samples of all bread prototypes and ingredients, according to the official method AACC 32-40.01/AOAC 2002.02, using a commercial kit (Megazyme International, Bray, Co., Wicklow, Ireland). In brief, 100 mg of sample were incubated overnight in a water bath (16 h, 37 °C) in 4 mL sodium malate buffer (100 mM, pH 6.0) containing pancreatic α-amylase (10 mg/mL) and AMG (3 U/mL), to hydrolyse non-RS. The reaction was stopped by adding 4 mL ethanol (99% v/v). Resistant starch was then recovered as a pellet by centrifugation (1500 g, 10 min) and the pellet was washed using ethanol (2 times × 8 mL). Supernatants from duplicate samples was collected and combined for quantification of non-RS. The pellets containing RS were dissolved in 2 M KOH using an ice/water bath and vigorous stirring for 20 min. Dissolved RS was quantitatively hydrolysed to D-glucose by addition of 0.1 mL of AMG (3300 units/mL) in 8 mL sodium acetate buffer (1.2 M, pH 3.8). Hydrolysed pellets and supernatants were incubated (50 °C, for 30 min) and the D-glucose liberated was determined spectrophotometrically after addition of glucose oxidase-peroxidase reagent.
Determination of predicted glycaemic index (p-GI)
Prior to determination, the pancreatin enzyme mixture had to be prepared on the day as follows: 3 g of pancreatin (P-7545; Sigma-Aldrich, St. Louis, MO) were dispersed in 20 mL deionised water using a magnetic stirrer for 10 min. The mixture was transferred to a 50 mL conical tube, centrifuged (1500 g for 10 min), and 15 mL of supernatant were transferred to a small beaker, together with 150 µL AMG (E-AMGDF; Megazyme International, Bray, Co., Wicklow, Ireland) and 9 mg of invertase (I4504; Sigma-Aldrich, St. Louis, MO).
The p-GI values were determined in duplicate on both frozen fresh slices and freeze-dried bread samples of all prototypes, according to the method described by Englyst et al. (Citation1996) and modified by van Kempen et al. (Citation2010). For the frozen fresh bread, a composite sample from four slices was prepared after cutting and mincing in a mortar (30 s) with addition of a little deionised water (1:1). In brief, 0.25 g freeze-dried ground sample or 0.75 g minced frozen fresh sample was incubated for 30 min in 2.5 mL pepsin suspension, containing 0.5% pepsin (P-7000; Sigma-Aldrich, St. Louis, MO) and 0.5% guar gum in 0.05 mol/L HCl, to mimic gastric digestion. To mimic small intestine digestion, 2.5 mL of 0.25 mol/L sodium acetate solution and 1.25 mL of pancreatin enzyme mixture were added to the digestion solution, and it was further incubated for up to 480 min. Incubation was carried out at 39 °C under horizontal agitation with addition of glass beads (n = 5) to enhance the efficacy of agitation. At each sampling point (0, 15, 30, 60, 90, 120, 180, 240, 360, and 480 min), an aliquot of 0.1 mL was taken and 5 mL absolute ethanol were added to it, to interrupt starch digestion. Glucose content was determined in each sample using a glucose oxidase kit (Megazyme International, Bray, Co., Wicklow, Ireland). Hydrolysis index (HI) was calculated using the trapezoidal method from the area under the glucose concentration curve (AUC) over time. The p-GI value was then calculated using the equation: P-GIB = 0.549 × HI + 39.71 (Goñi et al. Citation1997) with white wheat bread as reference (purchased at the local supermarket, prepared by freeze-drying or mincing, as done for bread prototype samples).
To calculate p-GIG, with glucose solution as reference, the p-GIB values obtained were multiplied by 0.7 (Foster-Powell et al. Citation2002).
Determination of in vivo glycaemic index
Characterisation of the prototype breads
The proximate composition of bread prototypes M and W (mung bean, white bean) was determined according to AOAC methods. The moisture content was based on the weight loss after heating the sample in an oven at 105 °C; the ash content was based on weight after incineration in a muffle furnace at 550 °C; crude protein content was determined by total nitrogen content via micro-Kjeldahl, using the conversion factor %N × 5.7; and the lipid content was determined by Soxhlet extraction. Content of TDF and RS were determined using the commercial assay kit as described previously. Available carbohydrate content in the prototype breads was calculated by difference according to the equation: Available carbohydrates (g/100 g fresh weight) = [100 − (Moisture + Ash + Protein + Fat + RS + TDF)].
Subjects and study design
Twelve apparently healthy subjects free of symptomatic disease (seven women and five men), aged 29–62 years, were recruited in May 2018 from the staff population at Linnaeus University, Kalmar, Sweden, and the surrounding community. Subjects were deemed eligible for inclusion when the following criteria were met: no history of acute and chronic disease (e.g. diabetes), no pregnancy, planned conception, or lactation, not consuming a special diet (e.g. for weight loss), no use of long-term prescribed medication, and body mass index (BMI) 18–30 kg/m2. The study was approved by the Regional Ethics Review Board in Linköping, Sweden. A signed informed consent form was obtained from all subjects after informing them about the study.
The GI values were determined for two bread prototypes, M and W, using the IAUC of postprandial blood glucose concentrations, according to standard procedures (Brouns et al. Citation2005; FAO Citation1998). Subjects participated on five separate occasions (one for each bread prototype and three for reference glucose solution supplying 50 g of anhydrous glucose) after overnight fasting (12–14 h). The bread test meals were provided in amounts (∼145 g) corresponding to 50 g available carbohydrates and were served with water (∼ 250 mL). Subjects received the reference glucose solution on the first and last day, while on the other three days they received, in random order, 50 g available carbohydrate from one of the bread prototype or glucose solution in a standardised procedure within 13 min. Finger-prick capillary blood samples were taken before the meal (time 0) and at 15, 30, 45, 60, 90, and 120 min after the meal. Blood glucose concentration was determined using a HemoCue glucose analyser (Glucose 201, Ängelholm, Sweden). The incremental area under the curve (IAUC) was calculated using the trapezoidal method, ignoring any area in the glucose curve below the fasting concentration.
Statistical analysis
Data were expressed as mean ± standard deviation (STD) from duplicate analysis. Normal distribution and homogeneity of variance of all variables were tested using the Anderson-Darling test (Minitab statistical software, version 17, SAS Inc., Cary, NC). In vitro and in vivo IAUC were analysed by one-factor analysis of variance for repeated measures (RM-ANOVA) with post-hoc Tukey comparison, considering type of bread as independent factor, using GraphPad Prism 7.0 software (GraphPad Software, La Jolla, CA). Level of significance was set to p < 0.05. Individual GI values deviating by more than two STDs from the mean of all subjects were excluded, as were all data for subjects with IAUCs for the repeated reference glucose tests with coefficient of variation (CV) >30% (Wolever et al. Citation2008). General linear model with Tukey’s pairwise comparison was used to analyse differences in TDF and RS content between raw materials and differences in TDF and RS content after treatment (baking and storage) using Minitab statistical software, version 17 (GraphPad Software, La Jolla, CA).
Results
Total non-resistant and resistant starch and total dietary fibre content in ingredients, and effects of bread making
The content of total starch varied (p < 0.001) depending on type of ingredients and method of preparation (). The highest content of total starch (75 g/100 g, DWB) was found in sieved spelt flour, followed by wholegrain rye and barley flour (70 g/100 g, DWB). In other ingredients, the total starch content ranged between 42% and 62% (). The RS content of different ingredients varied (p < 0.001) from 0.3 g/100 g, DWB for sourdough base to 5.7 g/100 g, DWB for rye (). The relative content of RS to total starch also varied (p < 0.001) between different ingredients, from 0.5% in sourdough base to 11% in white beans (). Total dietary fibre content was particularly low in the spelt flour (<10%, compared with 18-23% for the other ingredients) ().
Table 2. Fibre and starch content in bread ingredients*.
In prototypes A, B, and C, the bread making procedure decreased the content of both total starch and non-resistant starch by up to 20% (p < 0.001), whereas the content of RS increased up to three-fold (p < 0.001). The content of TDF was not affected (). The two fermentation steps did not affect the content of either RS or TDF in the fermented dough and proofed loaves (). However, these steps decreased the content of total starch by up to 20% in the bread prototypes A and C, compared with dough after mixing (). This was mainly due to a decrease in the content of non-RS (). The baking step increased the RS content by up to three-fold (p < 0.001), while TDF was not affected (p = 0.117). The high content of TDF in the bread prototypes (9% fresh weight) met, with good margin, the level of 6 g/100 g nutrient required to claim that a product is “High in fibre” (European Commission Citation2019).
Table 3. Content of total dietary fibre, resistant starch, and non-resistant starch (g/100 g, dry weight basis) during bread making.
Short-term storage (6 days at ambient temperature) did not affect the content of either TDF or RS (p = 0.40), confirming findings by others (Amaral et al. Citation2016).
In vitro and in vivo assessment of glycaemic index
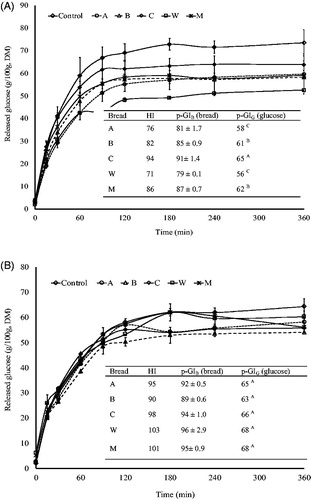
The p-GIG value of all five bread prototypes was within the range 56–68 (), regardless of whether the analysis was carried out using fresh-frozen or freeze-dried bread samples. The p-GI values for freeze-dried samples were up to 17% higher (p = 0.003) than those of fresh-frozen (). All bread prototypes were categorised as medium-GI bread (GI = 55–70).
Figure 1. Amount of glucose released (mg/100g bread dry matter ± standard deviation) during in vitro assessment of glycaemic index (GI). Values are means from duplicate trials and duplicate analyses (n = 4), except for breads M and W (n = 2; duplicate analysis of a single trial). Samples were either frozen fresh bread (panel A) or freeze-dried bread (panel B). The predicted glycaemic index of bread samples (p-GIB) was calculated using the equation: p-GIB = 0.549 × hydrolysis index (HI) + 39.71 (Goñi, Garcia-Alonso, and Saura-Calixto Citation1997), with white wheat bread as reference. To calculate the corresponding values with glucose solution as reference (p-GIG), the p-GIB values were multiplied by 0.7 (Foster-Powell, Holt, and Brand-Miller Citation2002). A, B, C, M, and W represent the different bread prototypes. Different superscripts within a bread prototype (within panels A and B) represent significant differences (p < 0.05).
The gross chemical composition of bread prototypes M and W, which were tested for in vivo GI, was similar (), as was the portion size providing 50 g available carbohydrates. All test portions supplied subjects with 0.6–0.8 g available carbohydrate per kg body weight, except for one subject receiving 0.5 g/kg body weight.
Table 4. Composition of the intervention bread prototypes.
All 12 subjects completed the study. For one subject, the IAUCs from the three occasions receiving glucose solution varied widely (CV = 57%), and therefore all data for this subject were excluded. For another subject, the GI value for mung bean (M) bread deviated by more than two STDs from the mean inter-individual GI value, and was, therefore, excluded.
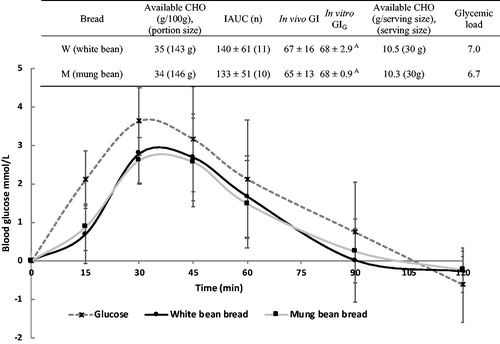
Postprandial blood glucose concentrations peaked at around 30 min and decreased until 120 min after ingestion of bread prototypes and of glucose solution (). Mean IAUC of the two bread samples analysed (M, W) was of similar magnitude (p = 0.8), but significantly smaller than the IAUC of the glucose reference (IAUCG = 207 ± 61). Both bread prototypes were categorised as medium-GI bread (GI = 55–70). However, assuming a serving size of 30 g, the breads provided a low glycaemic load (GL <10) ().
Figure 2. Postprandial blood glucose concentration (mmol/L) in healthy subjects after ingestion of glucose solution (reference; n = 3 × 11), white bean bread (n = 11), and mung bean bread (n = 10). Values are mean, with standard deviation depicted by vertical bars. Mean incremental area under the curve (IAUC) was similar for all bread prototypes (p = 0.8). Mean IAUC for bread prototypes differed significantly (p < 0.001) from mean IAUC for the glucose reference. CHO: carbohydrates; GI: glycaemic index; p-GI = predicted glycaemic index.
Discussion
The aim of the present study was to develop a bread with low GI value, using intact cereal and legume kernels in sourdough fermentation. Both bread prototypes tested for in vivo GI were categorised as medium-GI bread, but they had a low GL value (6.8). These findings are in agreement with reported data on medium-GI breads (GI = 61–62) from whole-meal wheat or rye flour baked with up to 40% sourdough (Gonzalez-Anton et al. Citation2015; Goletzke et al. Citation2016). However, others have shown that sourdough bread after enrichment with dietary fibre has lower GI values (<55) (De Angelis et al. Citation2007; De Angelis et al. Citation2009). Furthermore, Novotni et al. (Citation2011) found that, depending on the starter used during the sourdough fermentation, breads could have low (50) or medium (60) GI values.
Besides sourdough fermentation and fibre content, several other factors have been reported to affect the GI value of a food, e.g. the type and content of starch, the content of fat and protein, and the processing method (Marsh et al. Citation2011; Salas-Salvado et al. Citation2011). The physiological mechanisms by which these factors affect postprandial glucose response are not fully understood. Suggested explanations are that either starch bioavailability is decreased by interactions between gluten and starch (Östman et al. Citation2002) or that organic acids, produced by the sourdough microflora, delay gastric emptying (Liljeberg and Bjorck Citation1998). Total dietary fibre has also been suggested to affect postprandial blood glucose, by lowering the rate of carbohydrate digestion and subsequent absorption (Weickert and Pfeiffer Citation2008).
There is a general concern regarding the reliability of GI values, in particular due to high intra- and inter-subject variability (Brouns et al. Citation2005; Wolever et al. Citation2008). In this study, recommended standard procedures were used with regard to blood sampling procedure, glucose reference dose (FAO Citation1998; Brouns et al. Citation2005; Wolever et al. Citation2008) and exclusion of outliers and data sets with high within-individual variability (Wolever et al. Citation2008). Compliance with overnight fasting, avoidance of exercise prior to the test day, and adherence to the standardised trial procedure were monitored, to reduce confounding effects.
The finding that in vitro data predicted the in vivo GI values for the bread prototypes tested in this study is consistent with findings in many previous studies (reviewed by Woolnough et al. Citation2008), but not with all (Ferrer-Mairal et al. Citation2012). The lack of correlation between in vitro and in vivo data observed in the later study could be explained by the use of a different method to determine p-GI. In vitro methods measure the digestibility of carbohydrates mimicking the oral, gastric, and intestinal phases of human digestion (Fernandez-Garcia et al. Citation2009), but not all studies include the oral phase. Other differences include the duration of each digestion phase, the concentration and type of enzymes used, and/or the physical form of the food sample (milled after freeze-drying or minced in fresh form). Therefore data from in vitro trials should be considered as indicative, since there is no universal standardised method (Woolnough et al. Citation2008). For example, in the present study, the p-GI values determined for freeze-dried bread prototypes were up to 17% higher (p = 0.003) than those obtained for frozen fresh bread prototypes, which complied better with in vivo GI values. A possible explanation is that freeze-drying and subsequent milling reduce the particle size, which makes the cell contents more accessible to digestion and increases the surface-to volume ratio. Therefore, freeze-drying and grinding of food samples result in more representative samples, and can be recommended in in vitro analysis of GI.
Literature data regarding the effect of sourdough fermentation on RS content are inconsistent, with studies reporting either no RS formation (Liljeberg et al. Citation1995; Amaral et al. Citation2016) or an increase in RS content in the bread (De Angelis et al. Citation2007). Our data do not confirm that the fermentation step increases RS formation, but show that the baking step does, as seen in an approximately three-fold increase in RS from proofed loaf to bread. This could be explained by the presence of acids promoting starch retrogradation after heat application in the baking step. This hypothesis is supported by reports that addition of organic acids during mixing of dough increases the RS content of the bread compared with bread without organic acids (Liljeberg et al. Citation1996; Hallstrom et al. Citation2011).
Our study has some limitations. We lack information regarding composition of the starter culture. We did not determine the content and composition of organic acids in doughs and breads. Furthermore, due to budget constraints, we could only determine the in vivo GI value for two bread prototypes (M and W).
Conclusions
This study showed that using intact cereal and legume kernels during sourdough fermentation resulted in bread prototypes with medium GI values. However, the breads obtained in this study can be classified as low-GL foods. The high content of TDF in the bread prototypes (9%) was not affected by bread making and met, with good margin, the level of 6 g/100 g nutrient required to claim that a product is “High in fibre”. The RS fraction in the bread prototypes was increased three-fold by bread making. The results suggest that in vitro GI values for bread can predict in vivo values, and that the use of freeze-dried material for in vitro tests increases the agreement between the values.
Acknowledgements
The authors are most grateful to all subjects for their participation in the study. The authors would like to thank Öländska Bröd AB, Borgholm, for producing the bread and Manfred Enoksson AB, Järna, for making the bread.
Disclosure statement
The authors declare no conflict of interest.
Additional information
Funding
References
- Amaral O, Guerreiro CS, Gomes A, Cravo M. 2016. Resistant starch production in wheat bread: effect of ingredients, baking conditions and storage. Eur Food Res Technol. 242(10):1747–1753.
- Araya H, Contreras P, Alviña M, Vera G, Pak N. 2002. A comparison between an in vitro method to determine carbohydrate digestion rate and the glycemic response in young men. Eur J Clin Nutr. 56(8):735–739.
- Atkinson FS, Foster-Powell K, Brand-Miller JC. 2008. International Tables of Glycemic Index and Glycemic Load Values: 2008. Diabetes Care. 31(12):2281–2283.
- Barclay AW, Petocz P, McMillan-Price J, Flood VM, Prvan T, Mitchell P, Brand-Miller JC. 2008. Glycemic index, glycemic load, and chronic disease risk – a meta-analysis of observational studies . Am J Clin Nutr. 87(3):627–637.
- Bjorck I, Elmstahl HL. 2003. The glycaemic index: importance of dietary fibre and other food properties. Proc Nutr Soc. 62:201–206.
- Brand-Miller J, Holt S. 2004. Testing the glycaemic index of foods: in vivo, not in vitro. Eur J Clin Nutr. 58(4):700–701.
- Brouns F, Bjorck I, Frayn KN, Gibbs AL, Lang V, Slama G, Wolever TM. 2005. Glycaemic index methodology. Nutr Res Rev. 18(1):145–171.
- Bulló M, Casas-Agustench P, Amigó-Correig P, Aranceta J, Salas-Salvadó J. 2007. Inflammation, obesity and comorbidities: the role of diet. Public Health Nutr. 10(10A):1164–1172.
- De Angelis M, Damiano N, Rizzello CG, Cassone A, Di Cagno R, Gobbetti M. 2009. Sourdough fermentation as a tool for the manufacture of low-glycemic index white wheat bread enriched in dietary fibre. Eur Food Res Technol. 229(4):593–601.
- De Angelis M, Rizzello CG, Alfonsi G, Arnault P, Cappelle S, Di Cagno R, Gobbetti M. 2007. Use of sourdough lactobacilli and oat fibre to decrease the glycaemic index of white wheat bread. Br J Nutr. 98(6):1196–1205.
- Dhingra D, Michael M, Rajput H, Patil RT. 2012. Dietary fibre in foods: a review. J Food Sci Technol. 49(3):255–266.
- Englyst HN, Veenstra J, Hudson GJ. 1996. Measurement of rapidly available glucose (RAG) in plant foods: a potential in vitro predictor of the glycaemic response. Br J Nutr. 75(3):327–337.
- European Commission. 2019. Nutrition claims. [accessed 2019 Dec 12]. https://ec.europa.eu/food/safety/labelling_nutrition/claims/nutrition_claims_en
- FAO. 1998. Food and Agriculture Organization of the United Nations. FAO Food and Nutrition Paper 66. Carbohydrates in human nutrition. Report of an FAO/WHO expert consultation on carbohydrates, April 14-18, 1997, Rome, Italy. Rome, Italy.
- Fernandez-Garcia E, Carvajal-Lerida I, Perez-Galvez A. 2009. In vitro bioaccessibility assessment as a prediction tool of nutritional efficiency. Nutr Res. 29:751–760.
- Ferrer-Mairal A, Penalva-Lapuente C, Iglesia I, Urtasun L, De Miguel-Etayo P, Remon S, Cortes E, Moreno LA. 2012. In vitro and in vivo assessment of the glycemic index of bakery products: influence of the reformulation of ingredients. Eur J Nutr. 51(8):947–954.
- Foster-Powell K, Holt SH, Brand-Miller JC. 2002. International table of glycemic index and glycemic load values: 2002. Am J Clin Nutr. 76(1):5–56.
- Fujiwara N, Hall C, Jenkins AL. 2017. Development of Low Glycemic Index (GI) foods by incorporating pulse ingredients into cereal-based products: use of in vitro screening and in vivo methodologies. Cereal Chem. 94(1):110–116.
- Goletzke J, Atkinson FS, Ek KL, Bell K, Brand-Miller JC, Buyken AE. 2016. Glycaemic and insulin index of four common German breads. Eur J Clin Nutr. 70(7):808–811.
- Goñi I, Garcia-Alonso A, Saura-Calixto F. 1997. A starch hydrolysis procedure to estimate glycemic index. Nutr Res. 17(3):427–437.
- Gonzalez-Anton C, Rico MC, Sanchez-Rodriguez E, Ruiz-Lopez MD, Gil A, Mesa MD. 2015. Glycemic responses, appetite ratings and gastrointestinal hormone responses of most common breads consumed in Spain. A randomized control trial in healthy humans. Nutrients. 7(6):4033–4053.
- Hallstrom E, Sestili F, Lafiandra D, Bjorck I, Ostman E. 2011. A novel wheat variety with elevated content of amylose increases resistant starch formation and may beneficially influence glycaemia in healthy subjects. Food Nutr Res. 2011;55. DOI: 10.3402/fnr.v55i0.7074.
- Jenkins DJ, Wolever TM, Taylor RH, Barker H, Fielden H, Baldwin JM, Bowling AC, Newman HC, Jenkins AL, Goff DV. 1981. Glycemic index of foods: a physiological basis for carbohydrate exchange. Am J Clin Nutr. 34(3):362–366.
- Liljeberg H, Åkerberg A, Björck I. 1996. Resistant starch formation in bread as influenced by choice of ingredients or baking conditions. Food Chem. 56(4):389–394.
- Liljeberg H, Bjorck I. 1998. Delayed gastric emptying rate may explain improved glycaemia in healthy subjects to a starchy meal with added vinegar. Eur J Clin Nutr. 52(5):368–371.
- Liljeberg H, Lonner CH, Bjorck IM. 1995. Sourdough fermentation or addition of organic acids or corresponding salts to bread improves nutritional properties of starch in healthy humans. J Nutr. 125:1503–1511.
- Marangoni F, Poli A. 2008. The glycemic index of bread and biscuits is markedly reduced by the addition of a proprietary fiber mixture to the ingredients. Nutr Metab Cardiovasc Dis. 18(9):602–605.
- Marsh K, Barclay A, Colagiuri S, Brand-Miller J. 2011. Glycemic index and glycemic load of carbohydrates in the diabetes diet. Curr Diab Rep. 11(2):120–127.
- Monro JA, Mishra S. 2010. Database values for food-based dietary control of glycaemia. J Food Compost Anal. 23(5):406–410.
- NFA. 2012. Riksmaten – vuxna 2010–11. Livsmedels- och näringsintag bland vuxna i Sverige. Resultat från matvaneundersökning utförd 2010–11. (“Riksmaten – adults 2010-11 – Food and nutrition among adults in Sweden. Results from food survey conducted 2010-11”). Swedish National Food Agency, Uppsala, Sweden.
- Novotni D, Ćurić D, Bituh M, Colić Barić I, Škevin D, Čukelj N. 2011. Glycemic index and phenolics of partially-baked frozen bread with sourdough. Int J Food Sci Nutr. 62(1):26–33.
- Östman EM, Nilsson M, Liljeberg Elmståhl HGM, Molin G, Björck I. 2002. On the effect of lactic acid on blood glucose and insulin responses to cereal products: mechanistic studies in healthy subjects and in vitro. J Cereal Sci. 36(3):339–346.
- Salas-Salvado J, Martinez-Gonzalez MA, Bullo M, Ros E. 2011. The role of diet in the prevention of type 2 diabetes. Nutr Metab Cardiovasc Dis. 21(Suppl 2):B32–B48.
- Sheard NF, Clark NG, Brand-Miller JC, Franz MJ, Pi-Sunyer FX, Mayer-Davis E, Kulkarni K, Geil P. 2004. Dietary Carbohydrate (Amount and Type) in the Prevention and Management of diabetes: a statement by the American diabetes association. Diabetes Care. 27(9):2266–2271.
- Udani JK, Singh BB, Barrett ML, Preuss HG. 2009. Lowering the glycemic index of white bread using a white bean extract. Nutr J. 8:52.
- Urooj A, Puttaraj S. 2000. Glycaemic responses to cereal-based Indian food preparations in patients with non-insulin-dependent diabetes mellitus and normal subjects. Br J Nutr. 83(5):483–488.
- van Kempen TA, Regmi PR, Matte JJ, Zijlstra RT. 2010. In vitro starch digestion kinetics, corrected for estimated gastric emptying, predict portal glucose appearance in pigs. J Nutr. 140(7):1227–1233.
- Weickert MO, Pfeiffer A. 2008. Metabolic effects of dietary fiber consumption and prevention of diabetes. J Nutr. 138(3):439–442.
- Wolever TM, Brand-Miller JC, Abernethy J, Astrup A, Atkinson F, Axelsen M, Björck I, Brighenti F, Brown R, Brynes A, et al. 2008. Measuring the glycemic index of foods: interlaboratory study. Am J Clin Nutr. 87(1):247S–257S.
- Woolnough JW, Monro JA, Brennan CS, Bird AR. 2008. Simulating human carbohydrate digestion in vitro: a review of methods and the need for standardisation. Int J Food Sci Tech. 43(12):2245–2256.