
Abstract
Phenolic catabolites excreted by fasting subjects with a functioning colon and ileostomists on a low (poly)phenol diet have been investigated. Urine was collected over a 12 h fasting period after adherence to a low (poly)phenol diet for 36 h. UHPLC-HR-MS quantified 77 phenolics. Some were present in the urine of both groups in similar trace amounts and others were excreted in higher amounts by participants with a colon indicating the involvement of the microbiota. Most were present in sub- or low-µmol amounts, but hippuric acid dominated accounting on average for 60% of the total for both volunteer categories indicating significant production from sources other than non-nutrient dietary (poly)phenols. The potential origins of the phenolics associated with the low (poly)phenol diet, include endogenous catecholamines, surplus tyrosine and phenylalanine, and washout of catabolites derived from pre-study intakes of non-nutrient dietary (poly)phenols.
Introduction
Dietary (poly)phenolics, including flavonoids, occur mainly conjugated with sugars such as glucose, and rutinose, while conjugates of cinnamic acid include quinic and tartaric acid derivatives (Crozier et al. Citation2006). Only very small amounts of a few such conjugates are absorbed unchanged. Deconjugation begins in the upper gastrointestinal tract (GIT) and the released aglycones undergo phase II metabolism in epithelial/hepatic cells appearing in the systemic circulation as the sulphate, glucuronide and methylated derivatives (Williamson et al. Citation2018). However, the bulk of the native (poly)phenol conjugates pass from the small intestine to the colon (Stalmach et al. Citation2010a; Citation2010b; Borges et al. Citation2013) where they are subjected to the action of the resident microbiota. After microbial cleavage of the conjugating moiety, a portion of the released aglycones enters the systemic circulation as phase II metabolites with most being subjected to more extensive catabolism including ring fission. Collectively these transformations yield a substantial range of low molecular weight phenolic catabolites, some of which is absorbed and generally subjected to phase II metabolism, with the remainder being voided in faeces (Jenner et al. Citation2005; Ottaviani et al. Citation2016; Clifford et al. Citation2022).
There is increasing interest in these catabolites because of their potential bioactivity (Verzelloni et al. Citation2011; Van Rymenant et al. Citation2017; Williamson et al. Citation2018; Lonati et al. Citation2022) and the possibility of them serving as biomarkers of (poly)phenol intake (Clarke et al. Citation2020; Ottaviani et al. Citation2020; Xu et al. Citation2023).
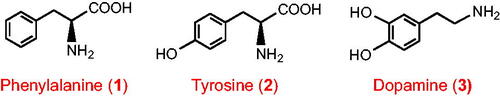
The identification and quantification of phenolics in biofluids and an evaluation of their role in (poly)phenol bioavailability and bioactivity is less straightforward than that of (poly)phenol phase II metabolites of flavonoids. This is because of the number of compounds potentially involved. For instance, Pereira-Caro et al. (Citation2016) identified 65 phenolic derivatives in urine after ingestion of orange juice, while Carregosa et al. (Citation2022) reported that in human intervention studies using diets rich in (poly)phenols 137 low molecular weight phenolics have been detected in plasma. A further complication is that some of the phenolics in plasma and urine do not originate exclusively from non-nutrient dietary (poly)phenols but are endogenous products derived from hepatic catabolism of surplus amino acids such as phenylalanine (1) and tyrosine (2), and catecholamines including dopamine (3). The picture is further complicated as some of the phenolics may also be produced by gut microbiota catabolism of unabsorbed aromatic amino acids. An additional factor is washout from tissues of phenolic catabolites derived from earlier pre-study intakes of non-nutrient dietary (poly)phenols which may also contribute to the urinary phenolic profile.
To obtain further information on the identity, quantity and potential origin of phenolics in urine this paper reports a study in which UHPLC-HR-MS was used to quantify 77 low molecular weight phenolics in urines excreted over a 12 h period by fasting ileostomists and subjects with an intact colon, who for the previous 36 h had followed a low (poly)phenol diet.
Materials and methods
Chemicals and reagents
Formic acid and HPLC-MS-grade methanol were obtained from Panreac (Barcelona, Spain). Ultrapure water was obtained from a Milli-Q water purification system (Millipore, Bedford, MA, USA). 4-Hydroxybenzoic acid, 3-hydroxybenzoic acid, 4′-hydroxy-3′-methoxycinnamic acid [aka ferulic acid], 3′-hydroxy-4′-methocycinnamic acid [aka isoferulic acid] 3′,4′-dihydroxycinnamic acid caffeic acid [aka caffeic acid], 4′-hydroxyphenylacetic acid, phenylacetic acid, 3′-hydroxyphenylacetic acid, 3′,4′-dimethoxyphenylacetic acid, 4′-hydroxy-3′-methoxyphenylacetic acid, hippuric acid, 3′-methylhippuric acid, 3,4-dihydroxybenzoic acid, 4-hydroxy-3-methoxybenzoic acid, 3-hydroxy-4-methoxybenzoic acid, 3-(4′-hydroxy-3′-methoxyphenyl)propanoic acid, 3-(3′-hydroxy-4′-methoxyphenyl)propanoic acid, 2-hydroxy-2-(4′-hydroxy-3′-methoxyphenyl)acetic acid, 3-(3′,4′-dihydroxyphenyl)propanoic acid, 3-(3′,4′-dihydroxyphenyl)acetic acid, 3-(4′-hydroxyphenyl)propanoic acid, 3-(phenyl)propanoic acid, 1,3,5-trihydroxyphenol, 3′-hydroxycinnamic acid, 4-hydroxy-3,5-dimethoxybenzoic acid [aka syringic acid], 4′-hydroxy-3′,5′-dimethoxycinnamic acid [aka sinapic acid], and 4′-hydroxycinnamic acid were obtained from Sigma-Aldrich (Poole, Dorset, U.K.). 3′-Hydroxyhippuric acid and 3-hydroxy-3-(3′-hydroxyphenyl)propanoic acid was purchased from Toronto Research Chemicals (Toronto, Canada). Cinnamic acid-3′-glucuronide, cinnamic acid-4′-glucuronide, 4′-hydroxycinnamic acid-3′-glucuronide, 3′-hydroxycinnamic acid-4′-glucuronide, 4′-hydroxycinnamic acid-3′-sulphate, 3′-methoxycinnamic acid-4′-glucuronide 3′-methoxycinnamic acid-4′-glucuronide [aka ferulic acid-4′-glucuronide], 3′-methoxycinnamic acid-4′-sulphate [aka ferulic acid-4′-sulphate], 4′-methoxycinnamic acid-3′-glucuronide [aka isoferulic acid-3′-glucuronide], 3-(3′-hydroxyphenyl)propanoic acid-4′-glucuronide, 3-(phenyl)propanoic acid-4′-glucuronide, 3-(4′-hydroxyphenyl)propanoic acid-3′-glucuronide, 3-(3′-hydroxyphenyl)propanoic acid-4′-sulphate, 3-(4′-hydroxyphenyl)propanoic acid-3′-sulphate, 3-(3′-methoxyphenyl)propanoic acid-4′-glucuronide, 3-(4′-methoxyphenyl)propanoic acid-3′-glucuronide, and 3-(3′-methoxyphenyl)propanoic acid-4′-sulphate were kindly provided by Denis Barron (Nestle Research Centre, Lausanne, Switzerland) and Gary Williamson (Monash University, Notting Hill, Victoria, Australia). 4′-Hydroxyhippuric acid was obtained from Bachem (UK) Ltd. (St. Helens, UK). 3-(3′-Hydroxyphenyl)propanoic acid was supplied by Fluorochem (Derby, UK). 3-Hydroxy-3-(3′-hydroxy-4′-methoxyphenyl)propanoic acid [aka 3-(3′-Hydroxy-4′-methoxyphenyl)hydracrylic acid] was isolated in a previous study (Pereira-Caro et al. Citation2014). The formal names and synonyms used for phenolic compounds and their phase II metabolites in this paper are based on the nomenclature of Kay et al. (Citation2020).
Study design
The study was conducted with the prior approval of the University of Ulster Ethical Committee (REC 19/0097) and with the informed consent of participants and in accordance with the Declaration of Helsinki and the Human Tissue Act. Eight healthy subjects (4 males and 4 females, mean age 35.1 ± 11 yr) and 10 ileostomists (7 males and 3 females mean age 45.8 ± 11 years) participated in the study. All were non-smokers and the ileostomists had undergone terminal ileostomies at least 1.5 years post-operative prior to the commencement of the study. Both groups followed a low (poly)phenol diet for 36 h avoiding tea and coffee, both regular and decaffeinated, alcohol, fruit juices, fruits and vegetables, chocolate and cocoa-based products, wholemeal bread/grains, spices such as curry, herbs and olive oil. Foods that could be consumed were white bread, butter, vegetable oil, excluding olive oil, pasta, white rice, meat, eggs, fish, potatoes, mushrooms, milk, plain yogurts and cheese. In the final 36–48 h period all participants fasted and urine excreted over the 12 h period was collected the volume and pH were measured and aliquots stored at −80 °C prior to analysis.
Analysis by UHPLC-HR-MS
Aliquots of frozen urine were defrosted, vortexed and centrifuged at 16000 g for 10 min. Then, 5 µL volumes were analysed by UHPLC-HR-MS using an Ultimate 3000 RS UHPLC system (Dionex, San José, CA, USA) described previously by Ordoñez et al. (Citation2020). Briefly, the UHPLC separation was achieved using a Zorbax SB-C18 RRHD column (100 × 2.1 mm i.d., 1.8 µm (Agilent, Santa Clara, CA, USA) preceded by a guard precolumn of the same stationary phase and maintained at 40 °C. The flow rate was set to 0.2 mL/min with a 26 min gradient of phase A: deionised water with 0.1% formic acid and B: acetonitrile with 0.1% formic acid. The gradient started at 3% B, was held for 2 min, before rising to 65% B in 18 min, before increasing to 80% B in 1 min and being maintained for 6 min. The column was then equilibrated with 3% B for 10 min prior to the analysis of a further sample. The Exactive Orbitrap mass spectrometer was fitted with a heated electrospray ionisation probe (ThermoFisher Scientific, San José, CA, USA) and operated in negative ionisation mode (scanning from 100 to 1000 m/z). The capillary temperature and the heater temperature were set to 300 °C and 150 °C, respectively. The sheath gas and the auxiliary gas flow rate was 20 units, the sweep gas was 3 units, and the spray voltage was 4.00 kV. Xcalibur (3.0 software) was used for data acquisition and data processing.
Phenolic compounds were identified by comparing the exact mass and the retention time with available reference compounds. In the absence of standards, phenolic compounds were putatively identified by comparing the theoretical exact mass of the molecular ion with its measured accurate mass and referred to databases or libraries containing HRMS spectral information such as Phenol Explorer (http://phenol-explorer.eu/), Phytohub (http://phytohub.eu/) and Metlin (https://metlin.scripps.edu/landing_page.php?pgcontent=mainPage) databases. Identifications were categorised according to the annotation described by Sumner et al. (Citation2007) using the MSI level (see Supplementary Table S1).
Compounds were quantified by selecting the theoretical exact mass of the molecular ion by reference to 0.1 to 100 ng µL−1 standard curves. The analytes showed good linear relation with a coefficient of determination >0.9824 in the regression analysis of all analytes in a urine matrix. The intra-day precision, expressed as the relative standard deviation, was <2.4%. Inter-day precision was <5.6%. The recoveries for urine presented an average of 129%, while the matrix effect for urine was 64%. In absence of reference compounds, phenolics were quantified using the calibration curve of a closely related parent compound.
Statistical analysis
The results are expressed as mean values ± standard error. Two-way ANOVA and Tukeýs honestly significant difference (HSD) post-hoc test was applied to identify the differences among samples using Statistix software (v. 3.6.3, R Core Team, Vienna, Austria).
Results
Participants with a full GIT and ileostomists whose colon had been removed surgically, adhered to a low (poly)phenol diet for 36 h after which they fasted overnight for a 12 h period during which all excreted urine was collected. UHPLC-HR-MS analysis identified and quantified 77 phenolic compounds in the urine samples (). They comprised 13 cinnamic acids, 3 phenylhydracrylic acids, 14 phenylpropanoic acids, 10 phenylacetic acids, 2 mandelic acids, 15 benzoic acids, 1 benzaldehyde, 15 hydroxybenzenes and 4 hippuric acids (). Mean total excretion by volunteers with an intact colon was appreciably higher than that by ileostomists (609 μmol vs 394 μmol), the difference arising primarily from greater excretion of the hippuric acids (403 μmol vs 252 μmol), hydroxybenzenes (80.6 μmol vs 33.2 μmol) and the phenylhydracrylic acids (21.4 μmol vs 11.5 μmol).
Table 1. Urinary excretion of phenolics by participants, with (n = 8) and without a colon (n = 10), who were on a low (poly)phenol diet for 0–36 h, after which they fasted for 12 h. Urine collected in the 36–48 h period of the study was analysed by UHPLC-HR-MS.
Phenolics excreted in similar amounts by subjects with a colon and ileostomists
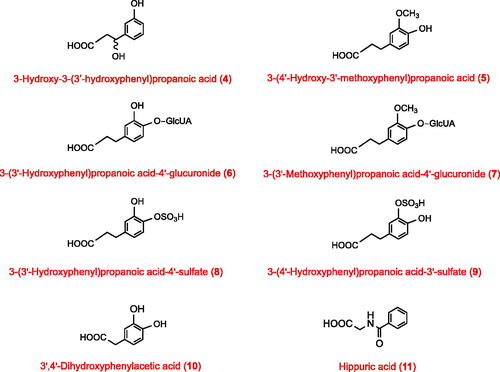
Many of the compounds in , most notably the cinnamic acids, were excreted in low sub-µmol quantities with no significant differences in the amounts detected in urine from participants with and without a colon. Other compounds in this category, also excreted in low µmol amounts, included 3-hydroxy-3-(3′-hydroxyphenyl)propanoic acid (4), the phenylpropanoids 3-(4′-hydroxy-3′-methoxyphenyl)propanoic acid (5), 3-(3′-hydroxyphenyl)propanoic-4′-glucuronide (6), 3-(3′-methoxyphenyl)propanoic acid-4′-glucuronide (7), 3-(3′-hydroxyphenyl)propanoic acid-4′-sulphate (8) and 3-(4′-hydroxyphenyl)propanoic acid-3′-sulphate (9). Also, in this group are 3′,4′-dihydroxyphenylacetic acid (10), two methoxyphenylacetic acid sulphates, two mandelic acids, methoxybenzoic acid-sulphate-2 and dihydroxybenzene-sulphate-1 and −3 (). Hippuric acid (11) was by far the major aromatic detected in the study with 366 ± 28 µmol for participants with a colon and 238 ± 13 µmol excreted by the ileostomists (). The two levels of excretion are not statistically different because of large differences in the amounts voided in urine by individual subjects, with respective quotients 9.6 and 3.7 for subjects with an intact colon and ileostomists ().
Table 2. Urinary excretion of hippuric acids by individual participants with (n = 8) and without a colon (n = 10), who had been on a low (poly)phenol diet for 0–36 h, after which they fasted for 12 h. Urine collected in the 36–48 h period of the study was analysed by UHPLC-HR-MS.
Phenolics excreted in lower amounts by ileostomists
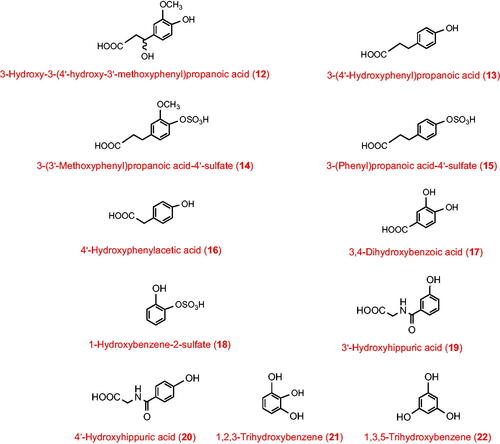
Ileostomists excreted significantly lower amounts of several phenolics than participants with a colon. These phenolics can be formed from substrates absorbed in the stomach and small intestine but they are more extensively produced by the colonic gut microbiota. This category includes two phenylhydracrylic acids, namely 3-hydroxy-3-(3′-hydroxyphenyl)propanoic acid (4), 3-hydroxy-3-(4′-hydroxy-3′-methoxyphenyl)propanoic acid (12), 14 phenylpropanoids without a side-chain 3-hydroxyl group including 3-(4′-hydroxyphenyl)propanoic acid (13), 3-(3′-methoxyphenyl)propanoic acid-4′-sulphate (14), and 3-(phenyl)propanoic acid-4′-sulphate (15), along with 4′-hydroxyphenylacetic acid (16), 3,4-dihydroxybenzoic acid (17), a benzoic acid-sulphate, 1-hydroxybenzene-2-sulphate (18), methoxybenzene-sulphate-2, hydroxy-methoxybenzene-sulphates-1 and 2, and 3′-hydroxyhippuric acid (19) (). The hydroxybenzenes, principally as glucuronide and sulphate conjugates, are the largest class of compounds in this category ().
Note that although there was substantially more 3′-hydroxyhippuric acid excreted by participants with a colon compared with the ileostomists (17.3 ± 2.3 µmol vs 0.90 ± 0.04 µmol), 4′-hydroxyhippuric acid (20) was excreted in statistically similar amounts (19.9 ± 1.4 µmol vs 12.2 ± 0.5 µmol) ().
Phenolics excreted in larger amounts by ileostomists
Two quantitatively minor phenolics, 1,2,3- and 1,3,5-trihydroxybenzene (21, 22), were the only catabolites excreted in significantly higher amounts by ileostomists than by subjects with a colon ().
Discussion
There are six potential sources for the phenolics in the urine of ileostomists and subjects with a colon on a protein-replete, low (poly)phenol diet who are not receiving medication such as aspirin. These are summarised in as categories 1–6.
Table 3. Six potential sources for the phenolics in the urine of subjects with an intact colon and ileostomists on a protein-replete, low (poly)phenol diet.
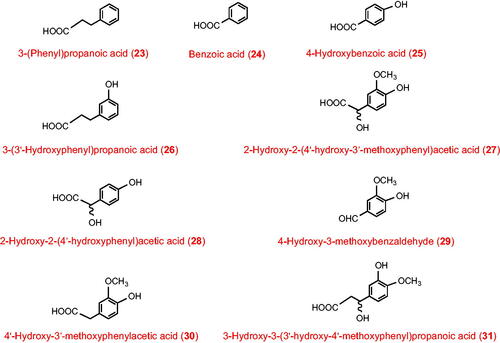
For subjects consuming a protein-replete diet, hepatic catabolism of surplus phenylalanine and tyrosine, category 1, is of particular importance. Studies with isotopically-labelled phenylalanine and tyrosine given orally to subjects dosed with neomycin to suppress the gut microbiota have demonstrated that the phenylalanine is converted to 3-(phenyl)propanoic acid (23), benzoic acid (24) and hippuric acid (11) while tyrosine yields 3-(4′-hydroxyphenyl)propanoic acid (13), 4-hydroxybenzoic acid (25) and 4′-hydroxyhippuric acid (20). Labelled tyrosine incubated in vitro with faecal slurries also yields 3-(4′-hydroxyphenyl)propanoic acid (13) as well as 3-hydroxy-3-(3′-hydroxyphenyl)propanoic acid (4), 3-(3′-hydroxyphenyl)propanoic acid (26) and 3-(phenyl)propanoic acid (23) (Curtius et al. Citation1975, Citation1976). These metabolites will form in the colon from unabsorbed amino acids.
Catecholamines are produced endogenously from phenylalanine and/or tyrosine and their metabolites include 2-hydroxy-2-(4′-hydroxy-3′-methoxyphenyl)acetic acid (27), 2-hydroxy-2-(4′-hydroxyphenyl)acetic acid (28), 4-hydroxy-3-methoxybenzaldehyde (29) and 4′-hydroxy-3′-methoxyphenylacetic acid (30) (Curtius Citation1973; Alonso et al. Citation1982).
Subject to the well-documented person-to-person variation it would be expected that both groups of volunteers would excrete similar quantities of category 1 and 2 catabolites unless some also fall in category 3, for example 3-(4′-hydroxyphenyl)propanoic acid (13) produced by the gut microbiota from unabsorbed tyrosine and its phase-II conjugates, as shown by the results presented in .
Catabolites in categories 4–6 have received little critical attention, being viewed merely as something to be avoided in volunteer studies designed to quantify phenolics associated with a test meal or beverage. Compounds in these categories are derived from (poly)phenol substrates consumed prior to the commencement of the low (poly)phenol diet stage of studies. Category 4 metabolites are derived from substrates which have bound strongly to the gut mucosa, such as ellagitannins, and which remain available for gut microbiota catabolism leading to excretion of urolithins for at least 80 h post-consumption (Truchado et al. Citation2012). Similar behaviour can be reasonably anticipated for the proanthocyanidins and black tea thearubigins and even some simple flavonoids. For example, it is clear from a bioavailability study using 207 µmol of 2-14C-labelled (–)-epicatechin that volunteers with an intact colon may still be voiding labelled substrate and/or catabolites in faeces until at least 6 days post-consumption (Ottaviani et al. Citation2016).
Categories 5 and 6 catabolites have entered the plasma comparatively rapidly post-consumption followed by sequestration in the tissues and/or binding to human serum albumin thus delaying their excretion. These tissue-associated phenolics are potentially responsible for any biological effect associated with consumption of the foods/beverages containing the (poly)phenol substrates. As such, they merit more extensive investigation. Prominent among them are the hydroxybenzenes, which are known from studies with isotopically-labelled substrates to be minor metabolites of aromatic amino acids and catecholamines (Curtius Citation1973, Curtius et al. Citation1975, Citation1976; Alonso et al. Citation1982). Because they are also found in the urine of ileostomists () the gut microbiota are not essential, suggesting that the duodenal fragmentation of flavonols, such as quercetin, and anthocyanins, plus hydrolysis of various gallate esters and gallic acid decarboxylation may be important sources (Schantz et al. Citation2010; Kahle et al. Citation2011; Pimpão et al. Citation2014; Barnes et al. Citation2016; Feliciano et al. Citation2016). Likewise, cinnamic acids, 3-(phenyl)propanoic acids and 3-hydroxy-3-(phenyl)propanoic acids with substituents at both 3′ and 4′ of the phenyl ring. These are characteristic metabolites of caffeoylquinic and feruloylquinic acids (coffee, artichoke, many fruit) and some flavonoids (many fruits and vegetables). The excretion of such metabolites after volunteers have followed a low (poly)phenol diet has been discussed previously (Clifford et al. Citation2020). Some fraction of the C6–C2 metabolites potentially derived from gut microbiota catabolism of flavonols would fall in category 6, whereas category 5 would include C6–C1 metabolites derived from fragmentation of anthocyanins. C6–C1 metabolites could be produced from endogenous β-oxidation of C6–C3 precursors, for example 4-hydroxybenzoic acid (25) derived from 3-(4′-hydroxyphenyl)propanoic acid (13) could be categories 5 and 6 depending on whether it originated in hepatic catabolism of surplus tyrosine or gut microbial metabolism of unabsorbed tyrosine, the latter explaining the greater excretion by volunteers with an intact colon () (Lang et al. Citation2013; Pereira-Caro et al. Citation2017; Clifford et al. Citation2022).
Because it is not feasible to determine the precise origin of all catabolites recorded in , it is not possible to define the amount derived from dietary (poly)phenols (categories 4–6) excreted 36–48 h after commencement of the low (poly)phenol diet, but summation of those which have not been observed as metabolites of catecholamines, phenylalanine and tyrosine indicates that it was at least 110 μmol and 60 μmol, respectively, for volunteers with an intact colon and ileostomists. Such washout is exponential and will be significantly less in the next 24 h, so using a two-day washout rather than a three-day or longer washout might not greatly inflate the total amount of metabolites excreted following consumption of any test meal/beverage. However, it might distort the profile if for example, urolithins derived exclusively from ellagitannins, or 3-hydroxy-3-(3′-hydroxy-4′-methoxyphenyl)propanoic acid (31) a characteristic catabolite of both hesperetin and caffeoylquinic acid intakes, appeared in urine associated with a test meal/beverage which did not contain these substrates. The washout period on a low (poly)phenol diet must be set with care, but clearly should be longer rather than shorter if such distortions are to be avoided. The amounts of categories 4–6 excreted in the 0–36-hour period were not recorded in the current study but would have been appreciably larger because of the exponential character of the washout. More information on the nature of this washout is necessary because of their potential bioactivity, and their potential to provide insights as to the nature of the recent diet.
Hippuric acid (11) was the dominant metabolite excreted 36–48 h after commencement of the low (poly)phenol diet accounting for 60% of the total metabolites for both volunteer groups (). Clinical studies using labelled test substances have recorded hippuric acid yields in 48-hour urines of 12.8% from 207 µmol of 14C-labelled (–)-epicatechin (Ottaviani et al. Citation2016) and 1.2% from 1,114 µmol of 13C5-cyanidin-3-O-glucoside (de Ferrars et al. Citation2014).
Clinical studies with labelled phenylalanine and tyrosine reporting excretion of the associated hippuric acids are scarce. After intravenous injection of two phenylketonuric volunteers with 14C-phenylalanine, Grümer (Citation1961) reported a mean 4.7% recovery of labelled hippuric acid in urine collected for a 6 h period after dosing. This can be taken as a guide to the hepatic fate of surplus endogenous phenylalanine which is independent of the presence or absence of a colon.
Jones et al. (Citation1978) orally dosed 11 healthy males with 14C-phenylalanine (606 μmol/kg) and recorded 2167 ± 724 μmol of hippuric acid (11) in 24-hour urine. Volunteer body weight was recorded as 76 ± 10 kg giving a mean recovery of hippuric acid of 4.7%, albeit with considerable person-to-person variation.
Curtius et al. (Citation1973) orally fed a subject 2H-labelled tyrosine (2) (820 μmol/kg) and monitored the recovery in urine over two days, recording 4.7 mmol of hippuric acid (11) on day 1 and 10.9 mmol on day 2, making a 48 h total of 15.6 mmol. The increased excretion of hippuric acid on day 2 suggests a relatively slow voiding of the unabsorbed tyrosine. Assuming a 65 kg body weight, the overall recovery of labelled-hippuric acid from 2H-tyrosine was ca. 29%. Production of hippuric acid was obliterated by oral dosing the volunteer with neomycin (200 mg/kg) for three days prior to the 2H-tyrosine load. This clearly indicates that the gut microbiota are responsible for at least the initial step in the tyrosine catabolism and, by inference, ileostomists would produce little if any hippuric acid from dietary tyrosine.
Munro (Citation1976) estimated that ingestion of mixed dietary protein by North American subjects contained ca. 4.8% phenylalanine (1) and ca. 2.6% tyrosine (2), and that for a typical daily intake of 100 g protein, some 70 g are lost in urine and 10 g in faeces. This suggests a surplus of 3.8 g (23 mmol) of phenylalanine and 2.1 g (11.6 mmol) of tyrosine which after deamination may lead into C6–C3, C6–C1 catabolites and associated hippuric acids. Assuming respective conversions of 4.7% and 29% of surplus phenylalanine and tyrosine to hippuric acid, based on the data of Jones et al. (Citation1978) and Curtius et al. (Citation1973), such surpluses could deliver ca. 4.5 mmol of hippuric acid for volunteers with an intact colon but only ca. 0.9 mmol for ileostomists because in the absence of gut microbiota tyrosine does not yield benzoic and hippuric acid (see Supplementary Information).
The dominance of hippuric acid in urine after two (38%, 84%) or three days (86%) on a low (poly)phenol diet has previously been observed during washout, but its origin and significance was not discussed (Rios et al. Citation2003; Kahle et al. Citation2011; Castello et al. Citation2018).
Knowledge of the phenolic catabolites of dietary (poly)phenols is of importance because of their potential to impact human health, but it is essential to discriminate between the yield from metabolism of catecholamines, phenylalanine and tyrosine, and that from dietary (poly)phenols in the test meal or beverage. This is particularly important because low (poly)phenol diets will typically be protein-rich and because there is a possibility that (poly)phenols in the test meal/beverage could reduce protein digestibility, as well established for domestic animals, (Jansman et al. Citation1995; Yu et al. Citation1995), and potentially also modulate catecholamine catabolism.
Feeding studies with isotopically-labelled substrates provide the necessary discrimination but raise ethical considerations and have significant limitations of substrate availability, cost and the availability of appropriate analytical protocols and alternative approaches are required (Di Pede et al. Citation2023). One such is the incubation of (poly)phenol substrates and analysis of phenolic catabolites produced by specific microbiota and/or faecal slurries (Pereira-Caro et al. Citation2015, Citation2018) but it is unclear to what extent this represents the human situation in vivo as it does not address mammalian metabolism post-absorption by steps including β-oxidation, phase-II conjugation, and glycination (Williamson and Clifford Citation2010).
An alternative is a refinement of the approach examined in the current study–a feeding study involving participants with a full GIT and ileostomists, who pursue a low (poly)phenol diet for at least 48 h prior to and at least 24 h after test substance, meal or beverage intake with collection of urine every 12 h. Analysis of this urine by UPLC–HRMS provides information on the excretion of relevant metabolites during washout, such as those in .
After transformation to a μmol/h basis the data obtained in the post-feeding period are corrected by subtraction of the data obtained for the final 12-hour period of washout, thus minimising the risk of over-estimating phenolics produced from the test sample. Ideally, the phenylalanine and tyrosine content of the low (poly)phenol diet should be determined, phenolic metabolites in urine should be quantified using authentic standards, and analytical data should be archived for later re-interrogation if required (Clifford and Kuhnert Citation2022). Characterisation of each volunteer’s gut microbiota would be a useful refinement.
Comparison of the data for volunteers with an intact colon and ileostomists allows discrimination of catabolites produced by the gut microbiota. Summation of the total phenolic washout levels provides an insight into tissue accumulation and scrutiny of the washout profile can be used as a guide to a volunteer’s recent diet.
Conclusions
Metabolites of non-nutrient dietary (poly)phenols accumulating in tissues and their washout on low (poly)phenol diets deserve thorough investigation. In assessing the yield of catabolites from dietary (poly)phenols it is recommended that low molecular weight phenolics characteristic of catecholamines, phenylalanine and tyrosine are placed in a separate category because of uncertainty about their origin, and that hippuric acid is excluded from the total.
Structures 1–3.
Structures 4–11.
Structures 12–22.
Structures 23–31.
Supplemental Material
Download PDF (800.3 KB)Disclosure statement
No potential conflict of interest was reported by the author(s).
Additional information
Funding
References
- Alonso R, Gibson CJ, Wurtman RJ, Agharanya JC, Prieto L. 1982. Elevation of urinary catecholamines and their metabolites following tyrosine administration in humans. Biol Psychiatry. 17(7):781–790.
- Barnes RC, Krenek KA, Meibohm B, Mertens-Talcott SU, Talcott ST. 2016. Urinary metabolites from mango (Mangifera indica L. cv. Keitt) galloyl derivatives and in vitro hydrolysis of gallotannins in physiological conditions. Mol Nutr Food Res. 60(3):542–550. doi: 10.1002/mnfr.201500706.
- Borges G, Lean MEJ, Roberts SA, Crozier A. 2013. Bioavailability of dietary (poly)phenols: a study with ileostomists to discriminate between absorption in the small and large intestine. Food Funct. 4(5):754–762. doi: 10.1039/c3fo60024f.
- Carregosa D, Pinto C, Ávila-Gálvez MA, Bastos P, Berry D, Nunes Santos C. 2022. A look beyond dietary (poly)phenols: the low molecular weight phenolic metabolites and their concentrations in human circulation. Compr Rev Food Sci Food Saf. 21(5):3931–3962. doi: 10.1111/1541-4337.13006.
- Castello F, Costabile G, Bresciani L, Tassotti M, Naviglio D, Luongo D, Ciciola P, Vitale M, Vetrani C, Galaverna G, et al. 2018. Bioavailability and pharmacokinetic profile of grape pomace phenolic compounds in humans. Arch Biochem Biophys. 646:1–9. doi: 10.1016/j.abb.2018.03.021.
- Clarke D, Rollo ME, Collins CE, Wood L, Callister L, Philo M, Kroon PA, Haslam RL. 2020. The relationship between dietary polyphenol intakes and urinary polyphenol concentrations in adults prescribed a high vegetable and fruit diet. Nutrients. 12(11):3431. doi: 10.3390/nu12113431.
- Clifford MN, Kuhnert N. 2022a. LC–MS characterisation and quantification of known and unknown (poly)phenol metabolites - possible pitfalls and their avoidance. Mol Nutr Food Res. 66(21):e2101013. doi: 10.1002/mnfr.202101013.
- Clifford MN, Kerimi A, Williamson G. 2020. Bioavailability and metabolism of chlorogenic acids (acyl-quinic acids) in humans. Compr Rev Food Sci Food Saf. 19(4):1299–1352. doi: 10.1111/1541-4337.12518.
- Clifford MN, Laurence J, King LJ, Kerimi A, Pereira-Caro G, Williamson G. 2022b. Metabolism of phenolics in coffee and plant-based foods by canonical pathways: an assessment of the role of fatty acid β-oxidation to generate biologically-active and -inactive intermediates. Crit. Rev. Food Sci. Nutr. 1–58. doi: 10.1080/10408398.2022.2131730.
- Crozier A, Yokota T, Jaganath IB, Marks SC, Saltmarsh M, Clifford MN. 2006. Secondary metabolites as dietary components in plant-based foods and beverages. In: Crozier A, Clifford MN, Ashihara H, editors. Plant secondary metabolites: occurrence, structure and role in the human diet. Blackwell Publishing, Oxford, p. 208–302. ISBN-13: 978-1-4051-2509-3.
- Curtius HC. 1973. Use of deuterated compounds in study of tyrosine-dopa metabolism in phenylketonuria. Angew Chem Int Ed Engl. 12(2):165–165. doi: 10.1002/anie.197301651.
- Curtius HC, Völlmin JA, Baerlocher K. 1973b. Study of metabolic pathways in vivo using stable isotopes. Anal Chem. 45(7):1107–1110.
- Curtius HC, Redweik U, Steinman B, Leimbacher W, Wegmann H. 1975. Use of deuterated tyrosine and phenylalanine in studies of catecholamine and aromatic acid metabolism. In: Klein ER, Klein PD, editors. Proceedings of the Second International Conference on Stable Isotopes, Oak Brook: Illinois; p. 385–391.
- Curtius HC, Mettler M, Ettlinger L. 1976. Study of the intestinal tyrosine metabolism using stable isotopes and gas chromatography–mass spectrometry. J Chromatogr. 126:569–−580. doi: 10.1016/s0021-9673(01)84102-9.
- de Ferrars RM, Czank C, Zhang Q, Botting NP, Kroon PA, Cassidy A, Kay CD. 2014. The pharmacokinetics of anthocyanins and their metabolites in humans. Br J Pharmacol. 171(13):3268–3282. doi: 10.1111/bph.12676.
- Di Pede G, Mena P, Bresciani L, Almutairi TM, Del Rio D, Clifford MN, Crozier A. 2023. Human colonic catabolism of dietary flavan-3-ol bioactives. Mol Aspects Med. 89:101107. doi: 10.1016/j.mam.2022.101107.
- Feliciano RP, Istas G, Heiss C, Rodriguez-Mateos A. 2016. Plasma and urinary phenolic profiles after acute and repetitive intake of wild blueberry. Molecules. 21(9):1120. doi: 10.3390/molecules21091120.
- Grümer HD. 1961. Formation of hippuric acid from phenylalanine labelled with carbon-14 in phenylketonuric subjects. Nature. 189(4758):63–64. doi: 10.1038/189063a0.
- Jansman AJM, Verstegen MW, Huisman J, van den Berg JW. 1995. Effects of hulls of faba beans (Vicia faba L.) with a low or high content of condensed tannins on the apparent ileal and fecal digestibility of nutrients and the excretion of endogenous protein in ileal digesta and feces of pigs. J Anim Sci. 73(1):118–127. doi: 10.2527/1995.731118x.
- Jenner AM, J. Rafter J, Halliwell B. 2005. Human fecal water content of phenolics: the extent of colonic exposure to aromatic compounds. Free Radic Biol Med. 38(6):763–772. doi: 10.1016/j.freeradbiomed.2004.11.020.
- Jones MR, Kopple JD, Swendseid ME. 1978. Phenylalanine metabolism in uremic and normal man. Kidney Int. 14(2):169–179. doi: 10.1038/ki.1978.104.
- Kahle K, Kempf M, Schreier P, Scheppach W, Schrenk D, Kautenburger T, Hecker D, Huemmer W, Ackermann M, Richling E. 2011. Intestinal transit and systemic metabolism of apple polyphenols. Eur J Nutr. 50(7):507–522. doi: 10.1007/s00394-010-0157-0.
- Kay CD, Clifford MN, Mena P, McDougall GJ, Andres-Lacueva C, Cassidy A, Del Rio D, Kuhnert N, Manach C, Pereira-Caro G, et al. 2020. Recommendations for standardizing nomenclature for dietary (poly)phenol catabolites. Am J Clin Nutr. 112(4):1051–1068. − doi: 10.1093/ajcn/nqaa204.
- Lang R, Dieminger N, Beusch A, Lee YM, Dunkel A, Suess B, Skurk T, Wahl A, Hauner H, Hofmann T. 2013. Bioappearance and pharmacokinetics of bioactives upon coffee consumption. Anal Bioanal Chem. 405(26):8487–8503. doi: 10.1007/s00216-013-7288-0.
- Lonati E, Carrozzini T, Bruni I, Mena P, Botto L, Cazzaniga E, Del Rio D, Labra M, Palestini P, Bulbarelli A. 2022. Coffee-derived phenolic compounds activate Nrf2 antioxidant pathway in I/R Injury in vitro model: a nutritional approach preventing age related-damages. Molecules. 27(3):1049. doi: 10.3390/molecules27031049.
- Munro HN. 1976. Absorption and metabolism of amino acids with special emphasis on phenylalanine. J Toxicol Environ Health. 2(1):189–206. doi: 10.1080/15287397609529426.
- Ottaviani JI, Borges G, Momma T, Spencer JPE, Keen CL, Crozier A, Schroeter H. 2016. Metabolic fate of [2-14C](–)-epicatechin in humans: wider implications for biomedical assessment of efficacy, safety, and mechanisms of action of polyphenol bioactives. Sci Rep. 6:29034. doi: 10.1038/srep29034.
- Ordoñez-Díaz JL, Moreno-Ortega A, Roldán-Guerra FJ, Ortíz-Somovilla V, Moreno-Rojas JM, Pereira-Caro G. 2020. In vitro gastrointestinal digestion and colonic catabolism of mango (Mangifera indica L.) pulp polyphenols. Foods. 9(12):1836. doi: 10.3390/foods9121836.
- Ottaviani JI, Britten A, Lucarelli D, Luben R, Mulligan AA, Lentjes MA, Fong R, Gray N, Grace PB, Mawson DH, et al. 2020. Biomaker-estimated flavan-3-ol intake is associated with lower blood pressure in cross-sectional analysis in EPIC Norfolk. Sci Rep. 10(1):17994. doi: 10.1038/s41598-020-74863-7.
- Pereira-Caro G, Borges G, van der Hooft J, Clifford MN, Del Rio D, Lean MEJ, Roberts SA, Kellerhals MB, Crozier A. 2014. Orange juice (poly)phenols are highly bioavailable in humans. Am J Clin Nutr. 100(5):1378–1384. doi: 10.3945/ajcn.114.090282.
- Pereira-Caro G, Borges G, Ky I, Ribas A, Calani L, Del Rio D, Clifford MN, Roberts SA, Crozier A. 2015. In vitro colonic catabolism of orange juice (poly)phenols. Mol Nutr Food Res. 59(3):465–475. doi: 10.1002/mnfr.201400779.
- Pereira-Caro G, Ludwig IA, Polyviou T, Malkova D, Garcia A, Moreno-Rojas JM, Crozier A. 2016. Identification of plasma and urinary metabolites and catabolites derived from orange juice (poly)phenols: analysis by high performance liquid chromatography-high resolution-mass spectrometry. J Agric Food Chem. 64(28):5724–5735. doi: 10.1021/acs.jafc.6b02088.
- Pereira-Caro G, Moreno-Rojas JM, Brindani N, Del Rio D, Lean MEJ, Hara Y, Crozier A. 2017. Bioavailability of black tea theaflavins in humans: absorption, metabolisms and colonic catabolism. J Agric Food Chem. 65(26):5365–5374. doi: 10.1021/acs.jafc.7b01707.
- Pereira-Caro G, Fernández-Quirós B, Ludwig IA, Pradas I, Crozier A, Moreno-Rojas JM. 2018. Catabolism of citrus flavanones by the probiotics Bifidobacterium longum and Lactobacillus rhamnosus. Eur J Nutr. 57(1):231–242. doi: 10.1007/s00394-016-1312-z.
- Pimpão RC, Dew T, Figueira ME, McDougall GJ, Stewart D, Ferreira RB, Santos CN, Williamson G. 2014. Urinary metabolite profiling identifies novel colonic metabolites and conjugates of phenolics in healthy volunteers. Mol Nutr Food Res. 58(7):1414–1425. doi: 10.1002/mnfr.201300822.
- Rios LY, Gonthier MP, Remesy C, Mila I, Lapierre C, Lazarus SA, Williamson G, Scalbert A. 2003. Chocolate intake increases urinary excretion of polyphenol-derived phenolic acids in healthy human subjects. Am J Clin Nutr. 77(4):912–918. doi: 10.1093/ajcn/77.4.912.
- Schantz M, Erk T, Richling E. 2010. Metabolism of green tea catechins by the human small intestine. Biotechnol J. 5(10):1050–1059. doi: 10.1002/biot.201000214.
- Stalmach A, Mullen W, Steiling H, Williamson G, Lean MEJ, Crozier A. 2010a. Absorption, metabolism, efflux and excretion of green tea flavan-3-ols in humans with an ileostomy. Mol Nutr Food Res. 54(3):323–334. doi: 10.1002/mnfr.200900194.
- Stalmach A, Steiling H, Williamson G, Crozier A. 2010b. Bioavailability of chlorogenic acids following acute ingestion of coffee by humans with an ileostomy. Arch Biochem Biophys. 501(1):98–105. doi: 10.1016/j.abb.2010.03.005.
- Sumner LW, Amberg A, Barrett D, Beale MH, Beger R, Dayk CA, Fan TWM, Fiehn O, Goodacre R, Griffin JL, et al. 2007. Proposed minimum reporting standards for chemical analysis. Chemical analysis working group (CAWG) Metabolic Standards Initiative (MSI). Metabolomics. 3(3):211–221. doi: 10.1007/s11306-007-0082-2.
- Truchado P, Larrosa M, Garcia-Conesa MT, Cerda B, Vidal-Guevara ML, Tomás-Barberán FA, Espin JC. 2012. Strawberry processing does not affect the production and urinary excretion of urolithins, ellagic acid metabolites, in humans. J Agric Food Chem. 60(23):5749–5754. doi: 10.1021/jf203641r.
- Van Rymenant E, Grootaert C, Beerens K, Need PW, Kroon PA, Kerimi A, Williamson G, García-Villalba R, González-Sarrías A, Tomás-Barberán F, et al. 2017. Vasorelaxant activity of twenty-one physiologically relevant (poly)phenolic metabolites on isolated mouse arteries. Food Funct. 8(12):4331–4335. doi: 10.1039/c7fo01273j.
- Verzelloni E, Pellacani C, Tagliazucchi D, Tagliaferri S, Calani L, Costa LG, Brighenti F, Borges G, Crozier A, Conte A, et al. 2011. Antiglycative and neuroprotective activity of colon-derived polyphenol catabolites. Mol Nutr Food Res. 55(S1):S35–S43. doi: 10.1002/mnfr.201000525.
- Williamson G, Clifford MN. 2010. Colonic metabolites of berry polyphenols: the missing link to biological activity? Br J Nutr. 104(S3):S48–S66. doi: 10.1017/S0007114510003946.
- Williamson G, Kay CD, Crozier A. 2018. The bioavailability, transport and bioactivity of dietary flavonoids: a review from a historical perspective. Compr Rev Food Sci Food Saf. 17(5):1054–1112. doi: 10.1111/1541-4337.12351.
- Xu Y, Li Y, Ma X, Alotaibi W, Le Saye M, Cheok A, Wood E, Hein S, Yang PYT, Hall WL, et al. 2023. Comparison between dietary assessment methods and biomarkers in estimating dietary (poly) phenol intake. Food Funct. 14(3):1369–1386. doi: 10.1039/d2fo02755k.
- Yu F, Barry TN, McNabb WC, Moughan PJ, Wilson GF. 1995. Effect of bound condensed tannin from cottonseed upon in situ protein solubility and dry matter digestion in the rumen. J Sci Food Agric. 69(3):311–319. doi: 10.1002/jsfa.2740690307.