
 ?Mathematical formulae have been encoded as MathML and are displayed in this HTML version using MathJax in order to improve their display. Uncheck the box to turn MathJax off. This feature requires Javascript. Click on a formula to zoom.
Abstract
This paper introduces the Tax Complexity Index (TCI). The TCI comprehensively measures the complexity of countries’ corporate income tax systems faced by multinational corporations. It builds on surveys of highly experienced tax consultants of the largest international tax services networks. The TCI is composed of a tax code subindex covering tax regulations and a tax framework subindex covering tax processes and features. For a sample of 100 countries, we find that tax complexity varies considerably across countries, and tax code and framework complexity also vary within countries. Among others, tax complexity is strongly driven by the complexity of transfer pricing regulations in the tax code and tax audits in the tax framework. When analyzing the associations with other country characteristics, we identify different patterns. For example, we find a positive association of GDP with tax code complexity and a negative association with tax framework complexity, suggesting that highly economically developed countries tend to have more complex tax codes and less complex frameworks. Overall, the tax complexity measures can serve as valuable proxies in future research and supportive tools for a variety of firm decisions and national and international tax policy discussions.
1. Introduction
This paper introduces the Tax Complexity Index (TCI).Footnote1 The TCI is a new and innovative survey-based measure that captures the complexity of corporate income tax systems across countries and, thereby, allows users to comprehensively assess the tax complexity faced by multinational corporations. Tax complexity is a byproduct of designing and reforming a tax system that aims to maximize social welfare considering the trade-offs among efficiency, equity, and fairness (Carnes & Cuccia, Citation1996; Cuccia & Carnes, Citation2001; Kaplow, Citation1998; Stantcheva, Citation2020). Complexity may be perceived as both unfavorable because of information overload, confusion, uncertainty, and taxpayer frustration (Abeler & Jäger, Citation2015; Feldman et al., Citation2016; Krause, Citation2000) and, thus, may come at a cost, and beneficial because of an increased perception of fairness and individual needs and a subsequent reduction in tax noncompliance (Beck et al., Citation1991). Thus, tax complexity is not unfavorable per se from a firm perspective.
Recent evidence indicates that tax complexity has increased significantly in the past years (Bornemann et al., Citation2021; Devereux, Citation2016, Citation2020; Hoppe et al., Citation2017; Hoppe et al., Citation2020). This increase can be attributed to at least two factors. The first factor is the introduction and adaption of tax measures to ensure a level playing field for firms and to close tax loopholes, leading to extraordinary costs and uncertainty. The second factor is the implementation of tax incentives and mechanisms to attract investments and resolve uncertainties, thereby lowering costs and providing opportunities for tax planning. Nonetheless, concerns have emerged that tax systems have become too complex (Ingraham & Karlinsky, Citation2005, United States; Tran-Nam & Karlinsky, Citation2008, Australia; Deloitte, Citation2014, China; Whiting et al., Citation2014, UK) and that the negative consequences of tax complexity may dominate the positive consequences (Müller & Voget, Citation2012).Footnote2 In particular, tax complexity is expected to jeopardize economic prosperity (Collier et al., Citation2018) and to encourage undesired tax planning or tax avoidance (Budak & James, Citation2018). The negative impact of tax complexity is also addressed by the tax certainty reports of the International Monetary Fund (IMF) and the Organisation for Economic Co-operation and Development (OECD) (IMF & OECD, Citation2017, Citation2018, Citation2019), which conclude that more clarity and less complexity are needed to support economic growth.
Given that a uniform definition of tax complexity is missing, a variety of studies have addressed tax complexity differently. While past studies have often focused on one facet of tax complexity (e.g., Clotfelter, Citation1983; Slemrod & Blumenthal, Citation1996), such as the detail in tax regulations, more recent studies have started to account for the multidimensional nature of the topic by evaluating different facets simultaneously (e.g., OTS, Citation2015; Slemrod, Citation2005; Tran-Nam & Evans, Citation2014). However, as more facets are addressed in the extant literature fewer countries are considered. Given that tax complexity is a worldwide phenomenon, several calls have been issued for more international comparative approaches (Eichfelder, Citation2011; Freudenberg et al., Citation2012; McKerchar, Citation2005; OTS, Citation2015). In this paper, we respond to these calls and create the TCI, a new and innovative country-level measure of the corporate income tax complexity faced by multinational corporations (MNCs).Footnote3
In the development of the index, we follow a two-step formative measurement approach based on the theoretical consideration that the latent construct, tax complexity, is a composite of different dimensions. In the first step, the construct and its dimensions were identified based on the study of Hoppe et al. (Citation2018). They found that tax complexity consists of two subconstructs: tax code complexity (the complexity that arises from the regulations of the tax codeFootnote4) and tax framework complexity (the complexity that arises from the legislative and administrative processes and features within a tax system), each of which is made up of several dimensions. Based on this result, we operationalized the TCI with two subindices that cover these two subconstructs. In the second step, we conducted an online survey via 19 international tax services firms and networks to their highly experienced tax consultants to gather country-level data on their perception of tax complexity for the year 2016.
We employed various measures to ensure the validity of our results. First, we carefully decided to ask many international tax services firms and networks instead of only one to participate in the survey to ensure that the responses are independent and reflect a wide range of perceptions. Second, we provided the respondents with reference points and added definitions as well as anchor examples to avoid a situation in which respondents assess tax complexity differently because of different backgrounds. Third, we carefully pretested the survey to ensure that all questions are relevant and easy to understand. Fourth, we performed a variety of robustness tests to check that the results are not affected by personal characteristics and that they are comparable across countries. For example, we find that the responses do not significantly differ between respondents who are familiar with at least one other tax system and those who are not. Finally, we discussed our results with in-house tax experts of MNCs, tax consultants from several countries, and tax authorities. They not only generally confirmed our results but also provided anecdotal evidence that contributed to a more comprehensive understanding of our results.
In total, we obtained 933 responses that enabled us to measure and assess tax complexity for 100 countries worldwide. Based on these responses, we find that the overall tax complexity varies considerably across countries. There are countries that present both highly or less complex tax codes and frameworks. However, we also observe several countries in which tax code and tax framework complexity differ to a large extent. In particular countries such as the United States, the United Kingdom and Germany, whose tax systems are often considered the most complex, have a medium overall level of complexity that comprises a high level of tax code complexity and a low level of tax framework complexity. From a global perspective, tax complexity is strongly affected by the complexity of transfer pricing regulations in the tax code and by the complexity of tax audits in the tax framework. The main drivers of the complexity of transfer pricing regulations are documentation requirements (record keeping) and the ambiguity (ambiguity and interpretation) of these regulations. In contrast, tax audit complexity is strongly driven by long statutes of limitations and inconsistent decisions by tax officers. An analysis of the associations between the tax complexity measures and economic, political/legal and tax country characteristics shows different correlation patterns. For example, we find a positive association between gross domestic product (GDP) and tax code complexity and a negative association between GDP and tax framework complexity, indicating that highly economically developed countries tend to have more complex tax codes and less complex tax frameworks. However, none of the associations we observe are very strong, which supports the view that tax complexity represents a distinct country characteristic.
We contribute to the extant literature by introducing the Tax Complexity Index, a survey-based new and innovative country measure. Compared with previous measures, the index has several advantages. First, it explicitly focuses on the tax complexity measurement, building on a uniform, well-grounded, and transparent approach. Second, the index is broader because it captures tax complexity faced by MNCs in general and not, for example, by a specific company. Third, the index is based on both facts and perceptions obtained by highly experienced tax professionals. Fourth, it can be decomposed into its components, allowing for the study of different facets of tax complexity (e.g., tax code and tax framework complexity).
Given the index and its underlying components, we pave the way for future research which can range from in-depth descriptive single-country studies to cross-country studies. The data provides new opportunities for research on the impact of tax system characteristics (Atwood et al., Citation2012; Blouin et al., Citation2018; Markle, Citation2016). For example, it allows researchers to investigate how tax complexity affects corporate decisions such as investment, location or profit shifting. In the future, we plan to repeat the survey and update the index biennially to build panel data to enable researchers to examine whether and to what extent tax complexity changes over time and to study how such changes translate into real effects. The panel data provided by future waves of the TCI might be used to analyze how specific reforms (e.g., in the area of transfer pricing, cooperative compliance, administrative procedures in tax enforcement or tax risk management systems) affect tax complexity. Furthermore, decompositions of the TCI enable studies on how country-level complexity moderates the effectiveness of tax reforms conditional on the type and magnitude of tax complexity. The index may also be used as a control variable in all kinds of empirical studies of tax and non-tax issues such as disclosure decisions, real effects, the organizational design of tax-related procedures in firms and tax authorities. In terms of practical implications, the TCI can help policymakers and governments to benchmark their country's tax complexity against that of other countries and identify aspects that require further consideration. Finally, tax practitioners can use the index and its components as a source of information to advance knowledge on countries’ overall or problem-specific tax complexity.
This paper proceeds as follows. Section 2 provides an overview of prior measurement approaches and briefly discusses their meaning and limitations. Section 3 introduces the methodology for the index construction. Section 4 provides descriptive statistics on the TCI and its components. Subsequently, Section 5 compares the TCI and its subindices with other country characteristics. The last section presents a summary and the conclusions.
2. Review of Existing Measurement Approaches
In the literature, the term tax complexity is defined in different ways.Footnote5 Accordingly, a variety of methods for measuring tax complexity have emerged. They build on measuring the costs, characteristics, or perceptions of tax complexity.Footnote6 To provide a systematic overview of the approaches that have been used or proposed in the literature, we categorize them based on two criteria: (1) the number of facets of tax complexity and (2) the number of countries considered. Figure illustrates the resulting categories and their assigned studies.
Figure 1. Categorization of measurement approaches
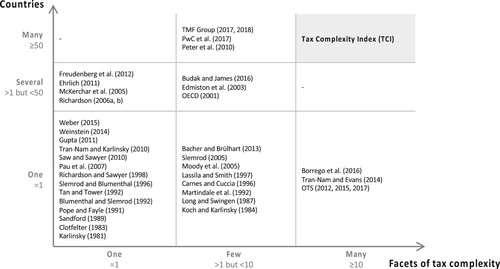
The most common approach is to focus on one facet of tax complexity and to measure it for one country (‘one facet-one country’ in Figure ). Among the well-known studies in this category are those that analyze the costs of taxation, such as Sandford (Citation1989), Pope and Fayle (Citation1991) and Blumenthal and Slemrod (Citation1992) and Slemrod and Blumenthal (Citation1996).Footnote7 The most common types of costs are tax compliance costs, tax administrative and tax planning costs. Because such costs are usually not disclosed, cost studies often gather information through surveys. However, survey-based cost measurement is characterized by several issues, including framing effects.Footnote8 These issues do not emerge when tax complexity is measured using the characteristics of a tax system. Common characteristics examined in prior literature include the detail and the understandability of the tax code or related documents. While details are usually measured by counting the number of regulations, paragraphs or words (Clotfelter, Citation1983; Karlinsky, Citation1981; Weber, Citation2015; Weinstein, Citation2014), understandability is regularly determined through readability indices (Pau et al., Citation2007; Richardson & Sawyer, Citation1998; Saw & Sawyer, Citation2010; Tan & Tower, Citation1992). A serious drawback of these purely fact-based methods is that they often rely on strong assumptions and do not consider how specific facts are actually perceived by taxpayers.Footnote9 This issue is addressed by survey studies that measure tax complexity based on the perceptions of individuals, companies or tax professionals (Gupta, Citation2011; Tran-Nam & Karlinsky, Citation2010). However, most studies focus on the overall complexity level of the tax code or single tax regulations and do not provide deeper insights.
Another approach is to look at two or more selected facets in one country (‘few facets-one country’).Footnote10 The studies assigned to this category either extend or combine the methods described above. For example, Koch and Karlinsky (Citation1984) and Martindale et al. (Citation1992) develop an extended readability measure, while Moody et al. (Citation2005) examine not only compliance costs but also the number of words and sections of the U.S. tax code. Slemrod (Citation2005) and Bacher and Brülhart (Citation2013) extend prior count-based studies by using two measures instead of one. With regard to the perception-based studies, Long and Swingen (Citation1987), Carnes and Cuccia (Citation1996) and Lassila and Smith (Citation1997) take into account the perception of tax complexity sources or costs in addition to the perception of regulations.
More recently, tax complexity has been considered a multidimensional concept and has been measured based on a variety of facets in one country (‘many facets-one country’). This category is strongly influenced by initiatives that governments and other organizations take in their efforts to simplify the tax system. One of the first studies in this category was conducted by the Office of Tax Simplification (OTS), which developed a complexity index for the United Kingdom (OTS, Citation2012, Citation2015, Citation2017). The index covers the underlying complexity and the impact of complexity. A similar index has been proposed but not applied in Australia by Tran-Nam and Evans (Citation2014). Using a survey, Borrego et al. (Citation2016) construct three indices based on several facets of complexity.
All the studies above focus on a specific country, which makes it difficult to generalize and compare their results. Another approach is therefore to measure tax complexity across countries. Studies that examine tax complexity across countries show that in a cross-country setting, several problems arise, for example, issues due to the lack of comparable data (‘one facet-several countries’ or ‘few facets-several countries’).Footnote11 Examples of the first category are the studies of McKerchar et al. (Citation2005), Richardson (Citation2006a, Citation2006b), Ehrlich (Citation2011) and Freudenberg et al. (Citation2012), which either use a count- or perception-based approach to compare one facet of complexity across several countries. Studies by the OECD (Citation2001), Edmiston et al. (Citation2003) and Budak and James (Citation2016), which can be assigned to the second category, extend this stream of literature by considering more than one facet of complexity for several countries. For example, Budak and James (Citation2016) use a rather comprehensive tax complexity measure in their study by applying a modified version of the OTS index to four countries. However, they conclude that the index is not suitable for international comparisons.
To date, studies that consider many countries (50 or more) are rare. Only three studies can be categorized as ‘few facets-many countries,’ namely, Peter et al. (Citation2010), the annual Paying Taxes study of PwC et al. (in the following, we refer to PwC et al., Citation2017) and the study by the TMF Group (Citation2017, Citation2018). While Peter et al. (Citation2010) focus on tax complexity based on six count-based facets and faced by personal taxpayers in 189 countries, based on seven facets, PwC et al. (Citation2017) examine the overall costs and administrative tax burden of a standardized domestic company without any foreign operations in 190 countries, resulting in an overall Paying Taxes measure and some subcomponents. Although PwC et al. (Citation2017) does not directly measure tax complexity but rather general tax system features (such as the total tax rate, time to comply, and others), the few empirical studies that analyze the effects of tax complexity across countries, such as Müller and Voget (Citation2012), Lawless (Citation2013), and Liu and Feng (Citation2015), employ the Paying Taxes measure because it provides some information that is coarsely related to tax complexity. Data for the Paying Taxes measure are gathered through a survey of tax experts from different firms (including PwC). The study by the TMF Group (Citation2017, Citation2018) aims to establish a country ranking of financial complexity, including taxation. Similar to the study of PwC et al. (Citation2017), an (in-house) survey of accounting and tax experts is used to obtain the data to determine the ranking. However, neither TMF Group (Citation2017, Citation2018) nor PwC et al. (Citation2017) provides a comprehensive tax complexity measure. Additionally, information on the number of experts and their characteristics is not available.
Although tax complexity seems to be increasing and is becoming more important (Devereux, Citation2020; Hoppe et al., Citation2017; Lignier et al., Citation2014; Poschmann et al., Citation2019), at present, as previously indicated, no established measure of tax complexity exists that can be used to ascertain the extent and drivers of tax complexity. This also becomes apparent when looking at the literature criticizing both the quality and the usefulness of the Paying Taxes measure as an indicator of total complexity (Tran-Nam & Evans, Citation2014). Several calls have been issued for more internationally comparable, comprehensive measures of tax complexity (McKerchar, Citation2005; OTS, Citation2015). The lack of such measures might also explain why empirical studies on the effects of tax complexity are still rare.
We contribute to the literature on the measurement of tax complexity by developing a unique measurement approach that captures the multidimensional nature of tax complexity faced by MNCs for a large number of countries. Thus, we provide the first study in the category called ‘many facets-many countries.’ We build on a conceptual framework and gather information on tax complexity by surveying experienced tax consultants on both the facts and on their perceptions of various facets of tax complexity (e.g., perceived problems).Footnote12 Facts and perceptions provide valuable complementary information. Whereas facts provide information on de jure regulations and processes, perceptions indicate how they are implemented or put into practice.Footnote13 As indicated by prior literature, professionals’ perceptions appear particularly important; therefore, they should not be neglected when measuring tax complexity.Footnote14 We also adopt an input-oriented (i.e., formative) perspective, which enables us to examine the underlying drivers of tax complexity.Footnote15 With our new approach, we support future research in conducting cross-country analyses and, thus, shedding light on the effects of tax complexity on various issues, such as firm behavior.
3. Development of the Tax Complexity Index
3.1. General Approach
We focus on the corporate income tax system complexity faced by MNCs. To capture the different facets of corporate income tax complexity, based on a formative approach according to Diamantopoulos and Winklhofer (Citation2001), we construct a tax complexity index using a four-step process. First, we specify the domain of the content the index is intended to capture (content specification). Second, we gather the indicators (complexity drivers) that cover the entire scope of the latent variable (tax complexity) (indicator specification). Third, we address the issue of multicollinearity among the variables (collinearity). Fourth, we assess the association between the index and other related variables (external validity).
3.2. Content and Indicator Specification
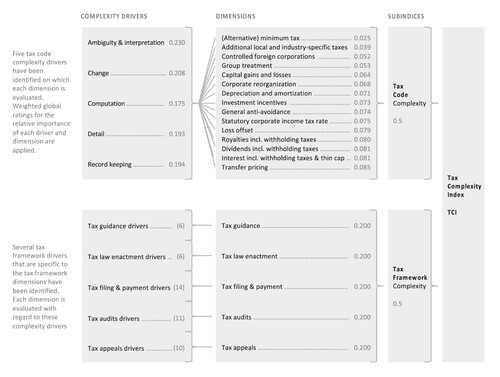
The literature does not provide a uniform definition of tax complexity. Only recently, Hoppe et al. (Citation2018) addressed this problem by deriving a comprehensive definitionFootnote16 and identifying the drivers of tax complexity.Footnote17 They show that tax complexity is a much broader construct than indicated in prior literature and find that tax complexity is a feature of the tax system that arises from the difficulty of reading, understanding, and complying with the tax code, as well as from various issues within the tax framework. Hence, we built on Hoppe et al. (Citation2018) and understand tax complexity as being characterized through two subconstructs, namely, tax code and tax framework complexity, each of which covers various dimensions.
Tax code complexity describes the complexity that is inherent in the different regulations of the tax code. Based on the unpublished data of the survey of Hoppe et al. (Citation2018), we identified 15 regulations that cover a major part of the tax code and that are suitable for an international comparison: additional local and industry-specific income taxes, (alternative) minimum tax, capital gains and losses, controlled foreign corporations, corporate reorganization, depreciation and amortization, dividends including withholding taxes, general anti-avoidance, group treatment, interest including withholding taxes and thin capitalization, investment incentives, loss offset, royalties including withholding taxes, statutory corporate income tax rate, and transfer pricing. In our terminology, each regulation represents a dimension of the tax code. To determine the degree of complexity of these dimensions, we identified five complexity drivers on which each dimension had to be evaluated (ambiguity & interpretation, change, computation, detail and record keeping).Footnote18
Tax framework complexity describes the complexity that arises from the legislative and administrative processes and features within a tax system. Based on the results of Hoppe et al. (Citation2018), we identified five dimensions of the tax framework: tax guidance (i.e., guidance provided by the tax authority or by any law to clarify uncertain tax treatments or procedures), tax law enactment (i.e., the process of how a tax regulation is enacted, starting with the discussion of a change in the tax law and ending with the regulation becoming effective), tax filing and payments (i.e., the process of preparing and filing tax returns as well as the payment and refund of taxes), tax audits (i.e., examination of the tax returns by the tax authority and extent to which they can be anticipated and prepared), and tax appeals (i.e., the process from filing an appeal with the responsible institution to its resolution at the administrative or judicial appeal level).Footnote19 Compared with the dimensions of the tax code, these dimensions had to be evaluated based on several different complexity drivers that are specific to each dimension. We derived these drivers from Hoppe et al. (Citation2018) and a comprehensive literature review.Footnote20
3.3. Gathering Data on Tax Complexity
To collect the data to construct the complexity index for each country, we conducted an online survey of tax consultants.Footnote21 We implemented the survey draft in Qualtrics and carried out comprehensive pretests.Footnote22 The final survey consisted of four parts and 52 standardized questions. In the first part, we asked respondents to specify the country with whose tax system they are most familiar and whether corporate income taxes are levied on resident corporations in that country. Furthermore, to gain familiarity with the topic, the respondents were given a warm-up exercise in which they had to evaluate three statements on the impact of tax complexity in their country. In the second part of the survey, we explored the dimensions of the tax code. In the third part, we focused on the dimensions of the tax framework. In the last part, we gathered demographic information on the respondents.Footnote23 Throughout the survey, we added definitions, hints and anchor examples to several questions to ensure a uniform understanding (irrespective of respondents’ qualifications) and to provide respondents with reference points for their judgments.Footnote24
Before the participants were asked to answer any questions, they had to read a short introduction. They also received some general and content-related instructions. Whenever reasonable, we randomized the order of the questions in the survey. Except for a few questions, for example, on the country for which the responses were to be given, we refrained from using questions with forced responses. However, this approach led to some missing responses that we imputed by using median imputation at the country level.Footnote25 To be included in the dataset, the surveys had to be completed (i.e., respondents had to complete the survey and click ‘submit’ on the last page).
We contacted major international tax services networks and asked them to distribute the survey to randomly selected tax consultants. To ensure the validity of the data for the analysis, the selection criteria for the consultants included an adequate degree of experience in the tax field as well as with MNCs.Footnote26 We sent out an email invitation with the survey link to our contacts in 19 networks on 19 October 2016.Footnote27 These contacts circulated the invitation to at least 5800 consultants around the world.Footnote28 Reminders were sent out after three and five weeks. We received a total of 1016 useable responses from 147 countries by 16 December 2016, yielding a maximum response rate of 17.5%. For the analysis, we focus on responses from countries that levy corporate income taxes (total of 1000 responses from 143 countries).
To check the quality of the responses, we perform two tests. First, we search for respondents who spent a very small amount of time on the survey (less than or equal to five minutes).Footnote29 Second, we check the dataset for inexperienced tax consultants and examine whether their answers are systematically different from the answers of the other respondents from the respective country,Footnote30 which leaves us with 993 responses from 142 countries.
To address the concern that single opinions dictate the level of tax complexity in a specific country, we exclude all countries from the analysis from which we received only one or two responses.Footnote31 This approach results in a remaining sample of 933 responses from 100 countries.Footnote32 in the Appendix displays the distribution of the responses across countries.
in the Appendix provides the demographic information on the respondents.Footnote33 Partners, directors and principals are the largest group (64.4%). 73.0% of the respondents have been working in the tax field for more than 10 years. Almost 90% specialize in income taxes. Furthermore, over 50% are familiar with more than one tax system. The respondents also have major experience with MNCs. On average, on MNC tax issues, the respondents spend 54.1% of their total working time, of which 40.8% is devoted to purely international tax issues. Moreover, the respondents have advanced education (majority with a master's or doctoral degree). In general, the characteristics of the respondents indicate that the sample consists of highly experienced tax consultants. The time they spent on the survey (approximately 39 minutes on average) corresponds to our prediction from the pretest. We therefore expect valid and reliable responses.
3.4. Index Construction
To construct the subindices and the index, we had to aggregate the data.Footnote34 With regard to tax code complexity, we asked the respondents to provide an importance rating for each dimension and complexity driver. The ratings indicate that the 15 dimensions and five complexity drivers of the tax code are not of equal relevance for MNCs. Thus, we applied weights based on the global importance rating of each dimension and complexity driver obtained through a 5-point Likert scale.Footnote35 The resulting weighting factors for the dimensions range from 0.025 (lowest weighting factor) to 0.085 (highest weighting factor), while those for the complexity drivers vary between 0.175 (lowest weighting factor) and 0.230 (highest weighting factor).Footnote36
The approach for constructing the tax code complexity subindex can be decribed by:
(1)
(1)
where
= Complexity of dimension;
= Complexity rating;
= Weighting factor;
= Dimension (1 = additional local and industry-specific income taxes, … , 15 = transfer pricing);
= Complexity driver (1 = ambiguity & interpretation, … , 5 = record keeping).
The tax framework complexity subindex is calculated in a similar manner. However, we assign equal weights to its dimensions and complexity drivers because it would not have been possible to determine reliable differentiated weights for the large number of tax framework complexity drivers. Hence, the tax framework complexity subindex is computed as follows:
(2)
(2)
where
= Complexity of dimension;
= Complexity rating;
= Dimension (1 = tax guidance, … , 5 = tax appeals);
= Complexity driver (specific to each dimension);
= Number of complexity drivers.
The final step is to calculate the total TCI. From prior literature and conversations with tax practitioners, we infer that the tax code and the tax framework are approximately equally important. Hence, we calculate the TCI as the arithmetic mean of both the tax code and the tax framework subindex. Theoretically, all indices can range between zero (not complex at all) and one (extremely complex).Footnote37
(3)
(3)
Figure provides an overview of the concept and the weighting schemeFootnote38 applied. In the following, we will present our results for both the TCI and its subindices.
Figure 2. Concept of tax complexity.
Notes: Tax code: Each dimension of the tax code is evaluated with regard to the complexity drivers ambiguity & interpretation, change, computation, detail and record keeping (panel A of Online Appendix 1). Weights are applied based on the global importance rating of each complexity driver and dimension and are displayed in gray. Tax framework: Each dimension of the tax framework is evaluated with regard to several complexity drivers that are specific to each dimension (panel B of Online Appendix 1). The number of drivers per tax framework dimension is indicated in gray in brackets. The complexity drivers and dimensions are weighted equally. For the construction of the TCI and the tax code and tax framework complexity subindices see eqs. (1) and (2).
3.5. Collinearity and Index Validation
Because each dimension should have a distinct influence on the latent variable, very high correlations between the dimensions would be critical. The correlation matrices in panel A and B of Online Appendix 3 show that nearly all dimensions of both subindices are significantly correlated. However, there are no perfect correlations and even no multicollinearity issues.Footnote39 With regard to the subindices, panel C of Online Appendix 3 shows that the correlation between the indices is not statistically significant. We conclude that the two subindices measure different areas of complexity.Footnote40
The final step in the validation process is to test the validity of the TCI. We start by looking at the external validity, that is, the extent to which the index actually captures the latent construct. Given the lack of different cross-country reflective tax complexity measures on which to apply the common multiple indicators-multiple causes (MIMIC) model (Jöreskog & Goldberger, Citation1975), we are unable to fully evaluate external validity. As an alternative to test external validity, we analyze how the TCI relates to two other composite measures, which are not (pure) tax complexity measures but cover some overlapping aspects of tax (framework) complexity, namely, the Paying Taxes measure of PwC et al. (Citation2017) and the country ranking of the Financial Complexity IndexFootnote41 of the TMF Group (Citation2017, Citation2018).
The Paying Taxes measure of PwC et al. (Citation2017) includes some aspects of tax complexity that are related to the TCI, such as the time to complyFootnote42 that is, to some extent, related to the TCI's tax filing and payments dimension. The TCI comprehensively measures tax complexity and, thus, covers many more aspects related to tax complexity than the Paying Taxes measure. The TCI covers only aspects relevant to tax complexity and abstracts from other tax aspects (such as the amount of contributions, which is measured by PwC et al., Citation2017). The correlations with selected components of the Paying Taxes measure and the overall Paying Taxes measure itself are displayed in Online Appendix 4. All variables are defined in panel A of of the Appendix. Regarding the TCI's filing and payments dimensions and its audits dimensions, we find moderate to strong positive correlations with the time to comply component of the Paying Taxes measure and strong negative correlations with the overall Paying Taxes measure. We find only moderate correlations between the TCI and, even more, the adjusted TCI without the two dimensions filing and payments and audits and the overall Paying Taxes measure. These results substantiate that the TCI is different from the Paying Taxes measure. Only regarding the (few) overlapping parts of the measures, we find corresponding correlations. We see these as a validation of the respective parts of our survey results.
The ranking of the Financial Complexity Index of the TMF Group (Citation2017, Citation2018) covers various complexities, including the parameter tax that is described as ‘tax registration, compliance regulation, and type of taxes.’ However, it is not clear at all how and to what extent this parameter is covered in the construction of the Financial Complexity Index. Based on the description of the parameter tax, the TCI more comprehensively covers tax complexity. In contrast, it does not capture the nontax complexity-related elements of the ranking of the TMF Group (Citation2017, Citation2018), such as financial reporting and bookkeeping complexities. As illustrated in Online Appendix 4, we find a moderate correlation between the TCI and the 2017 and 2018 rankings of the Financial Complexity Index. The highest correlations can be found for our filing and payments dimension. We conjecture that the TCI measures tax complexity in a more specific and comprehensive manner than the TMF Group's Financial Complexity Index.
To summarize, we find strong support that our results, in particular regarding several tax framework dimensions, are generalizable. However, given a lack of comparable data on tax complexity, which is the primary reason we chose to conduct a survey, the question of external validity cannot be fully addressed.Footnote43
To ensure internal validity, we used several ex ante measures. First, to rule out the concern that the results may be systematically different among firms and networks, we asked 19 different firms and networks to participate. Second, it could be possible that the respondents may have different benchmarks for their judgments. We address this concern by providing all respondents with reference points. As previously indicated, we also used definitions and anchor examples to ensure a unique understanding. Third, another concern is that respondents may not have understood certain questions. To mitigate this concern, international tax experts (academics and practitioners) carefully pretested the survey before it was distributed.
Ex-post, we also find strong support for internal validity. First, to determine whether the responses are affected by personal characteristics, we test for significantly different responses across demographic groups of respondents within countries with at least 20 observations.Footnote44 For this purpose, we divide the country samples into two subsamples for each demographic variable.Footnote45 We focus on the TCI, the tax code complexity subindex, and the tax framework complexity subindex. In untabulated results, we carry out a total of 262 robustness tests. For only 25 tests – a share of less than 10% of all tests – statistically significant differences are observed at conventional significance levels.Footnote46 Three remarks on this analysis need to be made. First, a clustering of significant differences is not observed in specific countries. Second, clustering regarding the complexity variable under consideration is not observed. Third, and most importantly, the responses show no specific trend regarding a specific complexity variable. Overall, the findings from this analysis indicate that the demographic background does not seem to have a crucial impact on the responses.
Second, we discussed our results with in-house tax experts of MNCs, tax consultants, and tax authorities from several countries. After reviewing our results, they confirmed them to a large extent and invited us to present the results at several conferences – global partner meetings, global tax department meetings, client conferences, and public conferences. We interpret these invitations and the respective supportive feedback as a validation of the results. Many experts confirmed the plausibility of the resulting complexity ranking of countries for both the overall TCI and the subindices. Furthermore, many participants also found the country-level results per code and framework dimension very plausible and applicable. If the results had been perceived as implausible, the firms would not have repeatedly asked us to present them to their highly knowledgeable international partners or clients during the past three years. Moreover, we were invited to present the results at the OTS, an independent office of the HM Treasury, in the United Kingdom, and at the Federal Ministry of Finance in Germany, and discussed country-specific results with representatives of the South African Revenue Service. In our discussions and public talks, firms and tax authorities provided anecdotal evidence that both confirmed our findings and contributed to a more comprehensive understanding of our results.
To summarize, we build on strong indications for the reliability and trustworthiness of the data.
4. Results
4.1. Tax Complexity Index and Subindices
Table provides the index values for all 100 countries of the sample while Table provides some descriptive statistics for the indices. The sample-wide mean and median of the TCI, which may serve as benchmarks, are both 0.37. Overall, a country that is either not complex at all (0) or extremely complex (1) has not been observed. Instead, the index values range between 0.19 and 0.53. The country with the most complex tax system is Brazil (0.53). This result is similar to that of the TMF Group (Citation2017) and PwC et al. (Citation2017).Footnote47 Even the press often considers Brazil as having ‘one of the most complex tax systems in the world.’Footnote48 In our ranking, it is closely followed by Colombia (0.52), Egypt (0.51), Albania (0.50), and Zimbabwe (0.49). In contrast, the top five countries with the lowest levels of total tax complexity are Jersey (0.19), Nicaragua (0.20), Mauritius (0.22), Estonia (0.22), and Yemen (0.23). Because we restrict our analysis to countries that impose taxes on corporate income, typical tax havens, such as the Cayman Islands, are not included in our sample. Nonetheless, we still find that the TCI varies substantially across the sample countries, with a variation coefficient of 0.19.Footnote49
Table 1. Complexity (sub)index values and complexity levels across countries
Table 2. Descriptive statistics on the Tax Complexity Index and subindices
The mean and median values for tax code complexity are 0.43 and 0.45, respectively, while those for tax framework complexity are both 0.30. Moreover, we find substantial variation in both subindices, with variation coefficients of 0.24 (tax code) and 0.27 (tax framework). With regard to the tax code, Colombia (0.64), the Philippines (0.63), Brazil (0.61), Ghana (0.58) and Chile (0.58) are the most complex countries. The least complex countries are Nicaragua (0.12), Estonia (0.18), Jersey (0.20), Bulgaria (0.23), and Yemen (0.25). For tax code complexity, the list of the five most complex countries is quite different from that of the top-five countries whose complexity is based on the TCI, while the list of the five least complex countries is very similar to the five least complex TCI countries.Footnote50 Ranked by the tax framework, we observe the reverse pattern: the five most complex countries are almost the same as those for the TCI, with Zimbabwe (0.54) having the highest level of tax framework complexity, followed by Albania (0.50), Ethiopia (0.47), Brazil (0.46) and Egypt (0.45). The five countries with the lowest tax framework complexity are largely different, with only Mauritius (0.14) included in both the top-five TCI and the top-five tax framework complexity list. The remaining countries with the least complex tax frameworks are Liechtenstein (0.12), the Netherlands (0.16), Singapore (0.17) and Japan (0.18).
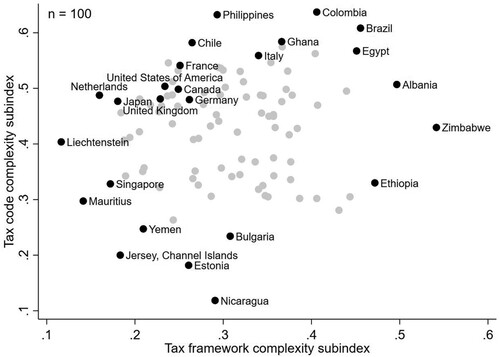
To obtain an impression of the similarities and differences between tax code and tax framework complexity, we classify countries and assign complexity values to five levels, ranging from very low to very high, based on the quintiles of each complexity measure. The results are displayed in Table . We find that approximately only one fifth of our sample (22 countries) receives the same classification for both subindices. In 37 countries, the tax framework has a higher classification, i.e., is more complex than the tax code, whereas in 41 countries, the tax code is more complex than the tax framework. Figure plots values of a subset of the tax code complexity subindex against the respective values of the tax framework complexity subindex, providing additional evidence for this mixed picture. Although this finding seems to be surprising, because a high level of tax code complexity may be expected to encourage a high level of tax framework complexity, the finding is consistent with some of the respondents’ comments. For example, one respondent highlighted in the free text field that in his country, ‘regulations are of a good quality, but implementation is complicated’ because of the ‘lack of professional skills at the administrative and judicial level.’ Furthermore, some respondents mentioned specific instruments within the areas of the tax framework intended to suppress complexities in tax regulations, such as rulings or special audit procedures.
Figure 3. Scatter plot of tax code subindex against tax framework subindex.
Notes: The figure highlights a subset of countries (black circles) that consists of the G7 countries and those five countries with the lowest/highest level of tax complexity for both tax code and tax framework complexity. This subset of countries illustrates on the one hand the position of an important set of major industrialized countries within the sample and on the other hand provides an impression of those countries with an extremely low/high level of complexity. The gray circles describe the remaining countries of the sample. All countries are listed with their tax code and tax framework complexity subindices in Table .
In the last step, we provide results for two groups of countries that are often examined in the literature: member and nonmember countries of the OECD.Footnote51 This distinction is also interesting because the tax conditions and trends in these two groups are quite different.
The descriptive statistics are provided in Online Appendix 5. With regard to the TCI, we do not find a significant difference between the mean complexity values of the OECD (0.36) and the non-OECD (0.37) countries. Hence, OECD countries, on average, have the same level of total tax complexity as non-OECD countries. When we analyze the complexity levels of the OECD countries provided in Table , we obtain a very balanced picture. There are 12 countries with a low or very low level of complexity, 12 countries with a medium level of complexity and 9 countries with a high to very high level of complexity. The classifications also reveal that OECD countries that often claim to have the most complex tax system in the world, such as Germany, the United Kingdom and the United States, have only a medium level of total tax complexity.
Unlike the difference in the TCI between OECD and non-OECD countries, significant differences are observed between OECD and non-OECD countries for the tax code as well as the tax framework subindex. While the mean tax code subindex for the OECD countries (0.46) is significantly greater than the mean tax code subindex for the non-OECD countries (0.41), we find the opposite for the mean tax framework subindex. The latter is significantly lower in OECD countries (0.26) than in non-OECD countries (0.33). Hence, OECD countries, on average, have a more complex tax code and a less complex tax framework than do non-OECD countries. Reconsidering the countries that often claim to have the most complex tax systems in the world, these countries are characterized by a high or very high level of tax code complexity but a low level of tax framework complexity.
4.2. Insights into the Dimensions of Tax Code and Framework Complexity
To provide more insight into the complexity of the tax code and the tax framework, we turn to their dimensions and the underlying complexity drivers. Panel A of Table shows the descriptive statistics of the tax code dimensions. We find that transfer pricing regulations have the highest average level of complexity (0.60) and thus contribute most to the countries’ tax code complexity.Footnote52 These regulations are considered to be the most complex in Russia (0.86), Australia (0.84) and Brazil (0.82). The main complexity drivers of transfer pricing regulations are record keeping and ambiguity and interpretation (see panel A of Online Appendix 6). General anti-avoidance (0.48) and investment incentives (0.47) regulations are ranked second and third in complexity. However, they are closely followed by other regulations, such as those on corporate reorganization (0.46). Similar to transfer pricing regulations, the complexity of regulations on general anti-avoidance is strongly characterized by ambiguity and interpretation as well as record keeping.Footnote53 The complexity of regulations on investment incentives is more strongly determined by record keeping, change and detail.
Table 3. Descriptive statistics on dimensions of tax code and tax framework complexity
In contrast, certain dimensions of the tax code are considered less complex and thus contribute only a small extent to the complexity of the tax code. The lowest average complexity level of 0.17 belongs to (alternative) minimum tax regulations. This result seems surprising given that (alternative) minimum tax rules are sometimes considered highly complex in countries such as the United States, at least prior to 2018. However, there are only a few countries that have such complex rules.Footnote54 Additional local and industry-specific taxes represent the dimension with the second lowest level of complexity overall (0.29). Regarding (alternative) minimum tax regulations, certain countries do not levy additional local and industry-specific taxes at all. If such rules exist, they are often complex, with change being the most important complexity driver. The highest country complexity levels are found in Colombia (0.67), the United States (0.66) and Kenya (0.63).
With respect to the remaining dimensions, the mean complexity levels range between 0.35 for group treatment and 0.46 for corporate reorganization and interest. By considering the complexity drivers across all dimensions, we find that record keeping contributes the most to tax code complexity, followed by detail, ambiguity and interpretation, changes and computation. Finally, we conclude that tax codes are not characterized by the different dimensions and complexity drivers in the same way, as there is much variation within both aspects across countries.
Turning to the tax framework, panel B of Table displays the descriptive statistics for its dimensions. On average, tax audits (0.43) contribute most to the tax framework complexity across countries.Footnote55 We obtain the highest levels of tax audits complexity for Zimbabwe (0.85), Ethiopia (0.79) and Afghanistan (0.70). In contrast, tax filing and payments (0.23) have the lowest impact. Nonetheless, certain countries are characterized by rather high levels of filing and payments complexity, such as Zimbabwe (0.52), Brazil (0.49) and Colombia (0.45). This dimension is closely followed by tax appeals (0.25). Tax guidance and tax law enactment exhibit similar levels of complexity (0.31 and 0.30).
As illustrated in panel B of Online Appendix 6, we find that the high average level of tax audits complexity is induced by several different complexity drivers. One of these drivers is the length of the statute of limitations and the associated uncertainty. Only a few countries have a short statute of limitations. In most countries, between three or five years or even more than five years after a tax return has been filed, tax authorities have the right to perform a tax audit and to adjust the tax payable amount. Another driver is the decision making of tax officers during the audit process. The tax officers’ decisions are often perceived as inconsistent and vary from one officer to another or even for the same officer. As a result, predicting the audit outcome or preparing tax returns based on prior experience can become difficult. Moreover, tax audit complexity is also driven to a large extent by the tax officers’ lack of experience or skills, which results in misunderstandings and mistakes. A substantial level of complexity also comes from the inability to anticipate a tax audit.
Two main drivers affect tax guidance: international soft lawFootnote56 and accounting standards. Regarding international soft law, complexity is triggered by the fact that in dealing with national law, these rules do not offer support by providing additional information but rather contradict national practice. These contradictions often make it even more difficult to apply national law. Turning to accounting standards, complexity is shaped by the differences between Generally Accepted Accounting Principles (GAAP) and tax rules. As the two sets of rules have different objectives, they often deviate from each other. Therefore, adjustments to the accounting treatment are necessary to comply with the tax rules, and these adjustments require additional effort and time.
Three drivers have a strong influence on tax law enactment complexity across countries. The strongest influence is exerted by the (lack of) quality of tax legislation drafting. Due to poorly conceived drafts, overcomplicated texts or inaccurate translations, problems arise after or sometimes even before the enactment of a draft. Another strong driver of tax law enactment complexity is the time between the announcement of tax changes and their enactment. Proposed tax law changes are often enacted without prior announcements. This practice is usually intended to prevent taxpayers from using the proposed changes to plan their transactions ahead in a manner that will avoid the expected outcome of the changes. In this vein, a proposal is discussed and adopted without any public involvement. Accordingly, there are no calls for comments. From the perspective of MNCs, this practice is often critical because it does not allow them to anticipate and react to unintended consequences that the changes may have. Moreover, it creates permanent uncertainty for planning purposes. Similarly, tax law enactment complexity is generally strongly driven by the time at which the legislation becomes effective. Often, changes become effective on the date of enactment or even before (retrospective application), thus creating significant uncertainty and, hence, potential costs for MNCs.
Although tax filing and payments as well as tax appeals contribute, on average, less to tax framework complexity, they also require some attention. Similar to tax guidance complexity, there are two main complexity drivers for tax filing and payments complexity. The most frequently chosen driver is the lack of permission to file a consolidated tax return. Instead, each entity must file a separate return, thus ensuring high compliance costs for large groups. The second most frequent driver is the process of refunding overpaid taxes, which regularly causes problems. These problems may result from complicated application requirements, tight deadlines and long processing times of the tax authority for refunds of overpaid taxes. The resulting tax refund uncertainty can distort MNCs’ decisions. Timing also plays an important role in tax appeals. The most frequent driver of tax appeals complexity is the time period between the filing of an appeal at the judicial level and its resolution. Appeals to courts often take 1–3 years to be resolved.Footnote57 These long time periods impose substantial costs. For instance, if an MNC loses an appeal, it usually has to pay high rates of interest.
5. Comparison with Other Country Characteristics
We compare the TCI and its subindices with an independent set of other country measures. The aim is to determine whether and to what extent any correlation exists between the indices and other commonly used characteristics. Hence, we follow an explorative approach and use bivariate correlation analysis to identify the extent to which the indices and the other characteristics coincide. To structure the analysis, we categorize the country characteristics into three groups: economic, political/legal and tax characteristics. All country characteristics are defined in the Appendix, , panel B. The descriptive statistics on the country characteristics are provided in Online Appendix 7.
Economic characteristics describe the state of a country's economy and include the size of a country measured by the population, the economic development as measured by the GDP, the development level measured by the Human Development Index, the degree of foreign direct investment measured as the net inflow of investments, the infrastructure measured by the telephone lines, and the income inequality measured by the GINI index (Fauver et al., Citation2017; Shevlin et al., Citation2019). Ex ante, the direction of the relation with tax complexity is not clear. On the one hand, the tax system could be a mirror of the economy reflecting its complexities. Hence, more complex tax systems would be associated with more economically sophisticated countries. On the other hand, due to high compliance costs and a high level of uncertainty, tax complexity could also affect a country by suppressing economic activity. As a result, more complex tax systems would be associated with less economically sophisticated economies. Table , panel A reports the results of the analysis. Among the variables, we find both positive and negative associations. Depending on the tax complexity subindex considered, we also find opposing results. For example, regarding the GDP, we find a positive association for tax code complexity, suggesting that highly economically developed countries tend to have more complex tax codes. In contrast, we find a negative association between the GDP and tax framework complexity, indicating that highly economically developed countries tend to have less complex tax frameworks. When we consider the strengths of the associations, we do not find (very) strong associations among the selected country characteristics. The Pearson coefficients for the TCI vary between −0.33 (infrastructure) and 0.47 (population), indicating weak to moderate relations. At the level of the subindices, the Pearson coefficients are slightly larger and vary between −0.45 (development) and 0.52 (GDP).
Table 4. Spearman correlations between tax complexity levels and other country characteristics
Political and legal characteristics capture the strength of a country's government. We focus on general governance as measured by the six governance proxies from the World Bank's Worldwide Governance Indicators project (Akins et al., Citation2017; Andries et al., Citation2017; Beck et al., Citation2014; Langenmayr & Lester, Citation2018; Williams, Citation2018).Footnote58 These proxies cover the following: voice and accountability (i.e., the ability of citizens to participate in choosing the government), political stability and absence of violence/terrorism (i.e., the likelihood that the government will lose its power by unconstitutional means), government effectiveness (i.e., the quality of public services), regulatory quality (i.e., the ability of the government to introduce sound regulations), rule of law (i.e., the trust in the rules of society), and control of corruption (i.e., the ability to influence public power). Strong governance in a country could spill over to the tax system, thus strengthening the quality of the law and making it less complex. In contrast, a complex tax system might also be susceptible to low governance or loose rights and induce corruption and other types of misconduct. As illustrated in panel B of Table , we find a negative association between the TCI and all governance indicators. Therefore, countries with a higher level of total tax complexity tend to be associated with less participation ability for its citizens, a lower level of political stability, a lower level of government effectiveness, lower regulatory quality, lower trust in rules and lower control of corruption. However, similar to the correlation coefficients for the economic characteristics, the Pearson correlation coefficients for the governance indicators are relatively small and range from −0.22 (voice and accountability) to −0.38 (regulatory quality). Only for tax framework complexity, we find correlation coefficients that are considerably larger in magnitude, ranging from −0.39 (political stability) to −0.62 (rule of law).
Finally, we focus on the association between the tax complexity indices and common tax country variables. We investigate the association with the statutory tax rate, the effective average tax rate and the effective marginal tax rate as well as the tax attractiveness measured by the Tax Attractiveness Index (Beuselinck et al., Citation2015; Cristea & Nguyen, Citation2016; Overesch & Wamser, Citation2010; Schanz, Dinkel, et al., Citation2017; Schanz, Keller, et al., Citation2017). We further shed light on the association between tax complexity and the size of the shadow economy, which is assumed to be closely linked to tax evasion (Kirchgässner, Citation2011; Medina & Schneider, Citation2018; Neck et al., Citation2012). For the OECD countries, we also analyze their tax competitiveness. Tax systems with high tax rates could be more complex because they might be affected by base erosion and profit shifting, for which comprehensive anti-avoidance regulations have been enacted to prevent it. In addition to specific measures in the tax code, countries could also employ specific measures within the tax framework, such as aggressive tax audits, to strengthen enforcement and keep companies from shifting their profits to low-tax countries. The results of the analysis on the tax characteristics are provided in panel C of Table . Regarding the association between the TCI and the statutory and effective tax rate measures, we find only weak significant positive and no associations. Regarding tax code complexity, almost all associations are significantly positive but still weak. With regard to a country's tax attractiveness, we find a negative association between the TCI and the Tax Attractiveness index, with a Pearson correlation coefficient of −0.48. Thus, countries with a higher level of tax complexity tend to be less attractive. The association remains negative for both the tax code (−0.31) and the tax framework subindex (−0.45). For tax competitiveness, we also observe significant negative associations with the TCI (−0.30) and the tax code complexity subindex (−0.45). Furthermore, we observe a positive association between the shadow economy and the TCI (0.24), which is driven by the tax framework complexity subindex (0.54), indicating that tax evasion seems to be a more serious problem in countries with more complex tax frameworks.
While the direction of the associations of the TCI and the two subindices with country characteristics is not always the same, overall, the associations are often not very strong. This result supports the view of tax complexity as a distinct country feature that should be accounted for in future cross-country tax research studies.Footnote59
6. Conclusion
In this paper, we introduce the TCI, which is composed of two subindices, the tax code and the tax framework subindex, and represents a new and innovative way to assess the corporate income tax complexity faced by MNCs using survey data. For a sample of 100 countries for the year 2016, we find considerable variation in the overall level of tax complexity across countries. Worldwide tax code complexity is strongly affected by the complexity of transfer pricing regulations. Tax framework complexity is strongly influenced by the complexity of tax audits. We observe that the correlation of tax complexity with several country characteristics varies across countries for both the TCI and the subindices. Overall, we find that countries with a very complex tax code tend to have a larger population, a higher GDP, and higher tax rates. Countries with a very complex tax framework tend to have a lower GDP, a poorer infrastructure, a lower development level, and a lower quality of governance in place. In accordance with these correlation patterns, many highly industrialized countries, such as Germany, the United Kingdom or the United States, are characterized by high tax code complexity but low-tax framework complexity. These countries are also among those that strongly promote fair and equitable tax policies. Hence, the high level of tax code complexity in these countries may be interpreted as a reflection of those policies.
Our study is subject to some limitations. We received a relatively low number of responses from some countries. Even though we address this point by excluding all countries with less than three participants and perform several tests that support the high quality of the responses, future waves of the survey will provide further evidence on this issue. Furthermore, given that our data cover only the year 2016, our analyses are basic and illustrative. Future waves of the survey will allow for a variety of more enhanced analyses.
Our study is the first to establish a comprehensive tax complexity measure for a large number of countries. We provide future research with valuable open-access proxies (TCI and its components) that can be used, for example, to analyze the impact of tax complexity on corporate decisions such as investment, location or profit shifting. This is useful for both firms and tax authorities. Furthermore, these proxies may be used to analyze how specific tax reforms affect the level of tax complexity. The TCI and its components will be useful for policymakers and governments when designing tax policy measures or advancing the digitalization of tax administrations. Identifying regulatory areas that require improvement by benchmarking a specific country against the worldwide average or against peer countries represents another potential application. Tax advisors and tax practitioners can benefit from the TCI as a supportive tool in corporate decision-making and when shaping tax risk management systems.
Supplemental Material
Download PDF (599.8 KB)Data Availability Statement
The Tax Complexity Index and most of the tax complexity data used in this study are openly available and can be downloaded from the EAR website [doi:10.1080/09638180.2021.1951316]. Current data and all available waves of the Tax Complexity Index and its components can be downloaded from www.taxcomplexity.org and can be accessed via the download button. We plan to update this data biennially.
Acknowledgements
We thank Beatriz Garcia Osma (Editor) and two anonymous reviewers for their very insightful suggestions, which have significantly improved our paper. We are grateful for the valuable comments from Eva Eberhartinger (discussant), Alexander Edwards, Sebastian Eichfelder, Martin Fochmann, Daniel Jacob Hemel (discussant), Martin Jacob, Stacie Laplante, Petro Lisowsky, Lillian Mills, Benjamin Osswald, Judyth Swingen, Carina Witte (discussant), Brian Wenzel (discussant), and Franco Wong as well as the participants in the 2019 CPA Ontario University of Toronto Accounting Research Workshop, the 2018 DIBT Meeting at WU Vienna, the 2018 EAA Annual Congress, the 2018 VHB Annual Meeting, the 2018 Annual Meeting of the foundation Stiftung Prof. Dr. oec. Westerfelhaus, the 2018 ATA Midyear Meeting, the 2017 Conference on Empirical Legal Studies, the 2017 Faculty Research Workshop at Paderborn University, the 2017 arqus Annual Meeting, the 2017 Doctoral Seminar at the University of Bayreuth and the meetings of the Taxation and Transfer Pricing working groups of the Schmalenbach-Gesellschaft. This paper won the Best Conference Paper Award of the 80th VHB Annual Conference. Moreover, we deeply appreciate the contributions of our colleagues at the TAF Department at Paderborn University and the Institute for Taxation and Accounting at LMU Munich. This paper received the Best Conference Paper Award of the 80th Annual Conference of the German Academic Association for Business Research in 2018. Thomas Hoppe and Caren Sureth-Sloane gratefully acknowledge financial support by the foundation Stiftung Prof. Dr. oec. Westerfelhaus (Bielefeld, Germany), Susann Sturm gratefully acknowledges financial support by LMU Management Alumni (Munich, Germany). All authors are grateful for financial support by the Deutsche Forschungsgemeinschaft (DFG, German Research Foundation) – Collaborative Research Center (SFB/TRR) Project-ID 403041268 – TRR 266 Accounting for Transparency.
We thank all networks (Baker Tilly Roelfs, BDO, Crowe Kleeberg, Deloitte, DFK, Ecovis, HLB Stückmann, KPMG, Kreston, Moore Stephens, Nexia, PKF, PwC, RSM, Rödl & Partner, Taxand, UHY, Warth & Klein Grant Thornton and WTS) for their support and all survey respondents for their participation.
Supplemental Data and Research Materials
Supplemental data for this article can be accessed on the Taylor & Francis website, doi:10.1080/09638180.2021.1951316
Online Appendix 1. Overview of complexity drivers
Online Appendix 2. Survey instrument
Online Appendix 3. Pearson/Spearman correlations of the index components
Online Appendix 4. Pearson/Spearman correlations external validation
Online Appendix 5. Tax Complexity Index and subindices – OECD vs. non-OECD countries
Online Appendix 6. Descriptive statistics of the complexity drivers
Online Appendix 7. Descriptive statistics of country characteristics
Additional information
Funding
Notes
1 The Tax Complexity Index and most of the tax complexity data used in this study can be downloaded from the EAR website [doi:10.1080/09638180.2021.1951316]. Current data and all available waves of the Tax Complexity Index and its components can be downloaded from www.taxcomplexity.org. We plan to update this data biennially.
2 As indicated by theoretical and experimental studies, tax complexity can discourage investments (Boylan & Frischmann, Citation2006; Diller et al., Citation2017; Niemann, Citation2011; Rupert & Wright, Citation1998; Rupert et al., Citation2003) and trigger noncompliance (Beck et al., Citation1991; Milliron, Citation1985). In this paper, we do not address any questions on the optimal level of tax complexity or the distinction between necessary and unnecessary complexity.
3 Index construction has also been widely applied in other research areas, such as corporate disclosure (Athanasakou et al., Citation2020; Chavent et al., Citation2006; Raffournier, Citation1995), corporate governance (García Lara et al., Citation2007), or the attractiveness of tax systems (Schanz, Keller, et al., Citation2017; Simmons, Citation2003).
4 We use the term ‘regulation’ to cover rules or standards in the tax code. Other (legal) meanings (e.g., guidelines) are not covered by this definition.
5 See Slemrod (Citation1989), McCaffery (Citation1990), Cooper (Citation1993), Evans and Tran-Nam (Citation2010), Tran-Nam and Evans (Citation2014), Diller et al. (Citation2013) or Hoppe et al. (Citation2018).
6 An overview of research on perception and misperception of taxes including tax complexity and its implications for decision-making is provided by Blaufus et al. (Citation2020).
7 A literature review on the measurement of tax (bureaucracy) costs is provided by Eichfelder (Citation2011).
8 See Eichfelder and Vaillancourt (Citation2014) or Eichfelder and Hechtner (Citation2018).
9 When using the number of words in the tax code, a higher number usually indicates a more complex code. However, in practice, it could also mean that the tax code provides more information that helps to understand a tax treatment, thus indicating a less complex tax code.
10 In terms of facets, few is defined as more than one but fewer than ten, while many is defined as ten or more.
11 In terms of countries, several is defined as more than one but fewer than 50, whereas many is defined as 50 or more.
12 We also included questions on facts in the survey because they allowed us to obtain data on these facts on a comparable basis for a large number of countries, which would not have been possible otherwise.
13 For a discussion of the advantages and disadvantages of fact-based and perception-based measures, see Nicoletti and Pryor (Citation2006).
14 Anecdotal evidence suggests that, in the case of tax-related decisions concerning another country, tax consultants of this country are usually contacted and asked for their opinion. Hence, this opinion is expected to enter the decision-making process. Thus, when gathering information on tax complexity, the opinions of tax consultants also need to be included.
15 This approach can be contrasted with the output-oriented (i.e., reflective) approach that assumes that the latent variable causes the indicators (Bollen & Lennox, Citation1991). To determine whether to use the formative or the reflective approach, we applied the decision rules of Jarvis et al. (Citation2003) to our latent variable (tax complexity). Since all results pointed to the formative approach (see also Petter et al., Citation2007), we decided to employ this approach.
16 The definition of Hoppe et al. (Citation2018) builds on the elements of past definitions, adds various new complexity drivers, and expands the literature through a clear distinction between the two pillars of tax complexity. See Hoppe et al. (Citation2018), p. 668.
17 The term ‘drivers’ refers to specific tax complexity-related country characteristics that directly affect tax complexity.
18 See Online Appendix 1, panel A for a description of the tax code complexity drivers.
19 See Hoppe et al. (Citation2018) for the identification of the dimensions of the tax framework.
20 See Online Appendix 1, panel B for a description of the tax framework complexity drivers.
21 The survey instrument is available in Online Appendix 2.
22 We circulated the draft among 14 international tax experts (academics and practitioners) who were asked to complete the survey and answer several questions on the content and the survey design. Based on their remarks, we made some minor revisions by rewriting several questions and response options.
23 For several reasons, we placed the demographic questions at the end of the survey. First, demographic questions are not very interesting for respondents. If respondents take the survey because of an interest in the topic and have to start with demographic questions, they are more likely to quit the survey (Porst, Citation2014). Second, demographic questions do not require strong cognitive skills (Häder, Citation2015). As our survey is relatively long, respondents could become tired by the end. Third, by the end of the survey, respondents are aware of the survey content. As our survey does not contain any sensitive questions, respondents are expected to be more likely to provide answers to the demographic questions at the end.
24 For instance, we defined each dimension of the tax code. We defined transfer pricing regulations as regulations to prevent prices from being charged to a subsidiary or other related party to excessively reduce taxable income. We provided hints in the form of questions to sharpen the respondent's view of this regulation: Does the tax code contain specific regulations on this? If not, do general concepts (e.g., arm's length principle) apply? Does the tax code prescribe specific transfer pricing methods? […]. An anchor example would be, e.g.: OECD guidelines are an example of soft law. Also, see Online Appendix 1.
25 See Laaksonen (Citation2018). An analysis of missing values showed that values are not systematically missing but rather missing completely at random. The missing ratio in the dataset of completed surveys was very small (0.47%).
26 The survey was developed only in English because tax consultants who have experience with MNCs are expected to possess high levels of English proficiency. Given the high share of non-native English-speaking countries in our sample (76%), a selection bias resulting from the language of the survey seems unlikely.
27 These networks include Baker Tilly Roelfs, BDO, Crowe Kleeberg, Deloitte, DFK, Ecovis, HLB Stückmann, KPMG, Kreston, Moore Stephens, Nexia, PKF, PwC, RSM, Rödl & Partner, Taxand, UHY, Warth & Klein Grant Thornton, and WTS. Every network has voluntarily agreed to participate. Besides the receipt of an executive summary, we have not promised the networks or the respondents any explicit (monetary or non-monetary) incentive to participate.
28 The participating networks informed us about their distribution method and the approximate number of people who received the invitation. However, as several networks used existing global distribution lists and asked the recipients to further circulate the survey link within their country, the number of 5800 consultants represents a lower bound of the potential participants. As we assured anonymity to the respondents, we are not able to identify the network to which the respondents belong.
29 We consider a duration of more than five minutes as realistic because survey participants could have printed out the survey to work on it offline and transferred them later to the online survey. Based on this analysis, we drop all six responses from Jordan. Although only one out of six respondents from Jordan spent such a small amount of time on the survey, we also cross-checked the other respondents from this country. Most of them had a similar completion time of approximately 10 minutes. Furthermore, all respondents had very little experience with MNCs (around 5% of their total working time). In the spirit of a cautious approach, we decided not to rely on the answers from Jordan
30 For this purpose, we searched for respondents who are not specialized in income taxes, have less than five years of experience in the tax area, are under 30 years old and have classified themselves as junior assistants.
31 However, even in the remaining countries, the opinions vary across consultants to some extent: this is not bad per se, as people might come from different regions or have had different experiences.
32 Out of these 100 countries, 78 were also included in the sample of the survey of Hoppe et al. (Citation2018). This suggests that the survey results of Hoppe et al. (Citation2018) provide a reliable foundation for our survey.
33 Demographic characteristics have not been imputed. Hence, missing values can occur.
34 According to the formative measurement approach, the weights of the indicators and the dimensions are usually obtained through a multivariate statistical analysis. In the literature, this procedure is sometimes criticized because the weights strongly depend on the outcome variable used for the estimation (Howell et al., Citation2007). Because we lack a suitable outcome variable for tax complexity, we employ our own weights.
35 This approach is also applied by Simmons (Citation2003). When a specific regulation did not exist in a country (‘not applicable’), it received a value of 0.
36 As a robustness check, we recalculated the index based on an equal-weighting approach, which would lead to weighting factors of 0.200 for the complexity drivers and 0.067 for the dimensions. The weights determined through the survey questions do not differ from equal weights to a large extent and, thus, do not substantially change the results. However, the differentiated weighting scheme helps to account for the fact that, in practice, some regulations and complexity drivers play a larger role than others.
37 Compared with other tax measures, such as the statutory tax rate, a change in the TCI might be somewhat difficult to interpret since it is composed of several different elements. If we use as an example a complexity driver of the tax framework, such as inconsistent decisions of tax officers, we see that, if this aspect becomes a problem in a country (when it was not a problem before), the TCI of this country changes by approximately 0.01. Nonetheless, future research can interpret the results related to the TCI, for example, by comparing them with the magnitude of the results for other variables.
38 In general, we understand the weights we use in this paper to calculate the TCI as baseline weights. To account for individual preferences, the weights could be adjusted. A tool that makes it possible to use a custom weighting scheme is available on the project homepage. See www.taxcomplexity.org.
39 In untabulated analyses, we calculate the variance inflation factors (VIFs) for each dimension both within each subindex and among the subindices. All VIFs are clearly below the commonly applied threshold of 10 and even below the threshold of five. We therefore do not expect multicollinearity to be a problem (Bollen & Lennox, Citation1991; Diamantopoulos & Siguaw, Citation2006; Law & Wong, Citation1999).
40 We also examine the correlations between the dimensions of the tax code (tax framework) and the tax framework (tax code) subindex as well as the correlations between the dimensions of the tax code and the dimensions of the tax framework, and find some significant correlations that, however, are mostly weak. This finding suggests that there are certain links between tax code and tax framework complexity but that, overall, both subindices are relatively independent from each other.
41 The rankings of the Financial Complexity Index of the TMF Group are available for 2017 and 2018 only; thus, they are not directly comparable to our 2016 complexity data. The correlation between the two rankings is approximately 0.76, and the mean rank difference is approximately −0.87, indicating little change over the two years. However, the results obtained should be interpreted carefully.
42 The time to comply is the time to prepare, file, and pay taxes and contributions (PwC et al., Citation2017).
43 The limited ability to test for external validity appears to be a common problem when the setting or the data is new (e.g., Bischof et al., Citation2020).
44 Because we need at least a couple of observations for the different demographic groups, we expect a total of 20 observations per country to be sufficient for this kind of test. The 11 resulting countries under investigation are Australia, Austria, Belgium, Germany, Italy, Mexico, Netherlands, Spain, Ukraine, the United Kingdom, and the United States.
45 We do not use the variable specialization because more than 85% of the sample specializes in income taxes. Hence, in most countries, only a very small number of respondents (and sometimes no respondents) do not specialize in income taxes.
46 An important characteristic appears to be the question of whether a respondent is familiar with at least one other tax system because it may shape how the respondent perceives a tax system in general. However, out of 33 tests, we only find one significant difference, thus mitigating this concern.
47 Brazil is the second most complex country out of 94 countries in the TMF Group (Citation2017) and the sixth most complex country out of 189 countries in PwC et al. (Citation2017).
48 See Machado and Utimati (Citation2017).
49 As a measure of dispersion, to allow for comparisons between different variables, we use the variation coefficient instead of the standard deviation. See Bedeian and Mossholder (Citation2000) for some further details on this measure.
50 Only two countries, Brazil and Colombia, belong to both the list of the five most complex tax systems and the list of the five most complex tax codes. In contrast, four countries belong to the lists of the five least complex tax systems and tax codes.
51 We refer to the OECD classification of the year in which our survey was carried out (2016). Therefore, Lithuania, which joined the OECD in 2018, is not considered an OECD member country. Furthermore, Iceland and Latvia are not included in our sample. This results in 33 OECD countries in our sample.
52 This is consistent with the notion that transfer pricing is often considered as one of the most burdensome tax areas (e.g., Klassen et al., Citation2017; Mescall & Klassen, Citation2018).
53 In line with this finding, studies such as that of Laplante et al. (Citation2019) focus on ambiguities in the tax law.
54 Regarding the complexity drivers, the complexity of (alternative) minimum tax regulations is almost equally determined by all complexity drivers. The countries in which (alternative) minimum tax regulations are perceived as the most complex are India (0.59), the Philippines (0.57) and Ecuador (0.55). In the United States, (alternative) minimum tax regulations obtain a value of 0.42. For this regulation, we further observe a variation coefficient of 0.90, the highest level of relative variation.
55 Tax audits appear to be very relevant, not only in terms of tax complexity. Several studies provide evidence for a link between tax audits and firm behavior (e.g., Beuselinck et al., Citation2015; Lin et al., Citation2018).
56 We define international soft law as rules that are neither strictly binding in nature nor completely lacking legal significance. The term refers to guidelines, policy declarations or codes of conduct that are not legally enforceable. OECD guidelines are an example of soft law.
57 For example, in Germany, the average duration of appeal proceedings at the level of the Federal Fiscal Court in 2018 was 20 months. See Bundesfinanzhof (Citation2019).
58 See Kaufmann and Kraay (Citation2008) for a review of the indicators.
59 None of our main findings for the economic, political/legal, and tax system characteristics change when we test for the sensitivity of the associations. Overall, we conduct three different robustness tests. First, since the results of the correlations analysis may be driven by the degree of variation in our complexity data, we use the complexity levels of Table and rerun the bivariate correlation analysis based on these quintiles. Second, because our sample consists of heterogeneous countries, we eliminate different types of extreme values and rerun the correlation analysis based on the new samples. Third, we rerun the correlation analysis using a variety of other economic characteristics (e.g., GDP growth and trade intensity), political/legal characteristics (e.g., investor protection rights and legal origin; Djankov et al., Citation2008; La Porta et al., Citation2008), and tax characteristics (e.g., worldwide versus territorial tax systems; Markle, Citation2016). Additionally, we examine social characteristics (e.g., cultural attributes; Hofstede, Citation1980).
References
- Abeler, J., & Jäger, S. (2015). Complex tax incentives. American Economic Journal: Economic Policy, 7(3), 1–28. https://doi.org/10.1257/pol.20130137
- Akins, B., Dou, Y., & Ng, J. (2017). Corruption in bank lending: The role of timely loan loss recognition. Journal of Accounting and Economics, 63(2/3), 454–478. https://doi.org/10.1016/j.jacceco.2016.08.003
- Andries, K., Gallemore, J., & Jacob, M. (2017). The effect of corporate taxation on bank transparency: Evidence from loan loss provisions. Journal of Accounting and Economics, 63(2/3), 307–328. https://doi.org/10.1016/j.jacceco.2017.03.004
- Athanasakou, V., Eugster, F., Schleicher, T., & Walker, M. (2020). Annual report narratives and the cost of equity capital: U.K. evidence of a U-shaped relation. European Accounting Review, 29(1), 27–54. https://doi.org/10.1080/09638180.2019.1707102
- Atwood, T. J., Drake, M. S., Myers, J. N., & Myers, L. A. (2012). Home country tax system characteristics and corporate tax avoidance: International evidence. The Accounting Review, 87(6), 1831–1860. https://doi.org/10.2308/accr-50222
- Bacher, H. U., & Brülhart, M. (2013). Progressive taxes and firm births. International Tax and Public Finance, 20(1), 129–168. https://doi.org/10.1007/s10797-012-9218-z
- Beck, P. J., Davis, J. S., & Jung, W.-O. (1991). Experimental evidence on taxpayer reporting under uncertainty. The Accounting Review, 66(3), 535–558. https://doi.org/10.1111/j.1911-3846.1996.tb00491.x
- Beck, T., Lin, C., & Ma, Y. (2014). Why do firms evade taxes? The role of information sharing and financial sector outreach. The Journal of Finance, 69(2), 763–817. https://doi.org/10.1111/jofi.12123
- Bedeian, A. G., & Mossholder, K. W. (2000). On the use of the coefficient of variation as a measure of diversity. Organizational Research Methods, 3(3), 285–297. https://doi.org/10.1177/109442810033005
- Beuselinck, C., Deloof, M., & Vanstraelen, A. (2015). Cross-jurisdictional income shifting and tax enforcement: Evidence from public versus private multinationals. Review of Accounting Studies, 20(2), 710–746. https://doi.org/10.1007/s11142-014-9310-y
- Bischof, J., Daske, J., & Sextroh, C. J. (2020). Why do politicians intervene in accounting regulation? The role of ideology and special interests. Journal of Accounting Research, 58(3), 589–642. https://doi.org/10.1111/1475-679X.12300
- Blaufus, K., Chirvi, M., Huber, H.-P., Maiterth, R., & Sureth-Sloane, C. (2020). Tax misperception and its effects on decision making – literature review and behavioral taxpayer response model. European Accounting Review. https://doi.org/10.1080/09638180.2020.1852095
- Blouin, J. L., Robinson, L. A., & Seidman, J. K. (2018). Conflicting transfer pricing incentives and the role of coordination. Contemporary Accounting Research, 35(1), 87–116. https://doi.org/10.1111/1911-3846.12375
- Blumenthal, M., & Slemrod, J. (1992). The compliance cost of the U.S. individual income tax system: A second look after tax reform. National Tax Journal, 45(2), 185–202. https://doi.org/10.1086/NTJ41788959
- Bollen, K., & Lennox, R. (1991). Conventional wisdom on measurement: A structural equation perspective. Psychological Bulletin, 110(2), 305–314. https://doi.org/10.1037/0033-2909.110.2.305
- Bornemann, T., Schipp, A., & Sureth-Sloane, C. (2021). Was treibt die Komplexität der Ertragsbesteuerung multinationaler Unternehmen? – Ergebnisse einer Befragung in der deutschen Finanzverwaltung. Deutsches Steuerrecht, 59(3), 182–190.
- Borrego, A. C., Lopes, C. M. M., & Ferreira, C. M. S. (2016). Tax complexity indices and their relation with tax noncompliance: Empirical evidence from the Portuguese tax professionals. Tékhne, 14(1), 20–30. https://doi.org/10.1016/j.tekhne.2016.07.003
- Boylan, S. J., & Frischmann, P. J. (2006). Experimental evidence on the role of tax complexity in investment decisions. Journal of the American Taxation Association, 28(2), 69–88. https://doi.org/10.2308/jata.2006.28.2.69
- Budak, T., & James, S. (2016). The applicability of the OTS complexity index to comparative analysis between countries: Australia, New Zealand, Turkey, and the UK. eJournal of Tax Research, 14(2), 426–454.
- Budak, T., & James, S. (2018). The level of tax complexity: A comparative analysis between the U.K. and Turkey based on the OTS index. International Tax Journal, 44(1), 23–36.
- Bundesfinanzhof. (2019). Jahresbericht 2018. https://www.bundesfinanzhof.de/fileadmin/media/pdf/jahresberichte/Jahresbericht_2018.pdf
- Carnes, G. A., & Cuccia, A. D. (1996). An analysis of the effect of tax complexity and its perceived justification on equity judgments. Journal of the American Taxation Association, 18(2), 40–56.
- Chavent, M., Ding, Y., Fu, L., Stolowy, H., & Wang, H. (2006). Disclosure and determinants studies: An extension using the divisive clustering method (DIV). European Accounting Review, 15(2), 181–218. https://doi.org/10.1080/09638180500253092
- Clotfelter, C. T. (1983). Tax evasion and tax rates: An analysis of individual returns. The Review of Economics and Statistics, 65(3), 363–373. https://doi.org/10.2307/1924181
- Collier, R., Kari, S., Ropponen, O., Simmler, M., & Todtenhaupt, M. (2018). Dissecting the EU’s recent anti-tax avoidance measures: Merits and problems (EconPol Policy Report No. 08/2018). ifo Institute. https://www.econpol.eu/sites/default/files/2018-09/EconPol_Policy_Report_08_2018_AntiTaxAvoidance.pdf
- Cooper, G. S. (1993). Themes and issues in tax simplification. Australian Tax Forum, 10(4), 417–460.
- Cristea, A. D., & Nguyen, D. X. (2016). Transfer pricing by multinational firms: New evidence from foreign firm ownerships. American Economic Journal: Economic Policy, 8(3), 170–202. https://doi.org/10.1257/pol.20130407
- Cuccia, A. D., & Carnes, G. A. (2001). A closer look at the relation between tax complexity and tax equity perceptions. Journal of Economic Psychology, 22(2), 113–140. https://doi.org/10.1016/S0167-4870(01)00025-3
- Deloitte. (2014). Risk, uncertainty and opportunity in a changing landscape. https://www2.deloitte.com/content/dam/Deloitte/global/Documents/Tax/dttl-tax-ap-2014-tax-complexity-survey.pdf
- Devereux, M. (2016). Measuring corporation tax uncertainty across countries: Evidence from a cross-country survey (Working Paper No. 16/13). Oxford University Centre for Business Taxation. https://oxfordtax.sbs.ox.ac.uk/files/wp16-13pdf
- Devereux, M. (2020, November 2). Measuring corporation tax uncertainty: Evidence from three phases of a cross-country survey [Paper presentation]. ETPF and Tax Foundation Conference, Online.
- Diamantopoulos, A., & Siguaw, J. A. (2006). Formative versus reflective indicators in organizational measure development: A comparison and empirical illustration. British Journal of Management, 17(4), 263–282. https://doi.org/10.1111/j.1467-8551.2006.00500.x
- Diamantopoulos, A., & Winklhofer, H. M. (2001). Index construction with formative indicators: An alternative to scale development. Journal of Marketing Research, 38(2), 269–277. https://doi.org/10.1509/jmkr.38.2.269.18845
- Diller, M., Grottke, M., & Schneider, G. (2013). Komplexität steuerrechtlicher Normen – Ein spieltheoretischer Erklärungsansatz. Zeitschrift für betriebswirtschaftliche Forschung, 65(2), 110–135. https://doi.org/10.1007/BF03372876
- Diller, M., Kortebusch, P., Schneider, G., & Sureth-Sloane, C. (2017). Boon or bane? Advance tax rulings as a measure to mitigate tax uncertainty and foster investment. European Accounting Review, 26(3), 441–468. https://doi.org/10.1080/09638180.2016.1169939
- Djankov, S., La Porta, R., Lopez-de-Silanes, F., & Shleifer, A. (2008). The law and economics of self-dealing. Journal of Financial Economics, 88(3), 430–465. https://doi.org/10.1016/j.jfineco.2007.02.007
- Edmiston, K., Mudd, S., & Valev, N. (2003). Tax structures and FDI: The deterrent effects of complexity and uncertainty. Fiscal Studies, 24(3), 341–359. https://doi.org/10.1111/j.1475-5890.2003.tb00087.x
- Ehrlich, S. D. (2011). Complexity and the tariff schedule. In S. D. Ehrlich (Ed.), Access points: An institutional theory of policy bias and policy complexity (pp. 154–176). Oxford University Press.
- Eichfelder, S. (2011). Steuerliche Bürokratiekosten: Eine Analyse der empirischen Literatur. Steuer und Wirtschaft, 88(1), 38–48.
- Eichfelder, S., & Hechtner, F. (2018). Tax compliance costs: Cost burden and cost reliability. Public Finance Review, 46(5), 764–792. https://doi.org/10.1177/1091142117691603
- Eichfelder, S., & Vaillancourt, F. (2014). Tax compliance costs: A review of cost burdens and cost structures. Review of Public Economics, 210(3), 111–148.
- Evans, C., & Tran-Nam, B. (2010). Controlling tax complexity: Rhetoric or reality? In C. Evans, R. Krever, & P. Mellor (Eds.), Australia’s future tax system: The prospects after Henry (pp. 439–463). Thomsen Reuters.
- Fauver, L., Hung, M., Li, X., & Taboada, A. G. (2017). Board reforms and firm value: Worldwide evidence. Journal of Financial Economics, 125(1), 120–142. https://doi.org/10.1016/j.jfineco.2017.04.010
- Feldman, N. E., Katuščák, P., & Kawano, L. (2016). Taxpayer confusion: Evidence from the child tax credit. American Economic Review, 106(3), 807–835. https://doi.org/10.1257/aer.20131189
- Freudenberg, B., Tran-Nam, B., Karlinsky, S., & Gupta, R. (2012). A comparative analysis of tax advisers’ perception of small business tax law complexity: United States, Australia and New Zealand. Australian Tax Forum, 27(4), 677–718.
- García Lara, J. M., García Osma, B., & Penalva, F. (2007). Board of directors’ characteristics and conditional accounting conservatism: Spanish evidence. European Accounting Review, 16(4), 727–755. https://doi.org/10.1080/09638180701706922
- Gupta, R. (2011). Simplify tax maze to grow small business: New Zealand study. Australian Tax Forum, 26(2), 173–212.
- Häder, M. (2015). Empirische Sozialforschung. Springer.
- Hofstede, G. (1980). Culture’s Consequences: International differences in work-related values. Sage Publications.
- Hoppe, T., Schanz, D., Schipp, A., Siegel, F., Sturm, S., & Sureth-Sloane, C. (2020). 2018 Global MNC Tax Complexity Survey – Executive summary. TRR 266 Accounting for Transparency. https://doi.org/10.52569/RPVO1003
- Hoppe, T., Schanz, D., Sturm, S., & Sureth-Sloane, C. (2017). 2016 Global MNC Tax Complexity Survey – Executive summary. https://www.taxcomplexity.org/download/2016%20Global%20MNC%20Tax%20Complexity%20Survey%20-%20Executive%20Summary.pdf
- Hoppe, T., Schanz, D., Sturm, S., & Sureth-Sloane, C. (2018). What are the drivers of tax complexity for MNCs? Global evidence. Intertax, 46(8/9), 654–675. https://ssrn.com/abstract=3230711
- Howell, R. D., Breivik, E., & Wilcox, J. B. (2007). Reconsidering formative measurement. Psychological Methods, 12(2), 205–218. https://doi.org/10.1037/1082-989X.12.2.205
- Ingraham, L. R., & Karlinsky, S. (2005). Tax professionals’ perception of small-business tax law complexity. Tax Notes, 107(1), 79–89.
- International Monetary Fund (IMF), & Organisation for Economic Co-operation and Development (OECD). (2017). Tax certainty. http://www.oecd.org/tax/tax-policy/tax-certainty-report-oecd-imf-report-g20-finance-ministers-march-2017.pdf
- International Monetary Fund (IMF), & Organisation for Economic Co-operation and Development (OECD). (2018). Update on tax certainty. http://www.oecd.org/tax/tax-certainty-update-oecd-imf-report-g20-finance-ministers-july-2018.pdf
- International Monetary Fund (IMF), & Organisation for Economic Co-operation and Development (OECD). (2019). Progress report on tax certainty. https://www.oecd.org/tax/tax-policy/imf-oecd-2019-progress-report-on-tax-certainty.pdf
- Jarvis, C. B., MacKenzie, S. B., & Podsakoff, P. M. (2003). A critical review of construct indicators and measurement model misspecification in marketing and consumer research. Journal of Consumer Research, 30(2), 199–218. https://doi.org/10.1086/376806
- Jöreskog, K. G., & Goldberger, A. S. (1975). Estimation of a model with multiple indicators and multiple causes of a single latent variable. Journal of the American Statistical Association, 70(351), 631–639. https://doi.org/10.2307/2285946
- Kaplow, L. (1998). Accuracy, complexity, and the income tax. Journal of Law, Economics, and Organization, 14(1), 61–83. https://doi.org/10.1093/oxfordjournals.jleo.a023400
- Karlinsky, S. S. (1981). Complexity in the Federal income tax law attributable to the capital gain and loss preference: A measurement model. University of Washington.
- Kaufmann, D., & Kraay, A. (2008). Governance indicators: Where are we, where should we be going? The World Bank Research Observer, 23(1), 1–30. https://doi.org/10.1093/wbro/lkm012
- Kirchgässner, G. (2011). Tax morale, tax evasion and the shadow economy. In F. Schneider (Ed.), Handbook of the shadow economy (pp. 347–374). Edward Elgar.
- Klassen, K. J., Lisowsky, P., & Mescall, D. (2017). Transfer pricing: Strategies, practices, and tax minimization. Contemporary Accounting Research, 34(1), 455–493. https://doi.org/10.1111/1911-3846.12239
- Koch, B. S., & Karlinsky, S. S. (1984). The effect of Federal income tax law reading complexity on students’ task performance. Issues in Accounting Education, 2(1), 98–110.
- Krause, K. (2000). Tax complexity: Problem or opportunity? Public Finance Review, 28(5), 395–414. https://doi.org/10.1177/109114210002800501
- La Porta, R., Lopez-de-Silanes, F., & Shleifer, A. (2008). The economic consequences of legal origins. Journal of Economic Literature, 46(2), 285–332. https://doi.org/10.1257/jel.46.2.285
- Laaksonen, S. (2018). Survey methodology and missing data: Tools and techniques for practitioners. Springer.
- Langenmayr, D., & Lester, R. (2018). Taxation and corporate risk-taking. The Accounting Review, 93(3), 237–266. https://doi.org/10.2308/accr-51872
- Laplante, S. K., Skaife, H. A., Swenson, L. A., & Wangerin, D. D. (2019). Limits of tax regulation: Evidence from strategic R&D classification and the R&D tax credit. Journal of Accounting and Public Policy, 38(2), 89–105. https://doi.org/10.1016/j.jaccpubpol.2019.02.003
- Lassila, D. R., & Smith, L. M. (1997). Tax complexity and compliance costs of U.S. multinational corporations. Advances in International Accounting, 10(1), 207–237. https://ssrn.com/abstract=247726
- Law, K. S., & Wong, C.-S. (1999). Multidimensional constructs in structural equation analysis: An illustration using the job perception and job satisfaction constructs. Journal of Management, 25(2), 143–160. https://doi.org/10.1177/014920639902500202
- Lawless, M. (2013). Do complicated tax systems prevent foreign direct investments? Economica, 80(317), 1–22. https://doi.org/10.1111/j.1468-0335.2012.00934.x
- Lignier, P., Evans, C., & Tran-Nam, B. (2014). Tangled up in tape: The continuing tax compliance plight of the small and medium enterprise business sector. Australian Tax Forum, 29(2), 217–247. doi: 10.2139/ssrn.2479153
- Lin, K. Z., Mills, L. F., Zhang, F., & Li, Y. (2018). Do political connections weaken tax enforcement effectiveness? Contemporary Accounting Research, 35(4), 1941–1972. https://doi.org/10.1111/1911-3846.12360
- Liu, Y., & Feng, H. (2015). Tax structure and corruption: Cross-country evidence. Public Choice, 162(1), 57–78. https://doi.org/10.1007/s11127-014-0194-y
- Long, S. B., & Swingen, J. A. (1987). An approach to the measurement of tax law complexity. Journal of the American Taxation Association, 8(2), 22–36.
- Machado, C., & Utimati, A. C. (2017, September 25). The challenges of tax compliance in Brazil. International Tax Review. https://www.internationaltaxreview.com/Article/3753790/The-challenges-of-tax-compliance-in-Brazil.html?ArticleId=3753790
- Markle, K. (2016). A comparison of the tax-motivated income shifting of multinationals in territorial and worldwide countries. Contemporary Accounting Research, 33(1), 7–43. https://doi.org/10.1111/1911-3846.12148
- Martindale, B. C., Koch, B. C., & Karlinsky, S. S. (1992). Tax law complexity: The impact of style. Journal of Business Communication, 29(4), 383–400. https://doi.org/10.1177/002194369202900405
- McCaffery, E. J. (1990). The holy grail of tax simplification. Wisconsin Law Review, 71(5), 1267–1322. https://ssrn.com/abstract=3683934
- McKerchar, M. (2005). The impact of income tax complexity on practitioners in Australia. Australian Tax Forum, 20(4), 529–554.
- McKerchar, M., Ingraham, L. R., & Karlinsky, S. (2005). Tax complexity and small business: A comparison of the perceptions of tax agents in the United States and Australia. Journal of Australian Taxation, 8(2), 289–327.
- Medina, L., & Schneider, F. (2018). Shadow economies around the world: What did we learn over the last 20 years? (IMF Working Paper No. 18/17). International Monetary Fund. https://www.imf.org/en/Publications/WP/Issues/2018/01/25/Shadow-Economies-Around-the-World-What-Did-We-Learn-Over-the-Last-20-Years-45583
- Mescall, D., & Klassen, K. J. (2018). How does transfer pricing risk affect premiums in cross-border mergers and acquisitions? Contemporary Accounting Research, 35(2), 830–865. https://doi.org/10.1111/1911-3846.12397
- Milliron, V. C. (1985). A behavioral study of the meaning and influence of tax complexity. Journal of Accounting Research, 23(2), 794–816. https://doi.org/10.2307/2490838
- Moody, S. J., Warcholik, W. P., & Hodge, S. A. (2005). The rising cost of complying with the federal income tax (Special Report No. 138). Tax Foundation. https://files.taxfoundation.org/legacy/docs/sr138.pdf
- Müller, C., & Voget, J. (2012). Tax complexity and foreign direct investment (Working Paper). https://ssrn.com/abstract=3051912
- Neck, R., Wächter, J. U., & Schneider, F. (2012). Tax avoidance versus tax evasion: On some determinants of the shadow economy. International Tax and Public Finance, 19(1), 104–117. https://doi.org/10.1007/s10797-011-9197-5
- Nicoletti, G., & Pryor, F. L. (2006). Subjective and objective measures of governmental regulations in OECD nations. Journal of Economic Behavior & Organization, 59(3), 433–449. https://doi.org/10.1016/j.jebo.2004.05.003
- Niemann, R. (2011). The impact of tax uncertainty on irreversible investment. Review of Managerial Science, 5(1), 1–17. https://doi.org/10.1007/s11846-010-0042-5
- Office of Tax Simplification (OTS). (2012). The office of tax simplification complexity index. https://assets.publishing.service.gov.uk/government/uploads/system/uploads/attachment_data/file/193493/ots_complexity_index_methodology_paper.pdf
- Office of Tax Simplification (OTS). (2015). The OTS complexity index. https://assets.publishing.service.gov.uk/government/uploads/system/uploads/attachment_data/file/438587/OTS_complexity_index_methodology_June_2015.pdf
- Office of Tax Simplification (OTS). (2017). The OTS complexity index. https://assets.publishing.service.gov.uk/government/uploads/system/uploads/attachment_data/file/603479/OTS__complexity_index_paper_2017.pdf
- Organisation for Economic Co-operation and Development (OECD). (2001). Businesses’ views on red tape. OECD Publishing.
- Overesch, M., & Wamser, G. (2010). The effects of company taxation in EU accession countries on German FDI. Economics of Transition, 18(3), 429–457. https://doi.org/10.1111/j.1468-0351.2009.00385.x
- Pau, C., Sawyer, A., & Maples, A. (2007). Complexity of New Zealand’s tax laws: An empirical study. Australian Tax Forum, 22(1), 59–92.
- Peter, K. S., Buttrick, S., & Duncan, D. (2010). Global reform of personal income taxation, 1981–2005: Evidence from 189 countries. National Tax Journal, 63(3), 447–478. https://doi.org/10.17310/ntj.2010.3.03
- Petter, S., Straub, D., & Rai, A. (2007). Specifying formative constructs in information systems research. MIS Quarterly, 31(4), 623–656. https://doi.org/10.2307/25148814
- Pope, J., & Fayle, R. (1991). The compliance costs of public companies’ income taxation in Australia 1986/87: Empirical results. Australian Tax Forum, 8(4), 485–538.
- Porst, R. (2014). Fragebogen. Springer VS.
- Poschmann, F., Vaillancourt, F., & Fuss, J. (2019). Tax complexity in 2019: Can it be tamed? https://www.fraserinstitute.org/sites/default/files/tax-complexity-in-canada-2019.pdf
- PricewaterhouseCoopers (PwC), World Bank, & International Finance Corporation (IFC). (2017). Paying taxes 2018. https://www.pwc.com/payingtaxes
- Raffournier, B. (1995). The determinants of voluntary financial disclosure by Swiss listed companies. European Accounting Review, 4(2), 261–280. https://doi.org/10.1080/09638189500000016
- Richardson, G. (2006a). Determinants of tax evasion: A cross-country investigation. Journal of International Accounting, Auditing and Taxation, 15(2), 150–169. https://doi.org/10.1016/j.intaccaudtax.2006.08.005
- Richardson, G. (2006b). Taxation determinants of fiscal corruption: Evidence across countries. Journal of Financial Crime, 13(3), 323–338. https://doi.org/10.1108/13590790610678404
- Richardson, M., & Sawyer, A. (1998). Complexity in the expression of New Zealand’s tax laws: An empirical analysis. Australian Tax Forum, 14(3), 325–360.
- Rupert, T. J., Single, L. E., & Wright, A. M. (2003). The impact of floors and phase-outs on taxpayers’ decisions and understanding of marginal tax rates. Journal of the American Taxation Association, 25(1), 72–86. https://doi.org/10.2308/jata.2003.25.1.72
- Rupert, T. J., & Wright, A. M. (1998). The use of marginal tax rates in decision making: The impact of tax rate visibility. Journal of the American Taxation Association, 20(2), 83–99.
- Sandford, C. (1989). Die Kosten der Steuererhebung für Verwaltung und Steuerpflichtige. In International Fiscal Association (Ed.), Administrative and compliance costs of taxation (pp. 67–93). Kluwer.
- Saw, K., & Sawyer, A. (2010). Complexity of New Zealand’s income tax legislation: The final installment. Australian Tax Forum, 25(2), 213–244.
- Schanz, D., Dinkel, A., & Keller, S. (2017). Tax attractiveness and the location of German-controlled subsidiaries. Review of Managerial Science, 11(1), 251–297. https://doi.org/10.1007/s11846-016-0190-3
- Schanz, D., Keller, S., Dinkel, A., Fritz, J., & Grosselfinger, C. (2017). The tax attractiveness index: Methodology. https://www.tax-index.org/download/The_Tax_Attractiveness_Index_Methodology_2017_Nov_v1.1.pdf
- Shevlin, T., Shivakumar, L., & Urcan, O. (2019). Macroeconomic effects of corporate tax policy. Journal of Accounting and Economics, 68(1), 1–22. https://doi.org/10.1016/j.jacceco.2019.03.004
- Simmons, R. S. (2003). An empirical study of the impact of corporate taxation on the global allocation of foreign direct investment: A broad tax attractiveness index approach. Journal of International Accounting, Auditing and Taxation, 12(2), 105–120. https://doi.org/10.1016/j.intaccaudtax.2003.08.005
- Slemrod, J. (1989). Complexity, compliance costs, and tax evasion. In J. A. Roth & J. T. Scholz (Eds.), Taxpayer compliance (pp. 156–181). University of Pennsylvania Press.
- Slemrod, J. (2005). The etiology of tax complexity: Evidence from U.S. state income tax systems. Public Finance Review, 33(3), 279–299. https://doi.org/10.1177/1091142105275003
- Slemrod, J., & Blumenthal, M. (1996). The income tax compliance cost of big business. Public Finance Quarterly, 24(4), 411–438. https://doi.org/10.1177/109114219602400401
- Stantcheva, S. (2020). Understanding tax policy: How do people reason? http://www.nber.org/papers/w27699
- Tan, L. M., & Tower, G. (1992). Readability of tax laws: An empirical study in New Zealand. Australian Tax Forum, 9(3), 355–372.
- TMF Group. (2017). The financial complexity index 2017. https://www.tmf-group.com/en/news-insights/publications/2017/financial-complexity-index-2017/
- TMF Group. (2018). The financial complexity index 2018. https://www.tmf-group.com/en/news-insights/publications/2018/the-compliance-complexity-index/
- Tran-Nam, B., & Evans, C. (2014). Towards the development of a tax system complexity index. Fiscal Studies, 35(3), 341–370. https://doi.org/10.1111/j.1475-5890.2014.12033.x
- Tran-Nam, B., & Karlinsky, S. (2008). Small business tax law complexity in Australia. In M. Walpole & C. Evans (Eds.), Tax administration: Safe harbours and new horizons (pp. 321–348). Fiscal Publications.
- Tran-Nam, B., & Karlinsky, S. (2010). Small business tax law complexity in Australia: A further study. New Zealand Journal of Taxation Law and Policy, 16(2), 153–176.
- Weber, R. (2015). The effect of tax code complexity on entrepreneurship. The Journal of Private Enterprise, 30(2), 83–102.
- Weinstein Jr., P. (2014). The state tax complexity index: A new tool for tax reform and simplification (Policy Memo). Progressive Policy Institute. https://www.progressivepolicy.org/wp-content/uploads/2014/04/2014.04-Weinstein_The-State-Tax-Complexity-Index_A-New-Tool-For-Tax-Reform-and-Simplification1.pdf
- Whiting, J., Sherwood, J., & Jones, G. (2014). The OTS and its complexity index. In C. Evans, R. Krever, & P. Mellor (Eds.), Tax simplification (pp. 235–251). Kluwer Law International.
- Williams, B. M. (2018). Multinational tax incentives and offshored U.S. jobs. The Accounting Review, 93(5), 293–324. https://doi.org/10.2308/accr-52008