
Abstract
This paper explores the possibilities of employing machine learning (ML) methods and new data sources in management accounting (MA) research. A review of current accounting and related research reveals that ML methods in MA are still in their infancy. However, a review of recently published ML research from related fields reveals several new opportunities to utilize ML in MA research. We suggest that the most promising areas to employ ML methods in MA research lie in (1) the exploitation of the rich potential of various textual data sources; (2) the quantification of qualitative and unstructured data to create new measures; (3) the creation of better estimates and predictions; and (4) the use of explainable AI to interpret ML models in detail. ML methods can play a crucial role in MA research by creating, developing, and refining theories through induction and abduction, as well as by providing tools for interventionist studies.
1. Introduction
Over the past 15 years, artificial intelligence (AI) has substantially changed the world, and we are now witnessing the second digital revolution (Brynjolfsson & McAfee, Citation2014). Accumulating evidence and changing business practices indicate that this new digital revolution is sweeping across the globe, giving rise to the emerging worldview that it will profoundly and irrevocably change how societies function (Frey & Osborne, Citation2017). The current wave of digitalization—which includes the emergence of big data, machine learning (ML), and autonomous algorithms—is expected to radically change the existing business models and challenge the ways in which work is carried out in contemporary organizations, including, for example, strategic planning, managerial decision making, human resource management (HRM), organizational control, accounting, and data analytics (e.g. Auvinen et al., Citation2018; Shrestha et al., Citation2019). AI is not only seen as a tool but is also increasingly respected as an entity setting an agenda of its own (Gulbrandsen et al., Citation2019).
Businesses are increasingly looking for new ways to create value by using data. The increase in the amount of data, its growing importance, and the use of AI and especially ML techniques have had strong effects in many industries. ML is a sub-field of AI which aims to implement intelligent systems by learning from the data instead of using predefined rules (LeCun et al., Citation2015). Deep learning, an ML subfield, has significantly enhanced this learning process. Usually, deep learning models work very efficiently with raw data and there is no need for complicated feature engineering that needs expert knowledge. This feature of deep learning is behind many of the success stories of ML recently (LeCun et al., Citation2015). Thus, companies are prioritizing technological advancement with investments in AI/ML applications to create value with better customer service, improved operating performance, and increased revenue. Overall, the second digital revolution is reshaping entire business environments with far-reaching consequences for organizations’ business processes. This revolution is also expected to substantially change management accounting (MA) and MA professionals’ roles in their respective organizations (Appelbaum et al., Citation2017; Moll & Yigitbasioglu, Citation2019; Rikhardsson & Yigitbasioglu, Citation2018).
The expanded use of digitalization in different managerial processes has dramatically increased the type of data available. In addition to the non-financial and financial data of an organization’s business processes, examples of continuously collected individual-level data in organizations include personnel selection and assessment-related data, like psychological tests, selection interviews, and HRM data, like salary, performance evaluations, promotion records, sick leave reports, or employee turnover data. This dramatically increased data availability, analyzed with supervised and unsupervised ML methods, also provides many new research possibilities for MA researchers. Besides helping to process data from these novel sources, ML methods are well known to be particularly useful for exploiting large volumes of data more efficiently than traditional statistical methods (see, e.g. Storm et al., Citation2020). In addition, technological development (i.e. in the form of graphical processing units) has accelerated computer learning and ML methods. The ML research community, including both academics and practitioners, is intensively developing new tools and algorithms for users, which has made applying ML methods increasingly easier (LeCun et al., Citation2015).
However, relatively little is known about these changes and their effects on MA research regarding potential research agendas, new sets of data, new research methods, and even the use of certain theories and theoretical developments. The primary purpose of our research was to explore the possibilities of ML methods in MA research. We started by reviewing the current research in MA and related fields (e.g. financial accounting, finance, management, and economics). The review was not done systematically by collecting all articles with specific keywords. Instead, we extensively analyze the field of accounting, and from other fields, we selectively review the most important ML papers in top-tier academic journals. From accounting, we aim to cover ABS3-4* journals, and from other fields, mainly ABS4-4* with few exceptions, which we consider relevant from the methodological point-of-view. Our approach was mainly manual with support from some computational methods, such as latent Dirichlet allocation (LDA; Blei et al., Citation2003).
Not surprisingly, our review confirms Bertomeu’s (Citation2020) recent argument that ML methods in accounting are still in their infancy, which is even truer in the field of MA. According to our results, current research in accounting related to ML and AI has made progress mainly in the following three fields: (1) how AI will change the field of accounting and the development of the accounting profession, (2) textual analysis related to accounting data/reports, and (3) prediction methods. However, thus far, MA research has not exploited the rich possibilities that ML methods can offer. Nevertheless, the literature review reveals many possibilities for how MA research could utilize ML methods in research and advance theoretical development (Malmi & Granlund, Citation2009; Zimmerman, Citation2001). The most promising areas in which MA research could employ ML methods are the following: (1) exploitation of the rich potential of various textual analyses, (2) quantification of qualitative and unstructured data (e.g. text and images) to create new measures for existing and new research variables, (3) creation of better estimates and predictions, and (4) the use of explainable AI to interpret ML models in detail. In the following chapters, we discuss these possibilities in more detail. In the text, we refer to solutions for how these possibilities could be implemented using the Python programming language.Footnote1 However, many other data science environments, such as the R language, offer powerful libraries for ML and can be used instead of Python.
2. Textual Analysis
Textual analysis already has a long history in fields close to MA. However, textual analysis in MA has mainly been an unexplored area and an unused opportunity. In the past, this was probably due to the lack of suitable textual datasets and analysis methods. However, due to rapid developments in ML, like deep learning, computer-aided text analysis methods also improved significantly during the 2010s. Furthermore, new textual data sources relevant to MA research continue to emerge all the time. ML-based textual analysis techniques could be utilized to online sources, like social media data (e.g. Twitter, LinkedIn and Facebook), firm-specific news inflows, job advertisements, company web pages, financial and other media articles, analysts’ reports and research notes, earnings call transcripts, and mandatory filings and disclosures (e.g. 10-Ks, 10-Qs, 8-Ks, IPO prospectuses, etc.).
Similarly, these textual analysis methods can be used to analyze qualitative interview materials in MA research to complement more traditional approaches to qualitative analysis. Thanks to COVID-19, it seems that easily recorded remote interviews via Zoom, Teams, and other such tools have rapidly increased in popularity and become more accustomed to the interviewed people, such as managers and accountants. The transcripts of these interviews may further boost the turn toward ML-based analyses of data traditionally considered ‘qualitative.’ Moreover, companies are full of rich internal textual documents and transaction data related to revenues, costs, and performance measures that can be used in various predictive and prescriptive analyses to reveal and discover associations that provide grounds for new theoretical findings and theoretical development. If conducted in the spirit of interventionist research (Lukka & Suomala, Citation2014; i.e. providing these analyses and developed tools for the companies analyzed), they may also be useful and enhance the opportunities to gain better access to the case firms.
In particular, textual data from social media platforms have been popular in fields close to MA (for an extensive review, see Lei et al., Citation2019). Such information sources include Amazon, Twitter, different Internet bulletin boards, and crowdsourced earnings and economic estimates like Estimize. This literature suggests that the aggregation of information provided by many individuals often results in better knowledge than that afforded by any single group member or even experts (Bartov et al., Citation2018, p. 28). Specifically, employee reviews (e.g. Glassdoor.com) can reveal fundamental information about a firm (e.g. Green et al., Citation2019; Hales et al., Citation2018; Huang et al., Citation2015; Huang et al., Citation2020). These large social media datasets could also be informative for MA researchers. Crowdsourced and voluntary employer reviews on social media platforms also function as a type of involuntary disclosure information channel from a management perspective. For example, Hales et al. (Citation2018) and Miller and Skinner (Citation2015) suggested that firms are losing some control over their information environments because of the advent of social media.
2.1. Conventional Textual Analysis Methods
When analyzing textual data, efficient representations of words play an important role in the process. Because textual data are very high-dimensional, they need to be compressed efficiently without losing too much information. Traditionally, one-hot encoding and bag-of-words models have been used to represent words and documents, respectively. One-hot encoding means that words are represented with dictionary-length vectors, where a single element representing a specific word in a dictionary is one, while all others are zero. The bag-of-words representations of documents are dictionary-length vectors, where each element reports the number of occurrences of a specific word in a document. Therefore, these representation methods just ‘count words’ and ignore all other information from the original documents, such as semantic and syntactic content. However, there are many ML algorithms that can also draw interesting information from these simple representations, including topic modeling, k-means clustering, and community detection methods for networks (see, e.g. Storm et al., Citation2020; Varian, Citation2014).
Textual analysis employing traditional word representations already has a long history in accounting research and related fields. A thorough review of the current state of this line of research is presented in El-Haj et al. (Citation2019), Fisher et al. (Citation2016), Li (Citation2010), and Loughran and Mcdonald (Citation2016). Compared to manual analysis, researchers have identified the benefits of computational linguistics as entailing generalizability, replicability, objectivity, cost efficiency, and statistical power due to larger samples (Li, Citation2010). We think that many of these traditional methods are still important in MA research, especially since MA has applied them much less than related fields.
An example of this line of study is the work of Loughran and Mcdonald (Citation2011), who created word lists specifically for financial communication to measure tones of positivity, negativity, and uncertainty, as well as litigious, strong, and weak modal tones. Earlier research used mostly general word lists for tones, such as the Harvard General Inquirer and DICTION (Hart, Citation2001) word lists. Henry (Citation2008), Li (Citation2010), and Loughran and Mcdonald (Citation2011) argue that these general word lists are suboptimal for special discourse used by companies. For example, the word crude is listed as a negative word in these general word lists, which creates a negative bias regarding the tone of the disclosure of oil companies. Miller (Citation2017) provides a good overview of these dangers. In response to Dyer et al. (Citation2017), the focus of his discussion is on LDA, but it also includes many caveats that researchers need to take into account in the entire text analysis pipeline. Specifically, Miller points out that many preprocessing choices, starting from the choice of a corpus, affect the text analysis results. Thus, although the ML method applied to textual data might itself be objective and free of bias, the end results can still be significantly affected by the design choices made by the researcher.
Other notable research using a word list approach is that of Allee and Deangelis (Citation2015), who measured the tone dispersion in conference call narratives using the Loughran and Mcdonald’s (Citation2011) word lists, and Davis and Tama-Sweet (Citation2012), who used the same word lists to compare the tone of earnings releases and the Management’s Discussion and Analysis (MD&A) section included in firms’ 10-K filings. Feldman et al. (Citation2010) used word lists to measure the tone change in the MD&A section compared to prior filings of a company and reported results using both Loughran and McDonald’s word lists and Harvard’s General Inquirer. They found that the General Inquirer gave a more positive tone to the texts in their corpus, and its differential tone signal had greater associations with future return drift than either the positive or negative tone alone. Thus, there are significant differences in the results when using word lists from different sources, and researchers should carefully test these word-count-based measures. Although the word-count examples above are from other fields close to MA, their methodological caveats are also highly relevant for MA research. For example, the word-count approach could be used to measure the tone of texts relevant to MA or build measures for MA-relevant topics, like organizational control.
Topic modeling, especially LDA, has been a relatively popular tool in fields close to MA. LDA assumes that all documents in a corpus include a predefined number of topics, and the weights of these topics vary across documents. The topics themselves are considered distributions of the words in a dictionary (i.e. the frequency/probability of the words varies between them). Traditional LDA uses static topics, but with a corpus large enough, the evolution of themes can be analyzed with dynamic LDA (Blei & Lafferty, Citation2006), which is rarely used in research on accounting and related fields. However, traditional LDA can be used to compare topic weights at different time points for static topics.
A large part of the current research in relevant fields uses topic models for companies’ financial disclosures, a potential source of information also for MA research. For example, Dyer et al. (Citation2017) used LDA to analyze the evolution of 10-K textual disclosures over 1993–2006, Ball et al. (Citation2015) implemented a similar analysis to describe the nature of business change, and Brown et al. (Citation2020b) used the topics of an LDA model to detect financial misreporting. Another example is Huang et al. (Citation2018), who employed LDA to compare the thematic content of analyst reports issued after earnings conference calls to the calls themselves. For MA, topic modeling utilizing 10-K textual disclosures can offer new research opportunities, for example, related to company strategy and organizational control. In addition, corporate social responsibility (CSR) reports might offer another rich textual data source for MA researchers to employ ML methods. There exist several possibilities for studying the current topic of climate change and the role of MA, for example, by determining whether and how different companies report the use of various environmental controls or management incentives for environmental actions, and how these issues have developed over the last decade.
Topic models have also been popular in literature reviews, especially when the size of the corpus is such that manual review is impossible (see, e.g. Moro et al., Citation2015; Elmsili & Outtaj, Citation2018). Specifically, they can be used to infer the latent topics discussed in academic journals. However, topic models are not just useful literature review tools for large corpora. Garanina et al. (Citation2021) employed a hybrid approach for a small collection of 150 articles, in which LDA was combined with manual analysis to review blockchain literature in accounting. In the initial step, they used LDA to infer broad themes from the papers, and in the next step, they manually examined the most important themes to fine-tune their topic and understand their content in more detail. These ML-led literature reviews open numerous possibilities for MA. LDA can be used, for example, (1) to review all the studies in a specific MA journal/journals to study the appearance of different research topics and their development, or (2) to study specific research areas more closely; for instance, researchers could focus on how research concerning the design and use of management control systems has developed during the past 20 years.
Although LDA is a very popular tool for inferring latent themes from a collection of texts, it is not the only ML tool suitable for that purpose. Another option is latent semantic analysis (LSA), which identifies thematic similarities between documents using the singular value decomposition of a word-document matrix. An example from related fields employing LSA is the work of Iaria et al. (Citation2018), who used it to compare the similarity of research articles published inside one country and abroad to estimate the level of international scientific cooperation. A recent example from accounting is Zengul et al. (Citation2021), who used LSA to analyze research trends in the top 30 accounting journals over the last 20 years. Their corpus consisted of 16,449 journal abstracts, making it an excellent fit for an ML-led literature review.
Another popular topic modeling tool is the structural topic model (STM), which allows for the addition of external variables to the model (Roberts et al., Citation2019). Thus, it is somewhat like a dynamic LDA model, which adds time as an additional variable. However, the STM allows nonlinear modeling of the associations between the topics and any external variable. Although it is a very popular topic modeling tool in many disciplines, it has not yet found its way to disciplines close to MA, let alone MA itself.
Researchers should take some caution when applying topic models to research questions, since the methods are not as objective and free of bias as one might first think. Miller (Citation2017) gives a good overview of how preprocessing and design choices affect the end results of an LDA model. A researcher needs to decide beforehand the number of topics assumed to be present in a corpus. Also, the interpretation of the results is very subjective, as the topics of a model are usually identified using the most important words and most representative documents.
2.2. Typical Workflow of ML-Led Textual Analysis Utilizing Traditional Word Representations2
MostFootnote2 topic-modeling algorithms use simple bag-of-words representations, and in our view, ML-led literature reviews employing these algorithms are a highly promising application area for MA research. We proceed by describing the process of implementing an ML-led textual analysis that uses traditional word representations. The text analysis workflow includes many preprocessing steps, which are illustrated in . The process often starts by transforming textual information into a pure text format. For example, portable document format (PDF) is often used for academic articles, and the process starts by transforming these into pure text format using a suitable library, such as the PDFMiner library (https://pypi.org/project/pdfminer/) in Python.Footnote3 As most of these algorithms need only a collection of meaningful words and their frequencies from textual data, the following steps aim to remove all unnecessary information.Footnote4 The numbers and words that are too short (e.g. less than two characters) or too long (e.g. more than 15 characters) are removed. Moreover, stopwords (i.e. words common in the English language, but which do not contain any relevant information) should be removed. Popular NLP libraries, like NLTK in Python (http://www.nltk.org) include comprehensive stopword lists for different languages. Also, a specific corpus often has useless words that are removed from the text by adding them to the stopword list. For example, typical useless words in academic articles are journal and references.
Figure 1. Preprocessing pipeline for textual analysis using traditional word representation approaches
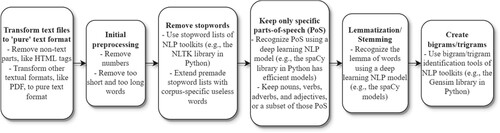
The cleaning process can be improved by identifying parts of speech (PoS) from the text.Footnote5 As mentioned, these algorithms work more reliably if the corpus is cleaned as much as possible of all unnecessary words. Therefore, it is common for only a specific PoS to be kept. Many NLP libraries in Python and other data analytics environments include tools to identify PoS. One option is the English-large model in the spaCy library (www.spacy.io). For topic modeling, often just nouns are kept. The preprocessing continues by stemming or lemmatizing the words. Previous research in accounting and related fields has mostly used stemming, which means reducing the inflected forms of words to their ‘stem’ form. Stemming is a simple trimming approach, and the resulting word is not necessarily a ‘real’ word. For example, the Porter algorithm (Porter, Citation1980) reduces the words argue, argued, argues, and arguing to the stem argu. Lemmatization aims to be more sophisticated and groups all the inflected forms into their ‘dictionary’ form. It identifies a word’s PoS and its meaning in a sentence (or a paragraph) to transform it to its base form correctly. Therefore, lemmatization is much more challenging than stemming and requires more sophisticated language models, such as deep learning models, to work. The English-large model from the spaCy library can also be used in this case.
The final step in the process is the creation of bigrams/trigrams.Footnote6 This means connecting words that very often appear together, such as financial and statement. Traditional bigram/trigram-forming algorithms compare the frequency with which two/three words are together to the frequency they appear separated. If they appear ‘often enough’ together, they are connected as bigrams/trigrams. How often is enough needs to be specified by the researcher, and this is the most challenging part of bigram/trigram creation. It is difficult to fine-tune parameters so that only meaningful bigrams/trigrams are created, and important ones are not missed. Bigram/trigram creation algorithms are included in many libraries. In Python, one option is to use the Gensim library (Rehurek & Sojka, Citation2010). Instead of creating bigrams/trigrams, an alternative approach would be to identify ‘noun chunks,’ which we will discuss more in Section 3.3.
After these steps, the corpus should be ready to be utilized in many text analysis algorithms. If the aim is to do topic modeling, usually the only parameter that needs to be decided is the number of topics. There are other parameters, like those that control the initial distribution of words and topics, but usually, these values can be left to their defaults. For example, the Gensim library (Rehurek & Sojka, Citation2010) allows for the use of an ‘auto’-setting for these parameters. However, if the plan is to use more sophisticated topic modeling tools, such as the STM, then a decision needs to be made on what external variables are needed.
2.3. Advanced Word Representations and Neural Networks
Both linguists and researchers in business disciplines have begun to acknowledge the limitations of word count and bag-of-words approaches (El-Haj et al., Citation2019). The key problem is that MA and related research need word representations that also contain other information from the narrative, not just the frequency of words. Mikolov et al. (Citation2013a, Citation2013b) introduced a much more efficient representation of words (and phrases), called word embeddings. The word2vec tool they proposed takes a text corpus as input, constructs a dictionary from it, and then learns, using a special neural network architecture, an efficient low-dimensional vector representation of words. The network learns a representation of words that is most efficient at predicting the central word with surrounding words (e.g. continuous bag-of-words model, or CBOW) or predicting the surrounding words with the central word (e.g. skip-gram). In the final vector space of words, semantically similar words are close to each other. Thus, words like profit and earnings are close to each other in that space. The word embeddings representation approach is a major improvement to text analysis methods because it allows for the semantics of words to be quantified. This representation retains much more information from the corpus used to train the model than the bag-of-words approach, such as the flow of discussion in a way similar to how humans would understand the text.
Researchers in fields related to MA have begun to acknowledge the power of these new word representation methods. For example, Li et al. (Citation2020) used word embeddings to measure company culture, while Brown et al. (Citation2021) identified forward-looking statements from financial disclosure using word embeddings. Bhatia et al. (Citation2021) presented a novel way to use a large-scale word embedding model to predict leadership perceptions, a highly relevant approach also for MA research. In a similar vein, Harrison et al. (Citation2019) used a word embedding model trained with CEO transcripts to measure CEO personality. To the best of our knowledge, Mauritz et al.’s (Citation2021) is the first study in an accounting journal that uses word embeddings; in this case, they did so to study the role of individual audit partners in narrative disclosures.
The methodological approach of these examples from related fields could be easily implemented for research questions relevant to MA. For example, this approach can be used as a substitute for collecting survey data and solving many problems associated with the survey study approach by expanding the size, range, speed, and quality of the accessible data. Furthermore, it can complement the survey research method, for example, by introducing new variables in the research model that would be difficult to reach or measure using survey methods. The above-mentioned examples from management research are valuable because survey responses from CEO/CFO positions are difficult to obtain. Moreover, the resulting representations can be used in many MA research problems to create new measures for existing research variables or to generate new research variables. We provide an example of using a word embedding model to build new measures in Section 3.3.
2.4. BERT, GPT-3, and Other Transformer-based Models
The work of Mikolov et al. (Citation2013a, Citation2013b) ignited a revolution in NLP, and the current state-of-the-art models extend this approach using neural networks with transformer architecture (Vaswani et al., Citation2017), which further improves word representation and understanding of textual data. BERT (Bidirectional Encoder Representations from Transformers; Devlin et al., Citation2019) and GPT-3 (Generative Pre-trained Transformer 3; Brown et al., Citation2020a) are famous language models that use this architecture. They are very large models (in terms of the number of parameters) and use vast amounts of data in training. For example, GPT-3 uses Common Crawl (www.commoncrawl.org) as one of the data sources, and the total number of tokens (words) in the training data is almost 500 billion. The billions of parameters in these pre-trained models contain information from numerous aspects of human activities, many of which are relevant to MA research. For example, topic analysis is much more accurate with these models when words under the same topic are also semantically similar, and the first implementations of BERT-based topic models have already started to emerge (github.com/MaartenGr/BERTopic; Angelov, Citation2020).
Moreover, these models can adapt to specific tasks using very small training sets. Brown et al. (Citation2020a) demonstrated how GPT-3 is able to adapt with a few examples typically 10–100 observations (Brown et al., Citation2020a) to tasks that require on-the-fly reasoning or domain adaptation. This is beneficial for MA research, as the datasets available for topics of interest to MA research are often very small. In fact, only a few observations from a specific MA research problem may provide enough guidance for these models to ‘activate’ the correct parameters from the billions available in the models. This, in turn, allows the models to work efficiently for the current MA research problem in complementing traditional qualitative analysis by reducing, validating, and, perhaps in the future, even interpreting the qualitative data. In reducing data, the analysis may help find the essential parts of the data, and in the validation, it may take a more objective look at the total set of qualitative data by revealing unjustified and loose interpretations (Lukka & Modell, Citation2010). We admit that in making interpretations, human judgment and sensitivity may be the most crucial parts of such an art, but these models may nevertheless at least support the interpretative process and learn to do it better over time.
Currently, BERT is freely available and easy to implement in research using, for example, the Tensorflow library (www.tensorflow.org). GPT-3 is not freely available, and its use in academic research is currently limited. However, EuletherAI has implemented an open-source version of the GPT-3 architecture, GPT-neo, which is freely available (https://www.eleuther.ai/projects/gpt-neo/). To the best of our knowledge, there is very little research in disciplines close to MA that uses transformer-based models. Bingler et al. (Citation2021) used ClimateBert, a variant of BERT designed explicitly for environmental texts, to analyze corporate climate risk disclosures. Huang et al. (Citation2022) introduced FinBERT, a language model based on BERT, for NLP tasks in the financial domain and demonstrated its usability for sentiment analysis. Although these examples are from other fields, they illustrate the importance of domain-specific models and showcase the possibilities in MA research for using language models fine-tuned to domains of interest.
An example that showcases the dangers of general language models is the word ‘cost’. We demonstrate this with a simple example, where we calculate the sentiment of the sentence ‘The cost structure of our business.’ using two models: BERT, which is trained with general language, and FinBERT, which is fine-tuned using financial news data (Reuters).Footnote7 The BERT model estimates the sentence to be negative with a confidence score of 0.769 (domain 0-1), while FinBERT estimates the sentence to be neutral with a confidence score of 0.932. Thus, the importance of using domain-specific language models in applications, which has already been discussed by Loughran and Mcdonald (Citation2011) concerning much simpler computational linguistic tools, is also relevant for recent deep learning models. Moreover, the importance of context should not be underestimated as the tone of text also depends on the disclosure medium used (e.g. earnings call vs. 10-K). However, as mentioned previously, what is promising for MA research is that these models do not need to be built from the ground up using specialized textual data. It is sufficient to fine-tune pre-trained models with domain-specific texts or even to use just a few examples with models like GPT-3.
3. Machine Learning for Creating New Measures from Unstructured Data
ML has been particularly useful when dealing with unstructured data that are too complex or high-dimensional for standard estimation methods, including language and image information that we traditionally had not even thought of as workable data, let alone something that could be included in a regression. This feature offers new possibilities for studying traditional MA research questions using new kinds of data with the help of ML methods. For example, MA researchers can employ unsupervised ML to make sense of complex and high-dimensional data, such as text, images, and video; find clusters of similar observations in terms of their covariates; and then define a measure for these features using the ML model.
Research problems in MA deal mostly with the internal functions of companies, and it is especially difficult for academics to acquire quantitative data from those functions. Therefore, scholars are continuously searching for new ‘signal sources’ to acquire information about these internal functions. ML offers tools for building quantitative measures from alternative unstructured data sources. ML methods can handle large datasets, compress their size (dimensionality reduction or e.g. LDA in text analysis), and quantify them (turn the found features into values). For example, the text analysis methods of the previous chapter can be trained to go ‘one step further’ to calculate numerical values from the textual information. This approach has already been popularized using the traditional word count approach (Loughran & Mcdonald, Citation2016). However, advancements in deep learning NLP methods open up a whole new level of possibilities for this methodological approach.
ML allows for the use of many other unstructured data sources for constructing measures. Deep learning, based on neural networks, can be designed to calculate many different measures of interest to MA research from images, videos, speeches, and similar sources by adding one additional layer to the neural network. Initial layers of a neural network, specialized for different unstructured data types, extract relevant features from the data. For creating the measure, the neural network needs an additional feed-forward layer that quantifies the found features. If the aim is to create a numeric measure, the pure output value from that layer can be used. If the aim is to create a classification measure, a logistic activation function can be added to the layer. The only challenge in this approach is the need for training data to fine-tune the layer to respond correctly to the MA measure. For more details on the different architectures used in deep learning, see LeCun et al. (Citation2015).
3.1. Creating Measures from Textual Data
ML-based textual analysis tools might be particularly useful as intermediate steps in empirical work in MA. They can be used as a data-driven means of creating either outcome variables or explanatory variables, depending on the research context. This approach of building measures from text using deep learning models has been recently utilized in related research to quantify the definition of corporate culture (Li et al., Citation2020; Grennan, Citation2019) and to construct a new text-based measure of innovation (Bellstam et al., Citation2021). More specifically, Bellstam et al. (Citation2021) used LDA to infer topics from the texts of 665,714 analyst reports of 703 firms in the S&P 500. Then, they calculated Kullback–Leibler divergence of each topic from the language used in a mainstream textbook on innovation and selected the topic with the lowest divergence from the textbook language as a measure of corporate innovation. Their text-based measure provides a useful description of innovation for firms with and without patenting and research and development (R&D). Thus, LDA does not need to be limited to a descriptive analysis of topics and their evolution. Topics can also be used to define new measures, which can subsequently be used as variables, as in a regression model.
Although these promising examples of recent developments are mostly from other fields, they can correspondingly be implemented in MA research. For example, MA researchers could build new measures to complement survey research or to find entirely new ways to measure outcome variables, such as innovation. Furthermore, a similar approach could be employed to define measures related to company strategy and organizational control. In section 3.3, we demonstrate how a word embedding model can be used to create new measures from textual sources.
3.2. Creating Measures from Other Than Textual Sources
Although textual data is the most promising unstructured data source for MA research, there are also other promising sources. One recent approach is to use ML models in face detection and to study different facial appearance features in individuals, including trustworthiness, beauty, and masculinity. MA research has a strong tradition of using psychological theories in behavioral research settings, and the psychology and neuroscience literature argues that people may efficiently judge the facial appearance of another individual and rapidly develop perceptions of others’ facial trustworthiness (e.g. Mathur & Reichling, Citation2016; Todorov et al., Citation2009). For example, previous research has used ML to study the effects of facial trustworthiness across various business settings (Duan et al., Citation2020; Hsieh et al., Citation2020). An interesting example of this line of research is Choudhury et al. (Citation2019), who combined the topical content and sentiment of CEO oral communication with CEOs’ facial expressions to evaluate their different oral communication styles.
The study by Hsieh et al. (Citation2020) employed an ML-based face detection algorithm to investigate whether and how auditors incorporate client firm executives’ facial trustworthiness into their audit pricing decisions. Similarly, Duan et al. (Citation2020) examined whether entrepreneurs’ appearance-based trustworthiness (i.e. facial trustworthiness) affects the success of crowdfunding campaigns, while Ahmed et al. (Citation2020) analyzed the effect of facial attractiveness on the compensation of bank CEOs. In their approach, facial attractiveness is evaluated by a sophisticated deep learning model, and they demonstrate with specific examples how their model is able to generalize the human perception of beauty and measure it objectively. These ML-based face detection models can offer new innovative approaches to study individual behaviors and the role of facial appearance in the MA context. For example, prior research by Rouwelaar et al. (Citation2020) has studied whether management accountants (MAs) interpersonal, conceptual, and technical skills are associated with MAs perceptions that they influence management’s decision-making and effectiveness in this role. Future research can incorporate MAs facial appearance to study, e.g. whether trustworthiness, masculinity, and attractiveness affect how much influence MAs have on management’s decision making.
Another unstructured data source for new measures is satellite data. Although previous research has mainly used satellite data for macro-level economic forecasting (Donaldson & Storeygard, Citation2016), technological advances have made it possible to use the data to observe individual companies. For example, individual factories can be observed to estimate their emissions and output volumes (Scheibenreif et al., Citation2021). Moreover, on-time forecasts of retail store performance can be estimated using parking space occupancy outside stores (Kang et al., Citation2021; Katona et al., Citation2018). A similar analysis could also be used to estimate a company’s environmental performance in ESG evaluation. For example, in MA research, this approach could be employed to objectively evaluate the efficiency of eco-control systems in companies.
3.3. Using a Word Embedding Model to Build new Measures8
InFootnote8 this example, we draw insights from Li et al. (Citation2020). However, we go one step further by showing that this approach does not necessarily need to rely so heavily on the handmade dictionaries of previous research. Instead, we show how the word embedding approach alone can be used to measure things from text. outlines the steps we used to create our model. For our training data, we used 162,155 10-K forms from the Edgar database (www.edgar.org). The preprocessing pipeline starts by cleaning up all the unnecessary information from the 10-K formsFootnote9, such as HTML tags, markup language, and XML parts. In the next step, we removed the numbers and replaced them with a specific symbol (#). It should be noted that we did not just remove numbers; similarly, we did not remove short and long words. This is because we did not want to break the ‘flow of the narrative,’ which is what we tried to capture with our word embeddings model. For the same reason, we did not remove any stopwords.
Figure 2. Processing pipeline of the word embedding model creation. Nothing is removed from the text to preserve the flow of the narrative. For example, numbers are replaced with symbols, but not removed
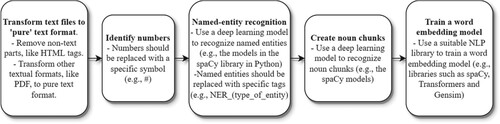
Next, we used a pre-trained deep learning model from the spaCy library (www.spacy.io) to recognize named entities from the text.Footnote10 Different named entities were replaced with the text ner_(type of entity) (again, we did not want to break the flow of the narrative). We used the same model to recognize noun chunks from the text.Footnote11 Noun chunks are phrases that include nouns and words (adjectives etc.) related to those nouns. This is an alternative way to infer phrases from the text, and in our opinion, it is much more reliable than the bigram approach, as words are connected together based on their true meaning (PoS), not on how often they appear together.
In the final step, we used a neural network model (word2vec by Mikolov et al., Citation2013a; also available as a Python library) to learn the vector representations for the dictionary words found in the 10-K forms.Footnote12 The word2vec model learns representations that are optimal for predicting the surrounding words. The natural consequence of this learning approach is that semantically similar words have similar vector representations (i.e. they are close to each other in the vector space).
Drawing upon Li et al.’s (Citation2020) approach, we aimed to estimate how restructuring and growth strategy discussions are reflected in a specific report. Although these topics do not belong to the core MA research, they could be a part of relevant MA research as measures for management decisions. Thus, with this example we want to show how we can build new measures from alternative unstructured data sources, not how these tools could be used for analyzing company disclosure. Furthermore, this example is easy to replicate for building measures more at the core of MA research. For example, using suitable keywords, this approach could be used to measure how enabling/coercive organizational control is. We started with these two phrases and used the word embedding model to infer the closest words to those phrases (i.e. words that are used in a similar context in 10-K forms). provides the details of how we constructed the dictionaries. The closest phrases for restructuring were rationalization, downsizing, resizing, plant closures, and, obviously, the phrase itself. These phrases were used as initial keywords for restructuring. Likewise, the closest phrases for growth strategy were organic growth, our path, our growth plan, our strategic plan, and the phrase itself.
Figure 3. Constructing the dictionaries to build measures for ‘restructuring' and ‘growth strategy'. In the second phase, the five closest phrases to the initial guess phrases (restructuring/growth strategy) in the word embeddings space were inferred. In the final phase, 100 phrases closest to the centroid of the five words in the second phase were selected as dictionary phrases to measure restructuring/growth strategy
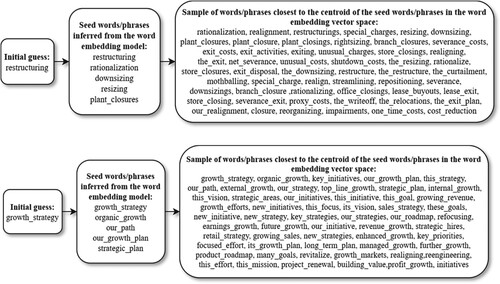
Next, we calculated the centroid of the initial keywords and then inferred from the model words closest to this centroid (i.e. words that were semantically most like the keywords). Because the word embedding model was trained using the 10-K forms, the collected words were used in a similar context especially in annual reports. It should also be noted that this approach does not necessarily require any subjective decision from the researcher as to which words should be included in a specific dictionary. We did not necessarily need to rely on the handmade dictionaries of previous research in the same way that Li et al. (Citation2020) used the words of Guiso et al. (Citation2015) to measure corporate culture. Instead, we were able to extend the initial keyword list with semantically similar words using the word embedding model alone.
We used the 100 most semantically similar phrases in our dictionaries for restructuring and growth strategy. To finalize building the measure, we counted the occurrences of words/phrases in the complete corpus of 162,155 10-K documents and divided these by the total number of words in a document.Footnote13 The manual analysis verifies the applicability of the approach. The highest value for the restructuring measure was from Spectrum Brands, Inc. in 2009. The company was in the middle of restructuring its US operations and was aiming to sell its home and garden business in the US. Also notable is that the top three 10-K documents with the highest restructuring values were from 2008–2010 (i.e. in the middle of the global financial crisis). The 10-K form with the highest value for the growth_strategy measure was that of Victory Capital Holdings, Inc., from 2018. In the disclosure, the company discussed its strong growth during the last five years and its growth strategy for the upcoming years. Thus, this example demonstrates how we can use ML to build measures from unstructured data to estimate, for example, management actions related to restructuring and growth strategy.
A few things should be kept in mind when building measures from a text. First, the relative frequency of words is not the only way to build the measure. Another popular approach is to use the term frequency – inverse document frequency (TF/IDF) weighting, which is often viewed as a more reliable measure of the importance of a specific word. Second, the sentiment of the language is important. For example, for the growth strategy discussion, it is important to know whether it is discussed in a positive or negative tone. However, as deep learning models can analyze the text sentence by sentence, it should be relatively easy to use them to estimate the sentiment of sentences discussing a specific topic, such as growth strategies. This adds a whole new layer to the analysis. As explained above, we can identify topics of interest to MA research, specify a metric for it, and add a sentiment to that metric. For example, we could separate companies that discuss a specific MA topic in a positive/negative tone and those that discuss them the most. And as mentioned, instead of sentiment, we could identify, for example, topics related to organizational control and then measure how enabling/coercive the control is. Third, is a discussion reviewing the past or the future is an interesting aspect. An example of this was the 2018 annual report of Victory Capital Holdings mentioned earlier, which discussed growth strategy from both perspectives. Naturally, separating these two cases would be valuable for many MA research questions. With a similar approach to connecting tone to topics, it should be relatively easy to identify whether a specific topic is discussed in the past or future tense, mainly because these improved language models use deep learning and recognize the PoS from a narrative.
4. Prediction Methods for MA—A Different Research Approach
Although methodological advancements play an important role in the success of ML, the sharp rise in the availability of new data sources due to digitalization also strongly influences the success. This is also true for MA, and many new data sources have become available that are relevant to MA research. MA research has a strong tradition of using different performance evaluation datasets that can be complemented in various ways. For example, digital performance monitoring (i.e. the use of advanced tools to observe, record, and analyze information that directly or indirectly relates to employee job performance; Bhave, Citation2014) is commonly used in many organizations (Doornenbal et al., Citation2021; Ravid et al., Citation2020), with examples including call, e-mail, and Internet usage monitoring, social media observation, and wearable sensors. Such data can be analyzed using ML tools to predict, for instance, employee personality or performance (e.g. Doornenbal et al., Citation2021; Kosinski et al., Citation2014; Kozlowski et al., Citation2016). In MA research, which focuses on increasing our understanding of relationships between such variables as leaders/employees in an MA context, ML methods can be used to study social media website data (e.g. Facebook or Twitter) to predict personality profiles, which can offer several new research possibilities compared to the more traditional survey approach.
In these kinds of roles, ML methods can be used for discovery-driven (e.g. inductive or abductive) research. Here, ML algorithms can reveal complex patterns not specified a priori. Rather than deductively testing a model specified ex ante, as in traditional econometric analysis, ML algorithms can inductively build a model from the data to reveal patterns (Choudhury et al., Citation2021). In this way, ML methods can surprisingly bring quantitative empirical researchers closer to the tradition of qualitatively considered grounded theory, in which researchers identify patterns in the data to build theory based on them. ML methods can thus provide tools to generate new kinds of observations, which aids in the process of building theory in an inductive or abductive way, depending on the context (Choudhury et al., Citation2021; Eisenhardt, Citation1989; Glaser et al., Citation1968; Mantere & Ketokivi, Citation2013).
Thus, the predictive approach is essential, although research in MA has mainly focused on theory-driven explanatory modeling. The consensus among MA researchers has been that ‘theory comes first.’ However, while there are statistical methods designed to discover causality (Peters et al., Citation2017), research in MA and related fields uses mainly linear regression models that are associative and cannot give answers about causality. Furthermore, the idea that ML is just for prediction and linear regression models are better for explanatory modeling is misleading. For example, Lundberg et al. (Citation2020) documented in detail how the mismatch of simple linear models causes serious explanation problems and can generate completely erroneous estimates of the importance of covariates.
It has been said that theories in the social sciences, like MA research, are vaguer compared to those in the pure natural sciences (see, e.g. Malmi & Granlund, Citation2009; Zimmerman, Citation2001). In any case, research and theoretical development should also continuously advance in MA. The theoretical frameworks of MA deal with concepts in an ever-evolving environment of corporate management. They are, or should be, fine-tuned continuously, and MA scholars should embrace new theories, refine them, and test them alongside traditional theories (Choudhury et al., Citation2021; Keating, Citation1995; Lukka & Vinnari, Citation2014; Malmi & Granlund, Citation2009; Mantere & Ketokivi, Citation2013; Zimmerman, Citation2001).
Without any attempt to belittle the traditional inductive modes of theorizing, we see that the predictive modeling approach offers researchers specific tools to develop MA theory and support theorizing (Shmueli, Citation2010):
New large datasets contain complex patterns that are hard to hypothesize. Predictive modeling can help uncover potentially new causal mechanisms and lead to new theories and the fine-tuning of existing theories.
Predictive modeling can be used to compare the different operationalizations of theoretical constructs and to create completely new operationalizations.
Predictive modeling enables the assessment of the distance between theory and practice.
Predictive modeling can be used to compare competing theories by measuring their predictive power. Furthermore, the difference between the predictive power of predictive and explanatory models implies the level of maturity of the theory. An explanatory model that is very far from the predictive benchmark suggests that the theory could be developed significantly.
Thus, predictive modeling plays a crucial role in the empirical cycle that evolves from observations to theory (Mantere & Ketokivi, Citation2013) and to the testing of theories on new data (Zimmerman, Citation2001). New datasets have become available for MA research at an ever-increasing pace, and the accelerating speed of social and technological changes has altered the environments in which companies operate. This has also put pressure on existing theories, and ‘the consequence of neglecting to include predictive modeling and testing alongside explanatory modeling is losing the ability to test the relevance of existing theories and to discover new causal mechanisms’ (Shmueli, Citation2010).
ML algorithms are best suited for problems in which the set of variables, their interactions, and the mapping onto outcomes are not theoretically obvious. In such cases, the relationship between the dependent and independent variables need not be monotonic, and the interactions between variables are a priori unknown (Bertomeu et al., Citation2021). Predictive modeling is a particularly useful research approach when no strong theoretical or empirical evidence points to one variable’s importance over another. Using an ML approach, the researcher lets the data guide their understanding of the importance of various variables and their interrelations, which are interpreted in the context of the theory. ML methods offer powerful predictive tools for discovering the functional forms between variables from the data. This is crucial in fine-tuning theories, as the operationalization of a theory should represent the theory as closely as possible. Thus, by design, they fit excellently to the step of empirical research that aims to fine-tune existing theories and discover new theories; in other words, ML methods ‘set(s) the stage for explanatory research’ (Shmueli, Citation2010).
In MA research, it is common, for example, to study the effects of the design and use of various MA/management control practices on the performance of individuals, teams, and companies. These research approaches offer many possibilities for employing ML methods to create more accurate models, where the generalizability of practical implications is taken into consideration by using training and test datasets. As outlined by Shmueli (Citation2010), explanatory power does not imply predictive power, even if this is a common belief in many prior studies. Instead, predictive power should be assessed using cross-validation or metrics computed from a holdout dataset, a common practice in ML analyses, because measures computed from the same dataset to which the model was fitted tend to overestimate performance in terms of predictive accuracy.
Tidhar and Eisenhardt’s (Citation2020) recent study shows an excellent example of how ML can be used by MA scholars to complement other research methods and develop theory. They used a novel theory-building method to find the optimal choice for revenue models by using data from a wide range of products on the App Store. They combined multiple-case theory building with ML analyses by first using a multicase method to identify theoretical constructs, and then employing a large-scale ML analysis to validate and extend these case study findings.
Overall, the predictive approach has been increasingly used in disciplines close to MA. Ding et al. (Citation2020) used linear regression, random forest, gradient boosting, and artificial neural networks to predict insurance losses for five business lines and compared the ML model-generated predictions to managers’ estimates. Their findings showed that ML can substantially improve managerial estimates and suggested that ML techniques can be highly useful for managers and auditors in improving accounting estimates. Managerial estimates are widespread in accounting, as most balance sheet and income statement items are based on estimates. Similarly, in the field of MA, managerial estimates are ubiquitous in the areas of different cost and profit estimates. ML models can use large amounts of data in a more systematic, logical, and complex manner compared to managers alone, and estimates created by ML models are potentially superior, even if managers may possess forward-looking information that ML models cannot use.
Accordingly, future research in MA should assess the possible superiority of ML models over humans in generating accounting estimates. More research is needed to establish and generalize the findings of Ding et al. (Citation2020) and to use ML for other types of revenue, cost, and profit estimates. For example, Jang’s (Citation2019) highly relevant study develops a robust R&D budget allocation system by using improved R&D output predictions from an ML model. The author of the paper uses AutoML, an approach to ML that aims to automate all the steps of building an ML model, thereby minimizing the subjective choices of the researcher. A recent study by Bertomeu et al. (Citation2021) is another example of this research approach. In particular, they used the gradient-boosted regression tree and a wide set of variables from accounting, capital markets, governance, and auditing data sets to detect material misstatements.
In different ML architectures, neural networks are currently the most famous ML algorithms. However, they are usually more suitable for large and/or complex unstructured datasets, such as images, videos, and texts. We discussed the possibilities of (deep) neural networks for textual analysis in MA research in Section 2. For structured datasets of modest size, which most of the datasets in MA are, other ML architectures are usually superior to neural networks. The most promising are architectures called ensemble methods. These algorithms are based on the joint prediction of many simple predictors.
Standard ensemble methods include random forests, bagging, and boosting, all of which previous research has proven to be powerful estimators in accounting and finance datasets. Barboza et al. (Citation2017) evaluated the suitability of many different ML algorithms for structured datasets and concluded that ensemble methods are usually the most efficient option for the predictive approach. Recently, practitioners and academics have been most enthusiastic about gradient boosting (e.g. Bertomeu, Citation2020; Jones, Citation2017), which is an ensemble-type learning method that uses the gradient descent algorithm to train the model (Friedman, Citation2001). One of the latest iterations of these methods, the extreme gradient-boosting algorithm (Chen & Guestrin, Citation2016), has been the state-of-the-art solution for prediction problems with structured data for many years. This algorithm adds highly optimized code, scalability, and accuracy to the basic gradient-boosting approach (Chen & Guestrin, Citation2016). It is widely used in practice and is a consistently-winning architecture in ML competitions organized by websites like www.kaggle.com Thus far, gradient boosting models have been used mainly in the field of finance. Recent exceptions from the field of accounting include Jones (Citation2017), Bao et al. (Citation2020), and the aforementioned studies by Bertomeu et al. (Citation2021) and Ding et al. (Citation2020).
As this tree-based gradient-boosting algorithm is currently one of the most prominent methods, we next outline its benefits in more detail. First, it naturally shares the benefits of most ML methods, such as data-driven model selection with flexible functional forms for associations (including interactions) between variables and powerful predictions. This efficiency can be traced to the structure of the algorithms, where the final prediction is based on predictions of many simple predictors (i.e. decision trees; Varian, Citation2014). Second, the gradient boosting algorithm includes regularization, because the variable selection process in the models’ decision trees diminishes the role of unimportant variables (like in ridge regression) or removes them completely (like in LASSO regression). Third, because gradient boosting is based on decision trees, multicollinearity issues are diminished. This follows from how decision trees are built in these models. As new nodes are added to the tree based on how much they decrease prediction error, very similar covariates are seldom added to the same tree (Storm et al., Citation2020). Lastly, this approach avoids the loss of observations that have missing values. This is important because MA researchers usually have relatively small datasets with many predictors and controls. In these situations, many of the observations can have at least one missing value. Tree-based gradient boosting algorithms utilize the data only where there is information, as they make cuts on variables using only those with non-missing values.
Besides the tree-based ensemble methods presented here, many other supervised ML algorithms that share the benefits discussed above can also be employed in MA studies, such as regression trees, support vector machines, matrix factorization, and regularized regression (LASSO, ridge, and elastic net). See, for example, Varian (Citation2014) and Storm et al. (Citation2020) for an overview and additional details.
One particularly promising and emerging area, from the point of view of MA research, comprises the contributions made mainly by economists to developing ML for causal inference (Athey et al., Citation2019; Wager & Athey, Citation2018). The predictive ability of ML in complex and high-dimensional settings can be used to improve causal estimates. Along with several authors developing the potential of ML for causal inference in economics, a discussion of causal analysis is currently emerging from the ML literature itself. New promising solutions include causal forests, counterfactual simulation, double ML, and ML for matching. A thorough review of these methods can be found in Athey et al. (Citation2019). Such a causal analysis could reveal the actual direction of association and control issues, such as reverse causality. A recent study by Lee et al. (Citation2020) combined ML and an experimental design to draw causal inferences by isolating heterogeneous treatment effects with the aid of recent ML innovations. Their step-by-step guide, easily implemented in MA research, also shows how to combine field experiments with ML methods to infer causal relationships.
5. How to Interpret ML Models—Explainable AI
As discussed in the previous section, ML methods have been considered inappropriate for explanatory modeling, as they lack interpretability with respect to theory. In explanatory modeling, the (linear) model is carefully constructed in accordance with the theory to support the interpretation of the estimated relationship between X and Y. Inference can be used with these models to evaluate the statistical significance of the associations, which are then turned into causal relationships using the assumptions of the theory.
Thus, interpretability is the key obstacle that prohibits the use of ML in explanatory modeling, and research on explainable AI aims to solve that problem. For example, game theory has been used to design methods that give local and global interpretability to many different ML models (Covert et al., Citation2020; Lundberg et al., Citation2020), allowing similar research approaches usually implemented with linear regression models. However, interpretability with ML models also considers nonlinear associations and interactions. This is a major benefit compared to linear regression models, which explain theory using linear associations that do not consider interactions unless they have been predefined by the researcher. This is overly restrictive compared to the interpretability methods of ML models that estimate how much X explains the variation of Y for all functional forms, not just linear. By overlooking the complex interactions between variables and their nonlinear associations, we create bias, whereby we reduce our ability to fully understand the potentially complex phenomenon and its reality (Doornenbal et al., Citation2021).
However, interpreting ML models is far from trivial. For example, it is impossible to describe a nonlinear association using a single parameter that can be used in linear regression. Nonlinear models require new ways of analyzing the importance of features. Two very promising methods for interpreting ML models are the Shapley Additive exPlanations (SHAP; Lundberg et al., Citation2020) and the Shapley Additive Global importancE (SAGE) methods (Covert et al., Citation2020). These are based on game-theoretically optimal Shapley values and have many of the desirable properties of importance metrics, such as local accuracy, consistency, efficiency, symmetry, and additivity (Covert et al., Citation2020; Lundberg et al., Citation2020). They are powerful methods for explaining local interpretability (i.e. individual predictions) and global interpretability (i.e. a model’s behavior across the whole data set).
TreeSHAP is a variant of SHAP for tree-based ML models, such as gradient boosting (Lundberg et al., Citation2020). It is fast, computes exact Shapley values, and can handle feature dependencies. Furthermore, because the method measures individual predictions, it offers versatile ways to analyze the nature of the associations between the predictors and the predicted outcomes. The SAGE method offers robust estimates for the global importance of features, and Covert et al. (Citation2020) have provided efficient algorithms for calculating SAGE values in tree-based ensemble models. Ylinen and Ranta (Citation2021) developed these methods further by combining SHAP values with bootstrap methods (Efron, Citation1979) to include statistical significance in interpretations. Due to these characteristics, the SHAP/SAGE models are considered the most reliable metrics for tree-based ML methods at the moment (Covert et al., Citation2020; Lundberg et al., Citation2020). In fact, papers in accounting and related fields have already appeared that use SHAP values to interpret the results of ML models. The closest to MA are those of Futagami et al. (Citation2021), who show how SHAP values can be used to identify the most important features that predict mergers and acquisitions, and Ranta and Ylinen (Citation2021), who use SHAP values and bootstrapping to analyze the connection between the board composition of a company and its characteristics of workplace diversity.
5.1. Example of Explainable AI – SHAP Values14
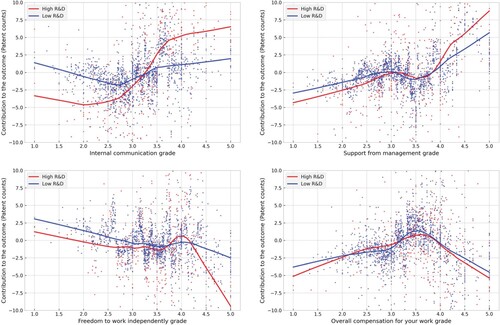
InFootnote14 our example, we analyzed the role of organizational control in explaining company innovation. We measured innovation using patent counts for the following year. As measures of organizational control choices, we used variables Internal communication, Support from management, Freedom to work independently, and Overall compensation for your work, collected from a social media website where employees can grade (1–5) their company on these diversity values.Footnote15 As control variables, we used Total assets, ROA, Leverage, R&D intensity, Capital intensity, Firm age, Industry (standard industry classification (SIC) 2-digit), and Implied volatility. Our example employs TreeExplainer (Lundberg et al., Citation2020) and XGBoost (Chen & Guestrin, Citation2016), both of which have libraries for Python.
We recognize the shortcomings of this approach in measuring company innovation reliably. For example, using patent counts as a measure of innovation is suitable only for companies in specific industries, and even in these industries, the variable does not measure all types of innovation. However, the main purpose of this example is to demonstrate how tree-based ML models and SHAP values can be used for an explanatory approach in which we can interpret in detail the role of different variables in explaining company innovation. Like regression coefficients explain the contribution of each variable to the linear prediction of linear regression models, SHAP values explain the contribution of each variable to the nonlinear prediction of any nonlinear ML model.
shows how SHAP values can be used for explanatory analysis.Footnote16 The topmost subfigure presents SHAP values for one individual observation (i.e. the next period’s patent counts for Adobe Inc. for 2014). As we can see, they provide local explanations for the variables. The boosting model predicts approximately 184 patent counts for the next year, and SHAP values show how each variable contributes to this prediction. The most significant contribution comes from the variables R&D intensity, with a positive effect of 126.91 patent counts, and Total assets, with a negative effect of 52 patent counts. The interpretation is that R&D intensity of Adobe Inc. is such that it is predicted to increase patent counts from the whole sample’s average by 126.91, while Total assets is such that it is predicted to decrease patent counts by 52. From variables estimating different organizational control choices, Overall compensation for your work plays a significant role in predicting patent counts. The high grade of this variable is estimated to have a positive effect of 12.09 for the next period’s patent counts.
Figure 4. How to use SHAP values for explanatory analysis. The topmost subfigure presents SHAP values for one individual observation (in particular, the next period’s patent counts for Adobe Inc. for 2014). These values explain the contribution of each variable to the nonlinear prediction of the boosting model. The left subfigure in the middle provides the mean of the absolute SHAP values for our variables that can be used to evaluate their overall importance. The right subfigure in the middle provides SHAP values of ‘Overall compensation for your work' for all observations, which allows for an analysis of the nonlinear association with the output. At the bottom are bootstrap-estimated average and confidence intervals for the ‘Overall compensation for your work' variable using seven domain intervals
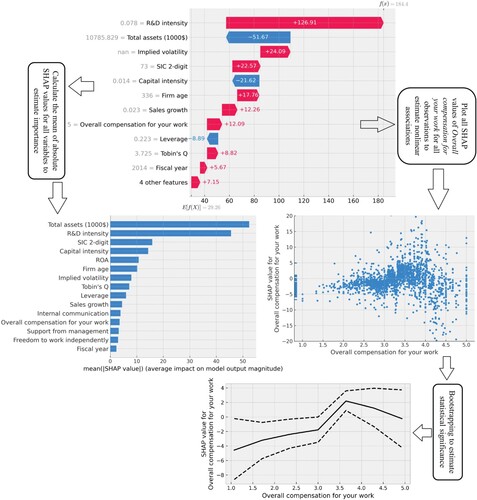
The right subfigure in the middle of shows how the SHAP values of individual observations can be used to analyze the nonlinear association between predictors and an output variable. It provides SHAP values of Overall compensation for your work for all observations. The x-axis has the feature values, and the y-axis has the SHAP values (i.e. contribution to the outcome). Each individual dot in the chart is one observation. As can be seen from the chart, the variable has a complicated nonlinear effect on the prediction. From Grades 1–3.5, the variable has a weak positive effect on the outcome (i.e. when moving from left to right, the SHAP values increased). From Grade 3.5 onwards, the SHAP values start to decrease, meaning that the effect of the variable is negative for the outcome.
The coefficients of linear regression models estimate each variable’s global importance/contribution to the outcome (model). Thus, it would be useful to have a similar measure for ML models. Lundberg et al. (Citation2020) showed how SHAP values could be used to estimate the global importance of variables by calculating a suitable aggregate from local explanations. Furthermore, Covert et al. (Citation2020) modified the SHAP model by introducing SAGE values that can be used to estimate the global importance of each variable, which takes into account all interactions between variables. The left subfigure in the middle of provides the mean of the absolute SHAP values for our variables. The benefit of SHAP values is that they are easier to interpret. For example, the value for R&D intensity in the subfigure means that, on average, R&D intensity has an effect of approximately 45 patent counts on the prediction. According to the aggregate SHAP values, Internal communication is the most important organizational control variable, with an average effect of approximately five patent counts.
To infer the statistical significance of the findings, we used bootstrapping, which means building a metric using random sampling with replacement. The idea of bootstrapping is to mimic the sampling process to acquire an estimate of, for example, an average. At the bottom of are the bootstrap-estimated average and confidence intervals for the Overall compensation for your work variable using seven domain intervals. The figure verifies our preliminary observations. The effect of the variable is negative for lower grades, which turns positive around Grade 3.5. The positive effect decreases after this grade, but the effect at the highest grades is not statistically significant.
Lundberg et al. (Citation2020) have also demonstrated how SHAP values can be used to analyze the importance of the interaction effects of variables. It is possible to calculate SHAP values for pairwise interactions, which indicate the (pure) contribution of the interaction between two variables to the prediction. Then, using these interaction SHAP values, a similar aggregate as in the middle-left subfigure of could be calculated to evaluate the importance of the interaction between variables.
Furthermore, SHAP values allow for analyzing the nonlinear interaction structure of the variables. In , we aggregated the information so that it was easier to analyze.Footnote17 We changed R&D intensity to a dummy variable and separately analyzed the kind of effect the organizational control variables had on the outcome for companies with R&D intensity below the median (blue line) and those with R&D intensity above the median (red line). There are interesting differences between these two groups of companies. For example, the positive effect of Internal communication is seen only in the high R&D intensity group. Also, it appears that the negative effect of Freedom to work independently is more pronounced for companies with high R&D intensity.
Figure 5. Nonlinear interaction structure between variables. The red lines estimate the nonlinear contribution of the four organizational control variables for companies with high R&D intensity (above median). The blue lines estimate the same for low R&D intensity companies (below median)
5.2. Limitations of ML for the Explanatory Approach
Almost all aspects of traditional explanatory modeling can be achieved with SHAP values. We obtained detailed estimates for the contribution of each variable to explain the outcome. Furthermore, we estimated these contributions with nonlinear models, thus decreasing the risk of model mismatch, which can give erroneous estimates of variable importance in linear regression models (Lundberg et al., Citation2020). However, our approach cannot provide answers regarding causality, and neither can linear regression models. To estimate causal structures, we need completely different models (Peters et al., Citation2017).
However, one much-used explanatory tool is missing from our ML example. Traditional econometrics uses instrumental variables (IV) models to correct omitted variable bias (and a few other types of endogeneity). If an efficient instrument can be found, IV models are an effective way to correct this bias. SHAP uses Shapley values from game theory to estimate the contribution of each variable to the outcome. Due to the lack of a mature theory, it is not yet well understood how much bias omitted variables can cause to these game theory based metrics. This shortcoming will likely be relatively easy to correct in the future. Several papers have demonstrated approaches to including instrumental variables in ensemble methods (Athey et al., Citation2019; Bakhitov & Singh, Citation2021). In the field of management research, Wang et al. (Citation2021) recently introduced the first practical implementation of instrumental variable ML models, which is also highly relevant for MA research.
6. Conclusions
The primary purpose of our research was to explore the possibilities of ML methods and new data sources in MA research. Along the way, we demonstrated ML examples in different application areas, which showcased some future possibilities that ML methods may offer for MA research. Furthermore, we supported our illustrative examples by utilizing recent research in accounting and other related disciplines, such as finance, management, ML, and economics. As our approach to cover relevant literature was neither systematic nor structured, its limitation is that it is possibly biased toward topics that we subjectively consider to be most relevant for future MA research. However, we have tried to extensively cover top-tier journals (ABS4-4*) to get a sufficiently objective view of the status quo of research and where it should head. summarizes our findings.
Table 1. Summary of possibilities ML offers for MA research
To conclude, ML methods can provide several opportunities for MA studies, even though this kind of research is still in its infancy. Other research areas of accounting and related fields can provide some concrete research examples for us, and according to our review, most of the ML research in accounting has focused on (1) how AI will change the field of accounting and the development of the accounting profession; (2) textual analysis related to accounting data/reports; and 3) prediction methods, where bankruptcy prediction and fraud detection research fields, in particular, have been at the forefront of the implementation of new ML methods. Even though the use of ML and AI methods in MA research is still in its early stages, the identified previous research provides many potential applications that can be useful in MA research.
We contributed to the MA literature by suggesting several future pathways using ML methods. First, we can use ML-based methods to study traditional MA research questions by using new data sources and applying ML-based textual analysis tools, like topic modeling, to make sense of complex and high-dimensional textual data (e.g. social media texts, analyst reports, 10-K forms, conference calls, CSR reports, or firm’s internal documents, like written performance evaluation reports) or large sets of qualitative interview materials. There are also some new opportunities for using ML algorithms in analyzing images and video data, such as ML-based face detections (Ahmed et al., Citation2020; Hsieh et al., Citation2020) or satellite data (Donaldson & Storeygard, Citation2016; Katona et al., Citation2018). Similarly, ML-based textual analysis tools allow researchers to find new sets of internal and external data, quantify textual data, reduce data, validate interpretations in qualitative research (Lukka & Modell, Citation2010), and, if not yet make interpretations requiring human judgment, at least support existing interpretations and create new measures for variables that have been previously difficult to measure. These methods can be used in a data-driven way to create either outcome variables or explanatory variables for further empirical analyses; they might also be particularly useful as an intermediate step in empirical work in MA. This can advance theory discovery, refinement, and testing in MA (Lukka & Vinnari, Citation2014; Malmi & Granlund, Citation2009; Mantere & Ketokivi, Citation2013; Zimmerman, Citation2001) further than what has been possible so far with traditional empirical research methods and theorization (Choudhury et al., Citation2021).
In addition, using ML models to create better estimates and predictions is a particularly promising area for future MA research, even in its interventionist mode (Lukka & Suomala, Citation2014) in cooperation with companies. Accordingly, future research in MA should assess the possible superiority of ML models over humans in generating MA estimates. More research is needed to generalize the findings of Ding et al. (Citation2020) and establish the use of ML for other types of revenue, cost, and profit estimates. However, in our opinion, one important field of AI is currently absent from MA research: explainable AI. Recent progress in the field (see, e.g. Molnar, Citation2021) has identified many possibilities by moving the interpretation of ML models one step closer to linear methods and making it possible to replace traditional econometric methods with ML models in many different MA research problems. ML methods offer many benefits compared to traditional regression models. To conclude, we see that ML methods offer great promise for MA research and theorization.
Supplemental Data and Research Materials
Supplemental data for this article can be accessed on the Taylor & Francis website, https://doi.org/10.1080/09638180.2022.2137221.
Appendix A. https://github.com/ML-for-Accounting/machine-learning-for-management-accounting
Acknowledgements
The authors would like to thank the editor and two anonymous reviewers for their very insightful and helpful comments. We gratefully acknowledge the financial support of the Finnish Foundation for Economic Education.
Disclosure statement
No potential conflict of interest was reported by the author(s).
Additional information
Funding
Notes
1 The GitHub repository https://github.com/ML-for-Accounting/machine-learning-for-management-accounting provides Python code as Jupyterlab notebooks for all the examples provided in this paper. The concluding chapter includes a table that summarizes the findings of this paper.
2 The code for this example can be found from the Example_for_section22.ipynb file in the GitHub repository.
3 Part 1 in the example code.
4 Part 2 in the example code.
5 Part 3 in the example code.
6 Part 4 in the example code.
7 The code for this example can be found from the Example_for_section24.ipynb file in the GitHub repository.
8 The code for this example can be found from the Example_for_section33.ipynb file in the GitHub repository.
9 This preprocessing part is very similar to the example of Section 2.2 where the reader can find more guidance.
10 Part 1 in the example code.
11 Part 2 in the example code.
12 Part 3 in the example code.
13 Part 4 in the example code.
14 The code for this example can be found from the Example_for_section51-randomized.ipynb file in the GitHub repository.
15 We have collected the example data from www.kununu.com, which contains employee opinions about their employers. The raw data contains some 500k observations from 2014 to 2019, and includes US companies of all sizes. However, the sub-sample used in the example consists of S&P1500 companies only. We are not able to make this dataset available in the repository, but a randomized version of it is there to make it easier to test the example code.
16 The code for creating the subfigures can be found in Parts 1,2,3 and 4 in the example code.
17 The code for creating the figure can be found in Part 5 of the example code.
References
- Ahmed, S., Ranta, M., & Vähämaa, S. (2020). Facial attractiveness and CEO compensation: Evidence from the banking industry (SSRN Scholarly Paper ID 3744808). Social Science Research Network. https://doi.org/10.2139/ssrn.3744808.
- Allee, K. D., & Deangelis, M. D. (2015). The structure of voluntary disclosure narratives: Evidence from tone dispersion. Journal of Accounting Research, 53(2), 241–274. https://doi.org/10.1111/1475-679X.12072
- Angelov, D. (2020). Top2Vec: Distributed representations of topics. ArXiv:2008.09470 [Cs, Stat]. http://arxiv.org/abs/2008.09470.
- Appelbaum, D., Kogan, A., Vasarhelyi, M., & Yan, Z. (2017). Impact of business analytics and enterprise systems on managerial accounting. International Journal of Accounting Information Systems, 25, 29–44. https://doi.org/10.1016/j.accinf.2017.03.003
- Athey, S., Bayati, M., Imbens, G., & Qu, Z. (2019). Ensemble methods for causal effects in panel data settings. AEA Papers and Proceedings, 109, 65–70. https://doi.org/10.1257/pandp.20191069
- Auvinen, T. P., Sajasalo, P., Sintonen, T., Takala, T., & Järvenpää, M. (2018). Antenarratives in ongoing strategic change: Using the story index to capture daunting and optimistic futures. In H. Krämer, & M. Wenzel (Eds.), How organizations manage the future: Theoretical perspectives and empirical insights (pp. 133–151). Springer International Publishing. https://doi.org/10.1007/978-3-319-74506-0_7.
- Bakhitov, E., & Singh, A. (2021). Causal gradient boosting: Boosted instrumental variable regression. ArXiv:2101.06078 [Econ, Stat]. http://arxiv.org/abs/2101.06078.
- Ball, C., Hoberg, G., & Maksimovic, V. (2015). Disclosure, Business Change and Earnings Quality (SSRN Scholarly Paper ID 2260371). Social Science Research Network. https://doi.org/10.2139/ssrn.2260371.
- Bao, Y., Ke, B., Li, B., Yu, Y. J., & Zhang, J. (2020). Detecting accounting fraud in publicly traded U.S. Firms using a machine learning approach. Journal of Accounting Research, 58(1), 199–235. https://doi.org/10.1111/1475-679X.12292
- Barboza, F., Kimura, H., & Altman, E. (2017). Machine learning models and bankruptcy prediction. Expert Systems with Applications, 83, 405–417. https://doi.org/10.1016/j.eswa.2017.04.006
- Bartov, E., Faurel, L., & Mohanram, P. S. (2018). Can twitter help predict firm-level earnings and stock returns? The Accounting Review, 93(3), 25–57. https://doi.org/10.2308/accr-51865
- Bellstam, G., Bhagat, S., & Cookson, J. A. (2021). A text-based analysis of corporate innovation. Management Science, 67(7), 4004–4031. https://doi.org/10.1287/mnsc.2020.3682
- Bertomeu, J. (2020). Machine learning improves accounting: Discussion, implementation and research opportunities. Review of Accounting Studies, 25(3), 1135–1155. https://doi.org/10.1007/s11142-020-09554-9
- Bertomeu, J., Cheynel, E., Floyd, E., & Pan, W. (2021). Using machine learning to detect misstatements. Review of Accounting Studies, 26(2), 468–519. https://doi.org/10.1007/s11142-020-09563-8
- Bhatia, S., Olivola, C. Y., Bhatia, N., & Ameen, A. (2021). Predicting leadership perception with large-scale natural language data. The Leadership Quarterly, 101535, https://doi.org/10.1016/j.leaqua.2021.101535
- Bhave, D. P. (2014). The invisible eye? Electronic performance monitoring and employee job performance. Personnel Psychology, 67(3), 605–635. https://doi.org/10.1111/peps.12046
- Bingler, J. A., Kraus, M., & Leippold, M. (2021). Cheap talk and cherry-picking: What ClimateBert has to say on corporate climate risk disclosures (SSRN Scholarly Paper ID 3796152). Social Science Research Network. https://papers.ssrn.com/abstract=3796152.
- Blei, D. M., & Lafferty, J. D. (2006). Dynamic topic models. Proceedings of the 23rd International conference on machine learning, 113–120. https://doi.org/10.1145/1143844.1143859.
- Blei, D. M., Ng, A. Y., & Jordan, M. I. (2003). Latent dirichlet allocation. The Journal of Machine Learning Research, 3(null), 993–1022.
- Brown, N. C., Crowley, R. M., & Elliott, W. B. (2020b). What are you saying? Using topic to detect financial misreporting. Journal of Accounting Research, 58(1), 237–291. https://doi.org/10.1111/1475-679X.12294
- Brown, S. V., Hinson, L. A., & Tucker, J. W. (2021). Financial statement adequacy and firms’ MD&A disclosures (SSRN Scholarly Paper ID 3891572). Social Science Research Network. https://doi.org/10.2139/ssrn.3891572.
- Brown, T., Mann, B., Ryder, N., Subbiah, M., Kaplan, J. D., Dhariwal, P., Neelakantan, A., Shyam, P., Sastry, G., Askell, A., & Agarwal, S. (2020a). Language models are few-shot learners. ArXiv:2005.14165 [Cs]. http://arxiv.org/abs/2005.14165.
- Brynjolfsson, E., & McAfee, A. (2014). The second machine age: Work, progress, and prosperity in a time of brilliant technologies. WW Norton & Company.
- Chen, T., & Guestrin, C. (2016). XGBoost: A scalable tree boosting system. ArXiv:1603.02754 [Cs]. https://doi.org/10.1145/2939672.2939785.
- Choudhury, P., Allen, R. T., & Endres, M. G. (2021). Machine learning for pattern discovery in management research. Strategic Management Journal, 42(1), 30–57. https://doi.org/10.1002/smj.3215
- Choudhury, P., Wang, D., Carlson, N. A., & Khanna, T. (2019). Machine learning approaches to facial and text analysis: Discovering CEO oral communication styles. Strategic Management Journal, 40(11), 1705–1732. https://doi.org/10.1002/smj.3067
- Covert, I., Lundberg, S., & Lee, S.-I. (2020). Understanding global feature contributions with additive importance measures. ArXiv:2004.00668 [Cs, Stat]. http://arxiv.org/abs/2004.00668.
- Davis, A. K., & Tama-Sweet, I. (2012). Managers’ Use of language across alternative disclosure outlets: Earnings press releases versus MD&A*. Contemporary Accounting Research, 29(3), 804–837. https://doi.org/10.1111/j.1911-3846.2011.01125.x
- Devlin, J., Chang, M.-W., Lee, K., & Toutanova, K. (2019). BERT: Pre-training of deep bidirectional transformers for language understanding. ArXiv:1810.04805 [Cs]. http://arxiv.org/abs/1810.04805.
- Ding, K., Lev, B., Peng, X., Sun, T., & Vasarhelyi, M. A. (2020). Machine learning improves accounting estimates: Evidence from insurance payments. Review of Accounting Studies, 25(3), 1098–1134. https://doi.org/10.1007/s11142-020-09546-9
- Donaldson, D., & Storeygard, A. (2016). The view from above: Applications of satellite data in economics. Journal of Economic Perspectives, 30(4), 171–198. https://doi.org/10.1257/jep.30.4.171
- Doornenbal, B. M., Spisak, B. R., & van der Laken, P. A. (2021). Opening the black box: Uncovering the leader trait paradigm through machine learning. The Leadership Quarterly, 101515), https://doi.org/10.1016/j.leaqua.2021.101515
- Duan, Y., Hsieh, T.-S., Wang, R. R., & Wang, Z. (2020). Entrepreneurs’ facial trustworthiness, gender, and crowdfunding success. Journal of Corporate Finance, 64, 101693. https://doi.org/10.1016/j.jcorpfin.2020.101693
- Dyer, T., Lang, M., & Stice-Lawrence, L. (2017). The evolution of 10-K textual disclosure: Evidence from latent dirichlet allocation. Journal of Accounting and Economics, 64(2), 221–245. https://doi.org/10.1016/j.jacceco.2017.07.002
- Efron, B. (1979). Bootstrap methods: Another look at the jackknife. The Annals of Statistics, 7(1), 1–26. https://doi.org/10.1214/aos/1176344552
- Eisenhardt, K. M. (1989). Building theories from case study research. The Academy of Management Review, 14(4), 532–550. https://doi.org/10.2307/258557
- Elmsili, B., & Outtaj, B. (2018). Artificial neural networks applications in economics and management research: An exploratory literature review. 2018 4th International conference on optimization and applications (ICOA), 1–6. https://doi.org/10.1109/ICOA.2018.8370600.
- El-Haj, M., Rayson, P., Walker, M., Young, S., & Simaki, V. (2019). In search of meaning: Lessons, resources and next steps for computational analysis of financial discourse. Journal of Business Finance & Accounting, 46(3–4), 265–306. https://doi.org/10.1111/jbfa.12378
- Feldman, R., Govindaraj, S., Livnat, J., & Segal, B. (2010). Management’s tone change, post earnings announcement drift and accruals. Review of Accounting Studies, 15(4), 915–953. https://doi.org/10.1007/s11142-009-9111-x
- Fisher, I. E., Garnsey, M. R., & Hughes, M. E. (2016). Natural language processing in accounting, auditing and finance: A synthesis of the literature with a roadmap for future research. Intelligent Systems in Accounting, Finance and Management, 23(3), 157–214. https://doi.org/10.1002/isaf.1386
- Frey, C. B., & Osborne, M. A. (2017). The future of employment: How susceptible are jobs to computerisation? Technological Forecasting and Social Change, 114, 254–280. https://doi.org/10.1016/j.techfore.2016.08.019
- Friedman, J. H. (2001). Greedy function approximation: A gradient boosting machine. The Annals of Statistics, 29(5), 1189–1232. https://doi.org/10.1214/aos/1013203451
- Futagami, K., Fukazawa, Y., Kapoor, N., & Kito, T. (2021). Pairwise acquisition prediction with SHAP value interpretation. The Journal of Finance and Data Science, 7, 22–44. https://doi.org/10.1016/j.jfds.2021.02.001
- Garanina, T., Ranta, M., & Dumay, J. (2021). Blockchain in accounting research: Current trends and emerging topics. Accounting, Auditing & Accountability Journal, ahead-of-print(ahead-of-print). https://doi.org/10.1108/AAAJ-10-2020-4991.
- Glaser, B. G., Strauss, A. L., & Strutzel, E. (1968). The discovery of grounded theory; strategies for qualitative research. Nursing Research, 17(4), 364. https://doi.org/10.1097/00006199-196807000-00014
- Green, T. C., Huang, R., Wen, Q., & Zhou, D. (2019). Crowdsourced employer reviews and stock returns. Journal of Financial Economics, 134(1), 236–251. https://doi.org/10.1016/j.jfineco.2019.03.012
- Grennan, J. (2019). A corporate culture channel: How increased shareholder governance reduces firm value (SSRN Scholarly Paper ID 2345384). Social Science Research Network. https://doi.org/10.2139/ssrn.2345384.
- Guiso, L., Sapienza, P., & Zingales, L. (2015). The value of corporate culture. Journal of Financial Economics, 117(1), 60–76. https://doi.org/10.1016/j.jfineco.2014.05.010
- Gulbrandsen, I. T., Just, S. N., & Dahlman, S. E. M. (2019). Inside the responsibility machine: Exploring the algorithmic strategizing of a fintech start-up. In Paper presented at 14th Organization studies summer workshop, Mykonos, Greece.
- Hales, J., Moon, J. R., & Swenson, L. A. (2018). A new era of voluntary disclosure? Empirical evidence on how employee postings on social media relate to future corporate disclosures. Accounting, Organizations and Society, 68-69, 88–108. https://doi.org/10.1016/j.aos.2018.04.004
- Harrison, J. S., Thurgood, G. R., Boivie, S., & Pfarrer, M. D. (2019). Measuring CEO personality: Developing, validating, and testing a linguistic tool. Strategic Management Journal, 40(8), 1316–1330. https://doi.org/10.1002/smj.3023
- Hart, R. P. (2001). Redeveloping DICTION: Theoretical considerations. Progress in Communication Sciences, 43–60.
- Henry, E. (2008). Are investors influenced by how earnings press releases are written? Journal of Business Communication, 45(4), 363–407. https://doi.org/10.1177/0021943608319388
- Hsieh, T.-S., Kim, J.-B., Wang, R. R., & Wang, Z. (2020). Seeing is believing? Executives’ facial trustworthiness, auditor tenure, and audit fees. Journal of Accounting and Economics, 69(1), 101260. https://doi.org/10.1016/j.jacceco.2019.101260
- Huang, A. H., Lehavy, R., Zang, A. Y., & Zheng, R. (2018). Analyst information discovery and interpretation roles: A topic modeling approach. Management Science, 64(6), 2833–2855. https://doi.org/10.1287/mnsc.2017.2751
- Huang, K., Li, Meng, & Markov, S. (2020). What do employees know? Evidence from a social media platform. Accounting Review, 95(2), 199–226. https://doi.org/10.2308/accr-52519
- Huang, A. H., Wang, H., & Yang, Y. (2022). FinBERT: A large language model for extracting information from financial text. Contemporary Accounting Research, forthcoming. https://doi.org/10.1111/1911-3846.12832
- Huang, M., Li, P., Meschke, F., & Guthrie, J. P. (2015). Family firms, employee satisfaction, and corporate performance. Journal of Corporate Finance, 34, 108–127. https://doi.org/10.1016/j.jcorpfin.2015.08.002
- Iaria, A., Schwarz, C., & Waldinger, F. (2018). Frontier knowledge and scientific production: Evidence from the collapse of international science*. The Quarterly Journal of Economics, 133(2), 927–991. https://doi.org/10.1093/qje/qjx046
- Jang, H. (2019). A decision support framework for robust R&D budget allocation using machine learning and optimization. Decision Support Systems, 121, 1–12. https://doi.org/10.1016/j.dss.2019.03.010
- Jones, S. (2017). Corporate bankruptcy prediction: A high dimensional analysis. Review of Accounting Studies, 22(3), 1366–1422. https://doi.org/10.1007/s11142-017-9407-1
- Kang, J. K., Stice-Lawrence, L., & Wong, Y. T. F. (2021). The firm next door: Using satellite images to study local information advantage. Journal of Accounting Research, 59(2), 713–750. https://doi.org/10.1111/1475-679X.12360
- Katona, Z., Painter, M., Patatoukas, P. N., & Zeng, J. (2018). On the capital market consequences of alternative data: Evidence from outer space (SSRN Scholarly Paper ID 3222741). Social Science Research Network. https://doi.org/10.2139/ssrn.3222741.
- Keating, P. J. (1995). A Framework for classifying and evaluating the theoretical contribution of case research in management accounting. Journal of Management Accounting Research, 7(1), 66–86.
- Kosinski, M., Bachrach, Y., Kohli, P., Stillwell, D., & Graepel, T. (2014). Manifestations of user personality in website choice and behaviour on online social networks. Machine Learning, 95(3), 357–380. https://doi.org/10.1007/s10994-013-5415-y
- Kozlowski, S. W. J., Chao, G. T., Chang, C.-H., & Fernandez, R. (2016). Using big data to advance the science of team effectiveness. In S. Tonidandel, E. B. King, & J. M. Cortina (Eds.), Big data at work: The data science revolution and organizational psychology (pp. 272–309). Routledge/Taylor & Francis Group.
- LeCun, Y., Bengio, Y., & Hinton, G. (2015). Deep learning. Nature, 521(7553), 436–444. https://doi.org/10.1038/nature14539
- Lee, A., Inceoglu, I., Hauser, O., & Greene, M. (2020). Determining causal relationships in leadership research using machine learning: The powerful synergy of experiments and data science. The Leadership Quarterly, 101426), https://doi.org/10.1016/j.leaqua.2020.101426
- Lei, L. (Gillian), Li, Y., & Luo, Y. (2019). Production and dissemination of corporate information in social media: A review. Journal of Accounting Literature, 42(1), 29–43. https://doi.org/10.1016/j.acclit.2019.02.002
- Li, F. (2010). Textual analysis of corporate disclosures: A survey of the literature. Journal of Accounting Literature, 29(1), 143–165.
- Li, K., Mai, F., Shen, R., & Yan, X. (2020). Measuring corporate culture using machine learning. The Review of Financial Studies, hhaa079. https://doi.org/10.1093/rfs/hhaa079
- Loughran, T., & Mcdonald, B. (2011). When is a liability not a liability? Textual analysis, dictionaries, and 10-Ks. The Journal of Finance, 66(1), 35–65. https://doi.org/10.1111/j.1540-6261.2010.01625.x
- Loughran, T., & Mcdonald, B. (2016). Textual analysis in accounting and finance: A survey. Journal of Accounting Research, 54(4), 1187–1230. https://doi.org/10.1111/1475-679X.12123
- Lukka, K., & Modell, S. (2010). Validation in interpretive management accounting research. Accounting, Organizations and Society, 35(4), 462–477. https://doi.org/10.1016/j.aos.2009.10.004
- Lukka, K., & Suomala, P. (2014). Relevant interventionist research: Balancing three intellectual virtues. Accounting and Business Research, 44(2), 204–220. https://doi.org/10.1080/00014788.2013.872554
- Lukka, K., & Vinnari, E. (2014). Domain theory and method theory in management accounting research. Accounting, Auditing & Accountability Journal, 27(8), 1308–1338. https://doi.org/10.1108/AAAJ-03-2013-1265
- Lundberg, S. M., Erion, G., Chen, H., DeGrave, A., Prutkin, J. M., Nair, B., Katz, R., Himmelfarb, J., Bansal, N., & Lee, S.-I. (2020). From local explanations to global understanding with explainable AI for trees. Nature Machine Intelligence, 2(1), 56–67. https://doi.org/10.1038/s42256-019-0138-9
- Malmi, T., & Granlund, M. (2009). In search of management accounting theory. European Accounting Review, 18(3), 597–620. https://doi.org/10.1080/09638180902863779
- Mantere, S., & Ketokivi, M. (2013). Reasoning in organization science. Academy of Management Review, 38(1), 70–89. https://doi.org/10.5465/amr.2011.0188
- Mathur, M. B., & Reichling, D. B. (2016). Navigating a social world with robot partners: A quantitative cartography of the Uncanny Valley. Cognition, 146, 22–32. https://doi.org/10.1016/j.cognition.2015.09.008
- Mauritz, C., Nienhaus, M., & Oehler, C. (2021). The role of individual audit partners for narrative disclosures. Review of Accounting Studies, https://doi.org/10.1007/s11142-021-09634-4
- Mikolov, T., Chen, K., Corrado, G., & Dean, J. (2013a). Efficient estimation of word representations in vector space. ArXiv:1301.3781 [Cs]. http://arxiv.org/abs/1301.3781.
- Mikolov, T., Sutskever, I., Chen, K., Corrado, G., & Dean, J. (2013b). Distributed representations of words and phrases and their compositionality. ArXiv:1310.4546 [Cs, Stat]. http://arxiv.org/abs/1310.4546.
- Miller, G. S. (2017). Discussion of “the evolution of 10-K textual disclosure: Evidence from latent dirichlet allocation”. Journal of Accounting and Economics, 64(2), 246–252. https://doi.org/10.1016/j.jacceco.2017.07.004
- Miller, G. S., & Skinner, D. J. (2015). The evolving disclosure landscape: How changes in technology, the media, and capital markets are affecting disclosure. Journal of Accounting Research, 53(2), 221–239. https://doi.org/10.1111/1475-679X.12075
- Moll, J., & Yigitbasioglu, O. (2019). The role of internet-related technologies in shaping the work of accountants: New directions for accounting research. The British Accounting Review, 51(6), 100833. https://doi.org/10.1016/j.bar.2019.04.002
- Molnar, C. (n.d.). Interpretable machine learning. Retrieved April 8, 2021, from https://christophm.github.io/interpretable-ml-book/.
- Moro, S., Cortez, P., & Rita, P. (2015). Business intelligence in banking: A literature analysis from 2002 to 2013 using text mining and latent dirichlet allocation. Expert Systems with Applications, 42(3), 1314–1324. https://doi.org/10.1016/j.eswa.2014.09.024
- Peters, J., Janzing, D., & Schölkopf, B. (2017). Elements of causal inference: Foundations and learning algorithms. The MIT Press.
- Porter, M. F. (1980). An algorithm for suffix stripping. Program, 14(3), 130–137. https://doi.org/10.1108/eb046814
- Ranta, M., & Ylinen, M. (2021). Board composition and workplace diversity: A machine learning approach (SSRN Scholarly Paper ID 3812296). Social Science Research Network. https://doi.org/10.2139/ssrn.3812296.
- Ravid, D. M., Tomczak, D. L., White, J. C., & Behrend, T. S. (2020). Epm 20/20: A review, framework, and research agenda for electronic performance monitoring. Journal of Management, 46(1), 100–126. https://doi.org/10.1177/0149206319869435
- Rehurek, R., & Sojka, P. (2010). Software framework for topic modelling with large corpora. In proceedings of the Lrec 2010 workshop on new challenges for Nlp frameworks, 45–50.
- Rikhardsson, P., & Yigitbasioglu, O. (2018). Business intelligence & analytics in management accounting research: Status and future focus. International Journal of Accounting Information Systems, 29, 37–58. https://doi.org/10.1016/j.accinf.2018.03.001
- Roberts, M. E., Stewart, B. M., & Tingley, D. (2019). Stm: An R package for structural topic models. Journal of Statistical Software, 91(2), 1–40. https://doi.org/10.18637/jss.v091.i02
- Rouwelaar, H., Schaepkens, F., & Widener, S. K. (2020). Skills, influence, and effectiveness of management accountants. Journal of Management Accounting Research, 33(2), 211–235. https://doi.org/10.2308/jmar-18-048
- Scheibenreif, L., Mommert, M., & Borth, D. (2021). Estimation of air pollution with remote sensing data: revealing greenhouse gas emissions from space. ArXiv:2108.13902 [Cs]. http://arxiv.org/abs/2108.13902.
- Shmueli, G. (2010). To explain or to predict? Statistical Science, 25(3), 289–310. https://doi.org/10.1214/10-STS330
- Shrestha, Y. R., Ben-Menahem, S. M., & von Krogh, G. (2019). Organizational decision-making structures in the age of artificial intelligence. California Management Review, 61(4), 66–83. https://doi.org/10.1177/0008125619862257
- Storm, H., Baylis, K., & Heckelei, T. (2020). Machine learning in agricultural and applied economics. European Review of Agricultural Economics, https://doi.org/10.1093/erae/jbz033
- Tidhar, R., & Eisenhardt, K. M. (2020). Get rich or die trying … finding revenue model fit using machine learning and multiple cases. Strategic Management Journal, 41(7), 1245–1273. https://doi.org/10.1002/smj.3142
- Todorov, A., Pakrashi, M., & Oosterhof, N. N. (2009). Evaluating faces on trustworthiness after minimal time exposure. Social Cognition, 27(6), 813–833. https://doi.org/10.1521/soco.2009.27.6.813
- Varian, H. R. (2014). Big data: New tricks for econometrics. Journal of Economic Perspectives, 28(2), 3–28. https://doi.org/10.1257/jep.28.2.3
- Vaswani, A., Shazeer, N., Parmar, N., Uszkoreit, J., Jones, L., Gomez, A. N., Kaiser, L., & Polosukhin, I. (2017). Attention is all you need. ArXiv:1706.03762 [Cs]. http://arxiv.org/abs/1706.03762.
- Wager, S., & Athey, S. (2018). Estimation and inference of heterogeneous treatment effects using random forests. Journal of the American Statistical Association, 113(523), 1228–1242. https://doi.org/10.1080/01621459.2017.1319839
- Wang, G., Li, J., & Hopp, W. J. (2021). An instrumental variable forest approach for detecting heterogeneous treatment effects in observational studies. Management Science, https://doi.org/10.1287/mnsc.2021.4084
- Ylinen, M., & Ranta, M. (2021). Employee-friendly corporate culture and firm performance: evidence from a machine learning approach (SSRN Scholarly Paper ID 3813075). Social Science Research Network. https://doi.org/10.2139/ssrn.3813075.
- Zengul, F. D., Oner, N., Byrd, J. D., & Savage, A. (2021). Revealing research themes and trends in 30 Top-ranking accounting journals: A text-mining approach. Abacus, 57(3), 468–501. https://doi.org/10.1111/abac.12214
- Zimmerman, J. L. (2001). Conjectures regarding empirical managerial accounting research. Journal of Accounting and Economics, 32(1), 411–427. https://doi.org/10.1016/S0165-4101(01)00023-4