ABSTRACT
There is much evidence that intellectual property rights (IPR) protection stimulates trade flows between countries. Yet less is known whether this effect is stronger for technology-intensive products. Using data for 119 countries over the period 1976–2010, this paper shows that the impact of IPR protection on manufacturing imports is significantly stronger for products with greater technology embodiment, as measured by their R&D intensity. An increase in the level of IPR protection leads to 22 per cent faster increase in the value of imports of products at the 90th percentile of R&D intensity than products at the 10th percentile.
1. Introduction
Intellectual property rights (IPR) protection is generally assumed to stimulate innovation and growth (Duguet and LeLarge Citation2012; Gould and Gruben Citation1996; Sakakibara and Branstetter Citation2001). This can be through providing incentives for innovative activities by domestic firms, but might also due to a higher level of technology diffusion from abroad. One important diffusion channel is the import of sophisticated products. According to the theory formalised by Maskus and Penubarti (Citation1995), increased IPR protection in the domestic market can affect imports in two opposing ways. On the one hand, foreign firms have a greater incentive to export their products to the domestic market, as IPR protection reduces the risk of piracy by domestic competitors. This is termed the market expansion effect as foreign firms increase sales in the market. On the other hand, by reducing the ability of local domestic firms to imitate foreign products, the exporter has greater market power which could lead the foreign firm to curtail sales. This countervailing effect is coined the market power effect. It is theoretically ambiguous which effect dominates since both effects are at work and may cancel each other out. A large empirical literature generally finds that higher levels of IPR protection stimulate trade flows for manufacturing products, suggesting the market expansion effect tends to be stronger (Awokuse and Yin Citation2010; Falvey, Foster, and Greenaway Citation2009; Rafiquzzaman Citation2002; Weng, Yang, and Huang Citation2009).Footnote1
While the market expansion effect of increased IPR protection on trade is well established, there is little agreement and evidence on the possible heterogeneity in responsiveness of imports to IPR protection. This evidence is important because not all IPR protection is related to products that might provide technology spillovers. For example, it might be related to protection of brand names of consumer products mainly leading to imports that embody little technological know-how, in contrast to, say, machinery. From the perspective of enhancing growth, one would be interested in the impact of IPR on imports of technologically-advanced products. This is especially relevant for low- and middle-income countries, as importing technology-intensive products can be an important channel of knowledge diffusion from advanced countries and thus be a path towards higher growth and income levels (Keller Citation2004).
Several studies that have attempted to shed light on this issue have produced mixed results. On the one hand, strengthening IPR protection is found to have no significant impact on products with greater technology embodiment (Co Citation2004; Fink and Primo Braga Citation1999; Maskus and Penubarti Citation1995). Whereas, others find increased IPR protection has a particularly strong impact on products that are knowledge-intensive (Awokuse and Yin Citation2010) or industries that are patent-sensitive (Ivus Citation2010). Besides their obvious differences in the data sample used, a more fundamental reason that could explain the mixed results is the empirical approach employed. All these studies relied on dividing import flows by product and separately analysing the subsample in probing how stronger IPR protection affects trade.Footnote2Though helpful and intuitive, the approach is not suited to examine a differential effect as it does not directly compare and test whether the difference is statistically significant across products in terms of technology content.
The main contribution of this paper is to provide systematic evidence on the differential effects that variations of IPR have on trade, contingent upon the technology intensity of a product category. This evidence can be seen as an important addition to the continuing debate regarding the impact of the contentious agreement on the Trade-Related Aspects of Intellectual Property Rights (TRIPs) signed in 1994.Footnote3TRIPs is an international agreement administered by the World Trade Organisation that sets the minimum standards for various forms of intellectual property regulation. This agreement came into effect on 1 January 1995. Has tougher IPR protection mandated by TRIPs really restricted trade in high-tech products and strengthened the monopolistic power of a few innovators, as believed by the opponents of the agreement? To answer the question, I follow the empirical strategy pioneered by Rajan and Zingales (Citation1998) and proxy for the technology intensity of an imported product by the extent to which the originating industry invests in R&D. I then interact the resulting intensity indicator of the product categories with the strength of IPR protection of the importing country. This method is econometrically more appealing than what has been used in the existing literature, as (Equation1(1) ) the interaction term provides a direct test for the statistical significance of the differences between product categories with varying degrees of R&D intensity; (2) it provides more convincing evidence on causality since this approach is less subject to criticism about an omitted variables bias or model misspecification (Rajan and Zingales Citation1998); and (3) I could also, for the first time, quantify the magnitude of the effect-differentials across product categories. For instance, rather than merely stating that increased IPR protection has a larger impact on R&D-intensive products, I now show by how much more the trade value will increase for a product category that is more R&D intensive relative to one that is less R&D intensive. This quantification is both interesting in its own right but it can also be of great value to policy makers in assessing the economic significance of upgrading the IPR system in the country.
The empirical analysis is based on data for manufacturing imports classified by 18 different product categories for a sample of 119 countries and over the period 1976–2010. The stringency of IPR protection of the country is measured by the Ginarte and Park (Citation1997) index. Given the nature of IPR index, all the data are grouped into five-year periods in this study. In other words, the data used in the analysis cover the following years: 1976, 1980, 1985, 1990, 1995, 2000, 2005 and 2010. The main findings are that the impact of IPR on imports is indeed significantly positively correlated with R&D intensity. I find that more stringent IPR protection leads to a 22 per cent faster increase in the value of imports for products at the 90th percentile of R&D intensity (Office, accounting and computing machinery) than for products at the 10th percentile (Textiles, leather, and footwear). This finding remains robust to alternative measures of R&D intensity of product categories and to using a modified IPR index that corrects for the actual enforcement of patent laws in the country.
By splitting the analysis into pre- and post-TRIPs time periods (i.e. 1976–90 versus 1995–2010), I show that the differential effect of IPR is significantly larger in the latter period. This finding supports the notion that the TRIPs agreement stimulates, rather than restricts, trade flows and it seems that the agreement is especially conducive to trading technologically advanced products. If countries are further divided into three different groups according to their income levels, I find that imports by middle-income countries are most sensitive to changes in IPR protection. Splitting the source of imports by different income groups, I also show that the differential effect of IPR is only present for imports coming from the middle-income countries. This result seems to suggest that rather than attracting more technology-intensive products from the advanced economies as one would expect after strengthening IPR protection, the middle-income countries only attracted more imports from countries of its own income group.
An important limitation of the present study is that the analysis is based on imports value rather than volume as there are no product-specific price deflators available to properly account for price changes over time. It could be argued that the faster increase in imports value is driven by increases in price not quantity when price changes are country and product specific. As a sensitivity check to ensure that the results obtained in the paper are not solely driven by changes in price but also (mainly) driven by changes in quantity, this paper further exploits the quantity-unit data provided by UN Comtrade. The quantity unit of imports is measured by counting weight in kilograms. Insofar as one is content with the assumption that the weight of manufactured products has not significantly increased over time, analysis based on this imperfect quantity measure is still useful and informative. It is reassuring that main findings of the paper remain robust and qualitatively consistent.
The remainder of the paper proceeds as follows. Section 2 describes the main empirical strategy and the data used for analysis. Results and sensitivity analyses are presented in Section 3. Section 4 provides concluding remarks.
2. Empirical strategy and data
In this section, I discuss the econometric approach to analysing the differential effects of strengthening IPR protection on manufacturing imports, followed by a description of the data and methods used to construct the key variables of interest.
2.1. Econometric specification
The majority of the existing studies focused on examining the main effect of IPR on trade and relied on dividing imports by product category to identify the differential effect. This approach, however, is not suitable to examining the heterogeneity in responsiveness of trade to IPR protection as it has two major limitations. First, the number of observations diminishes greatly after splitting the sample by product. This makes it harder to find a significant effect. Second, even if the effect can be identified as in, for example, Awokuse and Yin (Citation2010), it cannot be directly compared or tested whether the difference is statistically significant across products, let alone drawing implications about the economic significance of the differential effect. To analyse the differential effect of IPR, I adapt from the approach of Rajan and Zingales (Citation1998) by estimating the following equation:
(1) where the nominal value of imports M for country c,Footnote4product group i, in year t is expressed in natural logarithm;Footnote5
IPR denotes the stringency of a country's IPR protection over time; RD is the product-level indicator for technology intensity, as measured by R&D expenditures as a percentage of value added of the industry which delivered the import; ηc, t represents all the country-level factors that can vary with time, such as income levels, openness to trade, exchange rate movements, differences in general inflation, and institutional quality; ηi, t captures all the product-level factors that can vary over time, such as global trends in productivity and prices or in the demand for a product. Note that these two set of dummies also capture country-, product-, and time-specific fixed effects so that including them separately is not needed. ϵc, i, t is the idiosyncratic error term.
The coefficient β measures whether more stringent IPR protection leads to higher values of imports of products that are more R&D-intensive and if so, the size of the coefficient would reflect the magnitude of this differential effect. Given the theory that technologically advanced products are more prone to imitation and hence more sensitive to changes in IPR protection, β is expected to be positive and significant when the market expansion effect dominates.
2.2. Proxy for IPR protection
As widely used in the literature, the strength of a country's IPR protection is measured by an index developed by Ginarte and Park (Citation1997) and further extended by Park (Citation2008). This index, which I will indicate by G–P in the remainder, is constructed for 122 countries and quinquennially for the period 1960–2010. Five facets of patent laws are captured in the G–P index: the extent of IPR coverage, membership in international patent agreements, provisions for loss of protection, formal enforcement mechanisms, and duration of protection. Each component was further decomposed into characteristics determining its effective strength. For instance, the extent of coverage refers to the patentability of various kinds of inventions in a country, ranging from the patentability of chemical products to the existence of utility models. Membership in patent agreements indicates the number of international treaties a country is a signatory. Each of these subcomponents was assigned a value of one if present and zero if absent, with the component score being the sum of these values as a percentage of the maximum value. Adding up the component scores, the final G–P index is indicated by a continuous value ranging from zero to five, with a higher number signalling more stringent patent protection. This index is considered as the best indicator available in the literature and it has the major advantage over the other popular measure, the index of Rapp and Rozek (Citation1990), in that it is constructed for different years which allows for analysis of the index over time. The Rapp–Rozek index, on the other hand, is merely available for one single year. Conceptually, the G–P index is also preferred because by considering various facets of patent protection in greater detail the G–P index is better able to capture variations in patent laws than the subjective and unit-incremental approach used in Rapp–Rozek (Kanwar and Evenson Citation2009).Footnote6
In general, the world has witnessed a strong increase in IPR protection during the past half-century. The world average of the G–P index value soared from 1.26 in 1960 to 3.33 in 2010. The country that has upgraded most in terms of the strength of IPR protection is (South) Korea, with no IPR protection in 1960 to become one of the most highly IPR protected nations in 2010 (IPR index value 4.33). Somalia, on the other hand, experienced the smallest increase in IPR protection, with an index value of 1.33 in 1960 and 1.46 in 2010. It may not come as a surprise that the US, according to the G–P index, provides the best IPR protection across all countries at any point in time (3.83 in 1960 to 4.88 in 2010). Myanmar offers the poorest IPR protection in the world (index value of 0.2 in 2010). If countries are divided into three different groups depending on their income levels, it can be seen that the middle-income countries have strengthened their patent protections most during the period of investigation and the largest increase in IPR protection, across all income groups, took place in 1995, the year in which the TRIPs agreement came into effect ().
2.3. De jure versus de factor IPR protection
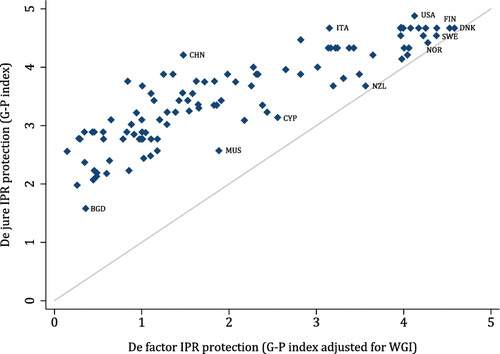
Despite being the most preferred index to use in empirical research, the G–P index also has a major limitation in that it is a de jure measure, reflecting laws and agreements, rather than the actual, de facto, degree of enforcement in the country. In one of the robustness analyses, I try to correct for the degree of enforcement of patent laws in the country by using data on the World Governance Indicators (World Bank Citation2015).Footnote7It seems plausible that there is a positive correlation between a country's governance strength and IPR protection enforcement. If the governance of a country is completely ineffective, then de facto IPR protection is likely to be absent regardless of the degree of protection indicated by the G–P index (i.e. de jure protection). Given that the WGI consist of six indicators and each indicator ranks the countries on a scale from 0 to 100, I take an unweighted average of these six components and divide the final composite score by 100. This means that I obtain a scaling factor ranging from 0-1, where a higher value indicates a more effective government and, by assumption, a more effective enforcement of patent laws. I multiply the scaling factor with the original G–P index and denote it as the enforcement-adjusted IPR index (IPRe).Footnote8As mentioned, if a country has perfect governance, the scaling factor would be one meaning that the rules written down in the book are strictly enforced (IPRe = IPRGP × 1). On the contrary, if the governance of a country is completely ineffective, the scaling factor is zero and the enforcement-adjusted IPR index would be zero as well regardless of the value of de jure IPR protection (IPRe = IPRGP × 0). For illustrative purposes, I plot these two indexes in where the vertical axis denotes de jure IPR protection and the horizontal axis denotes de factor IPR protection. The 45° line corresponds to perfect enforcement of de jure IPR protection. The closer the countries locate to the 45° line, the better the enforcement of de jure IPR protection. It can be seen that the US has the best de jure IPR protection, while Scandinavian countries provide the best de facto protection.Footnote9
Figure 1. De jure versus de factor IPR indexes in 2010.
2.4. Data on imports (value and quantity)
The data on imports are retrieved from the United Nations Commodity Trade Statistics Database (UN Comtrade Citation2015). The time series of the data spans from 1962 to 2014 and the trade commodities are classified by product categories according to three different versions of the Standard International Trade Classification (i.e. SITC Rev.1, Rev.2, Rev.3, respectively). Each classification corresponds to a different time span of data availability.Footnote10Since SITC Rev.1 is too outdated to link products to industries based on International Standard Industry Classification (ISIC) and data in SITC Rev.3 is available for a much shorter time span, I opt for the commodity classification based on SITC Rev.2 at 4-digit for a sample of 119 countries. Given the nature of IPR index data, the trade data – denominated in US dollars – is also collected every 5 years over the period 1976-2010.Footnote11Thus, the data used in analysis cover the following years: 1976, 1980, 1985, 1990, 1995, 2000, 2005 and 2010.
The value of the world's total imports has proliferated between 1976 and 2010. For my sample of countries, the value has increased by more than 25 times. If countries are grouped into three different income levels, the low-income countries are found to have increased their imports value most followed by the middle-income. In addition, among 18 different product categories the imports value has grown most for communication equipment, computing machinery and pharmaceuticals.
Since imports value comprises price and quantity, the significant increase in the value could either due to changes in price, quantity, or both. As a crude sensitivity check, I exploit the quantity-unit data provided by UN Comtrade. Ideally, the quantity data should be measured by the number of items traded (a pure quantity effect), but 80 per cent of the quantity data, thus the vast majority, is measured by counting weight in kilograms.Footnote12This quantity measure is imperfect to capture the volume of imports, as the number of items traded may not have changed but the unit weight of each item could change. If the weight of manufactured products has not increased significantly over time, looking at imports quantity measured by weight in kilograms could still be useful. For the same sample of countries, the weight of total imports experienced a similar scale of increase of 24.5 times from 1976 to 2010. This is only slightly smaller than the increase in imports value in the same period. In addition, the weight of imports, akin to imports value, is also found to have increased most in low-income countries, followed by mid- and high-income ones. Thus, albeit counting weight in kilograms is a rather crude measure for the volume of imports, the similar data features/patterns observed between the two are comforting.
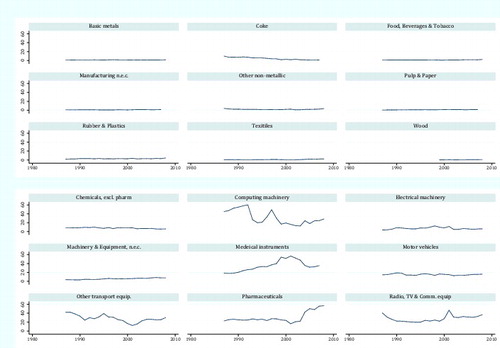
2.5. R&D intensity across product categories
What is the technology intensity of a product? Standard practice is to trace the R&D intensity of the industry producing the good as product-level information is typically not available. Thus, I link products (say computers) to industries (in this case office, accounting and computing machinery) and measure the technology intensity of a product category according to their corresponding industry R&D expenditures. The industry indicator for R&D intensity is only available at the level of 18 product groups, together covering all manufacturing industries. This data is retrieved from the OECD STAN Database for Structural Analysis for a sample of 33 countries and over the period 1987-2009. Industries are classified according to ISIC Revision 3 (ISIC Rev.3) and the intensity value is calculated as the share of R&D expenditures in total value added. Thanks to the concordance codes provided by Affendy, Yee, and Satoru (Citation2010), the product categories based on SITC Rev.2 classification can be directly linked to manufacturing industries classified by ISIC Rev.3.
Given that the variation of R&D intensity in an industry over time is rather limited, it seems sensible to smooth out the time variation (i.e. RD = ∑RDt/T).Footnote13In addition, I follow Rajan and Zingales (Citation1998) in using the values for the US as the baseline proxy for the other countries. This is a practical choice since technological industry characteristics are generally unobservable for most countries and must be proxied in a benchmark country. The US is chosen as the benchmark country because its data is generally of a better quality and less prone to bias due to market distortion (Nunn Citation2007; Rajan and Zingales Citation1998). While the actual R&D intensity value of a product group may differ from country to country, what really matters is the ranking of product groups based on those intensity values.Footnote14That is, regardless of the size of the intensity values, pharmaceuticals are likely to be R&D intensive products in other parts of the world just as in the US; while textiles, in comparison, will be R&D non-intensive across the globe. It is also shown in a recent paper by Ciccone and Papaioannou (Citation2016) that using the US data to proxy for industry technological characteristics for other countries is more likely to result in an attenuation bias than otherwise (i.e. the estimator yields a lower bound on the true effect).
As a robustness check and to show that results are unlikely to be biased due to the use of US data as proxy, I also consider using all the data that are available from the OECD STAN database and take an unweighted average of the R&D intensity values for the entire sample of OECD countries. provides an overview of the distribution of the product categories with varying degrees of R&D intensity. As anticipated, the majority of the product categories have a similar ranking between the two indicators but the size of the intensity values is noticeably smaller in the OECD indicator. For instance, the R&D intensity value of computing machinery (industry code C30) of the OECD indicator is only about half of the value of the US indicator (0.15 versus 0.3). As will be discussed later, despite the differences in intensity values, results remain qualitatively consistent.
Figure 2. Ranking of R&D intensity by product categories.
In addition to using the continuous approach, it is also helpful to consider splitting product categories into two major groups: R&D intensive versus R&D non-intensive as in Ivus (Citation2010). The rationale behind this is the following. If most of the variations are between the two groups, the magnitude of the effect should then remain similar to the continuous approach where IPR is interacted with the R&D intensity value of each product category. However, if product categories are highly heterogeneous, then treating different product categories as homogeneous in a group is likely to significantly underestimate the differential effect. As a standard practice, the product groups are split at the median value of R&D intensity (i.e. C29 in both rankings).
3. Empirical results
In this section, I discuss the main empirical findings with first results of de jure IPR protection and its robustness to alternative specifications, followed by a comparison with the results of de factor IPR protection. By splitting the analysis into different time periods and dividing importing countries into different income groups, I then study where is the differential effect mostly concentrated. Finally, I discuss the results of splitting imports by country of origin.
3.1. Analysis based on the full sample
The results for Equationequation (1)(1) using the baseline US R&D intensity indicator and the ordinary least squares (OLS) estimator are presented in the first two columns of where the coefficient β is, as anticipated, positive and highly significant. This suggests that for more R&D-intensive products, the impact of more stringent IPR protection is significantly larger than products that embody little R&D or technology. This coefficient implies that if a country increases its IPR protection, the imports value will increase by 22 per cent more for a product category at the 90th percentile of R&D intensity (Office, accounting and computing machinery) than for products at the 10th percentile (Textiles, leather and footwear).Footnote15
As noted before, this result could suffer from a price bias since imports value comprises price and quantity. Due to the lack of data on product-specific price deflators, nominal values of imports cannot be properly deflated.Footnote16As an alternative and a rough sensitivity check, I resort to using the quantity data measured by weight in kilograms. As shown in columns (3) and (4) of , comforting results emerge if analysis is based on this quantity measure. IPR remains to be more important for goods that are more R&D intensive than those that are less R&D intensive. What is interesting to note is that the magnitude of the differential effect has become much smaller. It is about half of the size of the analysis under imports value (column 2, ). This smaller magnitude could due to (a) the removal of the price effect; (b) a potential downward bias resulted from manufactured products have become lighter in weight. Despite of the possible causes, it is reassuring that results remain qualitatively consistent and the analysis based on the quantity measure, though imperfect, can be seen as a useful robustness check. This is especially true in light of the evidence that price had actually declined in some R&D-intensive sectors such as semiconductor or IT-related products (Aizcorbe Citation2006; Berndt and Rappaport Citation2001) which would bias against finding any significant effect when imports values are used and the weight of manufactured products are unlikely to have increased, if not decrease, over time.
To check that the results using imports value are not driven by price differentials between R&D-intensive and R&D non-intensive products, I also examine the growth of imports value. As shown in column (5) of , imports of R&D-intensive products indeed also grow faster than products that are less R&D intensive.
The results also remain qualitatively consistent when product categories are split into R&D-intensive and R&D non-intensive groups (see column 6 of ). The coefficient remains significantly different from zero and taking the estimate at face value, this suggests that more stringent IPR protection leads to an 8 per cent faster increase in the value of imports for the R&D-intensive product group than the R&D non-intensive group. Comparing this finding to the prior results obtained under the continuous approach where the differential effect for a R&D-intensive product category and a R&D non-intensive one could be as large as 22 per cent, this difference in the magnitude suggests that omitting product-specific variations in terms of technology content, as measured by R&D intensity, could drastically underestimate the size of the differential impact of IPR protection on manufacturing imports. Moreover, as noted earlier the import sensitivities differ highly between computing machinery and pharmaceuticals, even though both of them are classified as R&D-intensive products. Pooling them into one single group would not uncover such large differences.
3.2. Sensitivity analysis by dropping product groups
Since a few product categories have very large R&D intensity values, it seems sensible to check whether the results are driven by any specific product category. As shown in where each product category is excluded once at a time, results remain robust and qualitatively consistent. There are, however, two product categories that warrant further explanation, as the exclusion of these two categories affects the magnitude of the results most significantly. First, after excluding the pharmaceuticals (C2423) the size of the differential effect became much more pronounced than the baseline specification in which all the product categories are pooled together. This increase in the magnitude seems to imply that imports of pharmaceuticals may not be that sensitive to IPR protection as the R&D intensity value predicts. This finding is consistent with the work of Delgado, Kyle, and McGahan (Citation2013) who find that the impact of IPR protection on imports of pharmaceuticals is relatively low because merely copying pharmaceutical products is not likely to be successful in capturing the market shares as complementary resources in distribution also play a significant role. In addition, according to Cohen, Nelson, and Walsh (Citation2000) the pharmaceutical industry relies most heavily on secrecy in protecting its product innovations rather than patent protection. In contrast, there is a sizable drop in the magnitude of the differential effect after excluding computing machinery (C30). This might be because electronic products are relatively easier to imitate or copy through reverse engineering. Therefore, relative to other product categories imports of computing machinery are particularly sensitive to changes in IPR protection and leaving it out from the analysis would significantly weaken the underlying differential effect.
These results also remain robust when the alternative OECD R&D intensity indicator is used for analysis (column 7 in and column 2 in ). Similarly, the exclusion of pharmaceuticals leads to a stronger differential effect, and the exclusion of computing machinery leads to a significantly weaker effect. Whereas, dropping any other product category has modest impact on the quantitative results. Note that the coefficient estimate β appears to be over twice as large when the OECD intensity indicator is used (1.69 versus 0.72, column 7 of ), but this does not imply that the differential effect of IPR is doubled. Since the difference-in-difference approach captures a differential effect rather than a main effect, it is more informative to examine the marginal effect of IPR in relation to the associated R&D intensity values.
As shown in where 18 product categories are denoted by circles or triangles, depending on the intensity indicator used, the magnitude of the marginal effect remains very similar between the two intensity indicators.Footnote17
Figure 3. Comparing the size of the marginal effects.
3.3. Additional analyses
So far, the discussion of the results has been centred around the effect of de jure IPR protection. In the first column of , I show that the baseline result, from column (2) of , does not change, both qualitatively and quantitatively, if the alternative de factor IPR index is used for analysis.Footnote18This suggests that the prior results obtained under de jure IPR protection are not likely to be biased due to mismeasurement of the true stringency of IPR protection.
To gain further insights, I split the analysis into different time periods. If imports of technology-intensive products are truly more sensitive to the stringency of IPR protection as the theory predicts, it is likely that the differential effect will be more pronounced after 1995, the year in which the world started to rapidly improve IPR protection as mandated by the TRIPs agreement. The reason for this is that as the world improves IPR protection, there is a greater incentive to develop new and improved products that are more technologically advanced. As a result, the technology content of the products would increase and therefore the sensitivity to changes in IPR protection is likely to be higher as well.Footnote19As shown in column (2) of , the differential effect is present in both pre- and post-TRIPs time periods, suggesting that the qualitative results are not sensitive to the choice of time intervals. The size of the effect, however, is close to four times larger in the latter than the former period. This finding seems to support the notion that the TRIPs agreement enhances trade and it is especially conducive to trade in knowledge-intensive products.Footnote20If I divide the sample of importing countries by income groups (see Appendix for the full classification of countries by income groups []), I show that the effect is the highest among middle-income countries, while there is no significant effect for high-income and low-income countries (column 3, ). This finding is in line with what one would expect since middle-income countries improved their IPR most during the period of investigation (see ). Thus, if IPR protection is truly more effective in promoting knowledge-intensive trade, the differential effect should be most prominent for those countries. Moreover, it also seems to imply that it is not the absolute level of IPR protection that helps countries to import technology-intensive products but it is the level of protection relative to the other countries.
Table 1. The means of the Ginarte–Park IPR index.
Table 2. The differential effects of IPR on imports.
Table 3. Sensitivity check by dropping one product group at a time.
Since close to 60 per cent of the world's total patent applications originate from high-income economies (WIPO Citation2015), exports from these countries are more likely to have knowledge embodied than exports from the rest of the world. Thus, it seems probable that the differential effect should be most prominent for imports sourced from high-income countries. In column (4) of , I split imports by the origin of three different income groups and I find that the differential effect is not present for imports coming from high-income countries, but only present for imports from middle-income countries.Footnote21One possible explanation for this could be that the market expansion effect and the market power effects are cancelled out for imports coming from high-income economies. This finding, in fact, also resembles one of the results of Awokuse and Yin (Citation2010) in their analysis of China's imports. Another possible explanation could also be that the final production stage (and thus gross exports) of technology-intensive products are increasingly taking place in middle-income, rather than high-income countries. International production fragmentation has rapidly increased since the 1990s, in particular in producing high-tech goods such as machinery and electronics (Timmer et al. Citation2014).
Table 4. Additional analyses.
4. Conclusion
This paper is the first to rigorously examine whether increased IPR protection has a larger impact on imports of more R&D-intensive products. Employing a large panel data and the difference-in-difference approach pioneered by Rajan and Zingales (Citation1998), this paper finds that the impact of strengthening IPR protection is significantly stronger for imports of more technology-intensive products. The estimates imply that more stringent IPR protection leads to an increase in the value of imports by 22 per cent higher for products at the 90th percentile of R&D intensity (computing machinery) relative to products at the 10th percentile (textiles, leather, and footwear). This finding is robust to alternative measures of R&D intensity of product categories and to using a modified IPR index that corrects for the potential enforcement bias of patent protection in the country.
Another major finding of this study is that the product categories are highly heterogenous in their responsiveness to changes in IPR protection. The dichotomous approach, i.e. classifying products into technology-intensive and non-intensive groups, used in previous studies (e.g. Ivus Citation2010) is unable to reveal such differences within the group and is likely to significantly understate the magnitude of the differential effect of IPR on imports.
The differential effect is also found to be more prominent in the post-TRIPs period and in imports by the middle-income countries. This seems to suggest that by conforming to the minimum standards of intellectual property protection set out by the World Trade Organisation, the middle-income countries have benefited most in importing technologically advanced products. By splitting the origin of imports into high-, low- and middle-income countries, I showed that the majority of R&D-intensive imports do not originate from high-income countries as one would expect, but they originate from its own middle-income group of countries. I have argued that this finding could mean that (Equation1(1) ) the market expansion and market power effects are cancelled out for imports coming from advanced economies; or (2) that the production of some technology-intensive products (e.g. electronics) increasingly takes place in middle-income, rather than high-income countries due to international production fragmentation (Timmer et al. Citation2014). Irrespective of the underlying cause, this result seems to imply that by strengthening IPR protection the middle-income countries have succeeded in attracting more technology-intensive products from other middle-income countries.
Like most of the previous studies, a major limitation of this paper is that I cannot properly disentangle how much of the increase in imports value is due to increase in the quantity of products traded and how much is attributable to increase in price. This is an area for future research once more detailed data on product-specific prices have become available. Insofar as one is content with the assumption that the weight of manufactured products has not significantly increased over time, additional analyses based on imports measured by weight in kilograms offer comforting evidence that the results obtained in the paper are not solely driven by changes in price but also (and perhaps mainly) driven by changes in quantity.
Acknowledgments
The author would like to thank Robert Inklaar and Marcel Timmer for insightful comments and suggestions in previous versions of the paper. Helpful remarks by two anonymous referees are also gratefully acknowledged.
Disclosure statement
No potential conflict of interest was reported by the author.
Notes
1. The only study that has found clear evidence supporting the presence of the market power effect is by Smith (1999).
2. It is worth noting that rather than dividing import flows by product, Ivus (Citation2010) groups industries into two major categories. This approach, however, forfeits the more useful industry/product variations that could help to pin down the differential effect and place results into a better perspective. For example, albeit the market expansion effect is found to be stronger for patent-sensitive industries vis-à-vis those that are patent-insensitive, nothing can be said about the differences, which may well be large, within the group. The present study exploits the heterogeneities across each product group and show that pooling industries/products into one single group is likely to significantly underestimate the true differential effect of IPR protection on imports.
3. The major controversy over the TRIPs agreement is centred on the balance between the incentives to encourage new inventions and the ease with which developing countries can access the patented products and technology. A salient example is the pharmaceutical industry. The development costs for new drugs can be very high and it may not be developed without a large (monopolistic) return ensured by patent protection that is respected across the globe. The adoption of a uniformly strong patent protection worldwide would, however, raises the probability of very expensive treatments for the growing epidemics that makes the least-developed countries worse off (Kyle & McGahan, Citation2012).
4. Nominal imports values are used since there are no product-specific price deflators available to properly account for price changes over time. One could use more general price deflators as a proxy, such as the GDP or CPI price deflator (which would not have changed results presented in the paper). But these generic price deflators do not really do justice to differing time trends in product prices (e.g. semiconductors versus farm equipment). And they would also be subsumed by the time fixed effect introduced in the model. As will be shown later in the paper, the results are unlikely to be solely driven by changes in price.
5. To examine the differential effect, exports could also be used as the dependent variable since it is the other side of the same coin. This paper prefers to use imports as it attempts to shed light on how developing countries could attract knowledge-intensive goods, which can be an important channel of international knowledge diffusion and thus be a path towards higher growth and income levels (i.e. a growth-enhancing perspective). Given this goal/perspective, it seems more intuitive and straightforward to approach the analysis using imports.
6. By consulting the legal text of each country's patent laws, Rapp–Rozek made a rough and rather subjective assessment of their conformity with the minimum standards proposed as guidelines by the US Chamber of Commerce. More specifically, countries are assigned a score based on their 1984 patent system: 0 = No patent laws, 1 = Inadequate protection laws, no law prohibiting piracy, 2 = Seriously flawed laws, 3 = Flaws in law, some enforcement law, 4 = Generally good laws, and 5 = Protection and enforcement laws fully consistent with the minimum standards proposed by the United States Chamber of Commerce (Citation1987).
7. The World Governance Indicators consist of six indicators: voice and accountability, political stability and absence of violence, control of corruption, government effectiveness, regulatory quality, and rule of law.
8. In my sample, the country with the highest composite governance index is Finland (0.98), followed by Denmark and New Zealand. On the other hand, Somalia, Iraq, and Myanmar have the worst record of governance in the world.
9. The correlation between the G-P index and the ‘enforcement-adjusted’ index is above 0.86. This high correlation suggests that relying on the standard, de jure, measure of IPR protection is not likely to lead to a substantial estimation bias, despite the fact that this measure overstates ‘true’ IPR stringency.
10. Trade data based on SITC Rev.1, Rev.2 and Rev.3 are available since 1962, 1976, and 1988, respectively.
11. To increase the number of observations by including the year 1976, it is assumed that the value of the G-P index in 1976 is the same as in 1975. By doing so, the trade data could then be matched with the IPR index from 1976 onwards, instead of 1980. As a robustness check, analysis based on the more restrictive sample is also performed. Results and findings remain consistent (available upon request), though the exact magnitude of the coefficients differ somewhat.
12. More precisely, 78.5 per cent of the quantity data is measured by weight in kilograms, 12 per cent is missing, 7 per cent is measured by the number of items traded. The remaining 2.4 per cent of the data are measured in various other units, such as volume in cubic/liters.
13. Out of 18 product groups only 3 seem to have noticeable variations in their R&D intensity values over time, namely Computing machinery, Medical instruments, and Pharmaceuticals. The rest have a quite stable/constant R&D intensity values (see Appendix ).
14. Though relying only on rankings would affect the quantitative implications of my estimates.
15. This is calculated as: . Plugging in the values, the differential effect of IPR between these two product categories becomes: 0. 718*(0.316–0.0096) = 22 per cent.
16. Deflate nominal imports values by a general price deflator, such as GDP price deflator, will not change the results as this generic price deflator would be subsumed by the fixed effects introduced in the model.
17. To be precise, the differential effect for a product category at the 90th percentile of R&D intensity and one at the 10th percentile, measured by OECD intensity indicator, is approximately 24 per cent. This is very similar to the 22 per cent obtained when the US R&D intensity indicator is used.
18. The amount of observations decreases because the World Governance Indicators are only available from 1996 onwards.
19. Note, the increase in the technology content of the products does not necessarily mean the technology intensity, as measured by the share of R&D expenditures in total value added, would increase as well, as the increase in R&D expenditures is likely to be accompanied by an increase in value added. Moreover, the increase in technology content of the products is likely to be disproportionately more towards products that are R&D intensive relative to products that require little R&D.
20. Results remain robust if dependent variable is replaced with the quantity measure (imports in kilograms). The differential impact is found to be significant in the post-TRIPs period, while it is insignificant in the pre-TRIPs period. This is in line with the finding that the enforcement of TRIPs seems to be particularly helpful in promoting knowledge-intensive trade between countries.
21. This finding remains valid if I split the origin of imports into OECD and non-OECD countries. Results available upon request.
References
- Affendy, M., L. Yee, & M. Satoru. 2010. “Commodity-Industry Classification Proxy: A Correspondence Table Between SITC Revision 2 and ISIC Revision 3.” Journal of International Economic Studies 24: 185–202.
- Aizcorbe, A. 2006. “Why Did Semiconductor Price Indexes Fall so Fast in the 1990s? A Decomposition.” Economic Inquiry 44: 485–496.
- Awokuse, T. O., & H. Yin. 2010. “Does Stronger Intellectual Property Rights Protection Induce More Bilateral Trade? Evidence From China's Imports.” World Development 38: 1094–1104.
- Berndt, E. R., & N. J. Rappaport. 2001. “Price and Quality of Desktop and Mobile Personal Computers: A Quarter-Century Historical Overview.” American Economic Review 91: 268–273.
- Ciccone, A., & E. Papaioannou. 2016. “Estimating Cross-Industry Cross-Country Interaction Models Using Benchmark Industry Characteristics.” National Bureau of Economic Research Working Paper no. 22368, Cambridge, MA.
- Co, C. Y. 2004. “Do Patent Rights Regimes Matter?” Review of International Economics 12: 359–373.
- Cohen, W. M., R. R. Nelson, & J. P. Walsh. 2000. “Protecting their Intellectual Assets: Appropriability Conditions and Why U.S. Manufacturing Firms Patent (or Not).” National Bureau of Economic Research Working Paper Series no. 7552, Cambridge, MA.
- Delgado, M., M. Kyle, & A. M. McGahan. 2013. “Intellectual Property Protection and the Geography of Trade.” Journal of Industrial Economics 61: 733–762.
- Duguet, E., & C. LeLarge. 2012. “Does Patenting Increase the Private Incentives to Innovate? A Microeconomic Analysis.” Annals of Economics and Statistics, 107/108: 201–238.
- Falvey, R., N. Foster, & D. Greenaway. 2009. “Trade, Imitative Ability and Intellectual Property Rights.” Review of World Economics 145: 373–404.
- Fink, C., & C. Primo Braga. 1999. “How Stronger Protection of Intellectual Property Rights Affects International Trade Flows.” World Bank Working Papers no. 2051, Washington, DC. doi:10.1596/1813-9450-2051.
- Ginarte, J. C., & W. G. Park. 1997. “Determinants of Patent Rights: A Cross-National Study.” Research Policy 26: 283–301.
- Gould, D. M., & W. C. Gruben. 1996. “The Role of Intellectual Property Rights in Economic Growth.” Journal of Development Economics 48: 323–350.
- Ivus, O.. 2010. “Do Stronger Patent Rights Raise High-Tech Exports to the Developing World?” Journal of International Economics 81: 38–47.
- Kanwar, S., & R. Evenson. 2009. “On the Strength of Intellectual Property Protection that Nations Provide.” Journal of Development Economics 90: 50–56.
- Keller, W. 2004. “International Technology Diffusion.” Journal of Economic Literature 42: 752–782.
- Kyle, M. K., & A. M. McGahan. 2012. “Investments in Pharmaceuticals Before and After Trips.” Review of Economics and Statistics 94: 1157–1172.
- Maskus, K. E., & M. Penubarti. 1995. “How Trade-Related Are Intellectual Property-Rights.” Journal of International Economics 39: 227–248.
- Nunn, N. 2007. “Relationship-Specificity, Incomplete Contracts, and the Pattern of Trade.” Quarterly Journal of Economics 122: 569–600.
- Park, W. G. 2008. “International Patent Protection: 1960-2005.” Research Policy 37: 761–766.
- Rafiquzzaman, M. 2002. “The Impact of Patent Rights on International Trade: Evidence From Canada.” Canadian Journal of Economics 35: 307–330.
- Rajan, R. G., & L. Zingales. 1998. “Financial Dependence and Growth.” American Economic Review 88: 559–586.
- Rapp, R. T., & R. P. Rozek. 1990. “Benefits and Costs of Intellectual Property Protection in Developing-Countries.” Journal of World Trade 24: 75–102.
- Sakakibara, M., & L. Branstetter. 2001. “Do Stronger Patents Induce more Innovation? Evidence From the 1988 Japanese Patent Law Reforms.” Rand Journal of Economics 32: 77–100.
- Smith, P. J. 1999. “Are Weak Patent Rights a Barrier to US Exports?” Journal of International Economics 48: 151–177.
- Timmer, M. P., A. A. Erumban, B. Los, R. Stehrer, & G. J. de Vries. 2014. “Slicing up Global Value Chains.” Journal of Economic Perspectives 28: 99–118.
- UN Comtrade. 2015. United Nations Commodity Trade Statistics Database. http://comtrade.un.org/.
- United States Chamber of Commerce. 1987. Guidelines for Standards for the Protection and Enforcement of Intellectual Property Rights. Washington, DC: United States Chamber of Commerce.
- Weng, Y. H., C. H. Yang, & Y. J. Huang. 2009. “Intellectual Property Rights and US Information Goods Exports: The Role of Imitation Threat.” Journal of Cultural Economics 33: 109–134.
- WIPO. 2015. “Patents.” World Intellectual Property Office. http://www.wipo.int/export/sites/www/ ipstats/en/wipi/2015/pdf/wipi_2015_patents.pdf.
- World Bank. 2015. Worldwide Governance Indicators. http://govindicators.org/.
Appendix
Table A1. List of countries by income groups
Figure A1. R&D intensity variations over time